Device As A Service Market Analysis, Size, and Forecast 2025-2029: North America (Mexico), Europe (France, Germany, Italy, Spain, and UK), Middle East and Africa (UAE), APAC (Australia, China, India, Japan, and South Korea), South America (Brazil), and Rest of World (ROW)

Device As A Service Market Analysis, Size, and Forecast 2025-2029:
North America (Mexico), Europe (France, Germany, Italy, Spain, and UK), Middle East and Africa (UAE), APAC (Australia, China, India, Japan, and South Korea), South America (Brazil), and Rest of World (ROW)

Published: Apr 2025 213 Pages SKU: IRTNTR75261

Market Overview at a Glance

$498.27 B
Market Opportunity
34.6%
CAGR
31.4
YoY growth 2024-2025(%)

Device As A Service Market Size 2025-2029

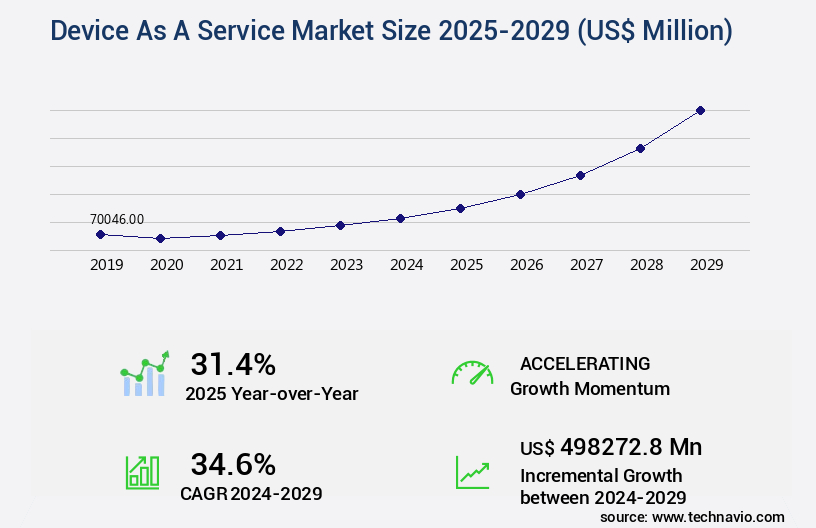
The device as a service market size is valued to increase USD 498.27 billion, at a CAGR of 34.6% from 2024 to 2029. Increased adoption of bring-your-own-device (BYOD) concept will drive the device as a service market.

Major Market Trends & Insights

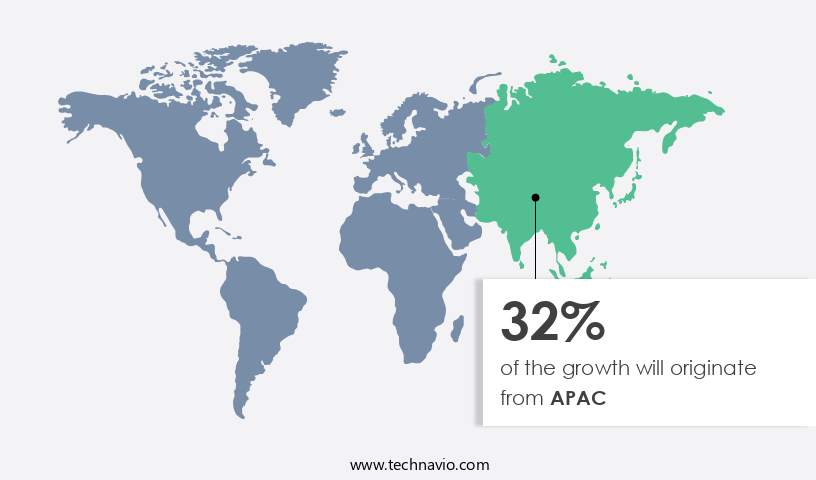
  • APAC dominated the market and accounted for a 32% growth during the forecast period.
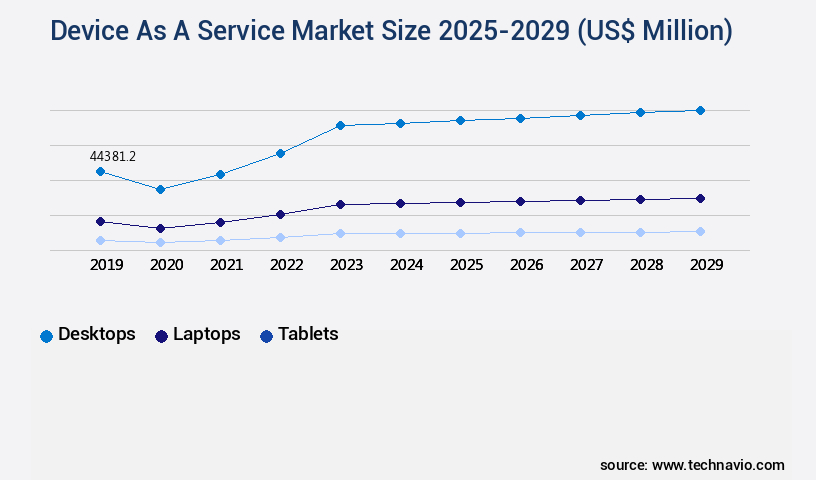
  • By Device - Desktops segment was valued at USD 44.38 billion in 2023
  • By Component - Hardware segment accounted for the largest market revenue share in 2023

Market Size & Forecast

  • Market Opportunities: 819.35 million
  • Market Future Opportunities: USD 498.27 billion 
  • CAGR : 34.6%
  • APAC: Largest market in 2023

Market Summary

  • The Device as a Service (DaaS) market represents a dynamic and continuously evolving landscape, driven by the increasing adoption of advanced technologies and shifting business requirements. Core technologies, such as Internet of Things (IoT) and cloud computing, are fueling the growth of this sector by enabling organizations to access devices and applications on a subscription basis. Applications of DaaS span various industries, including healthcare, manufacturing, and education, with growing demand for work flexibility and cost savings being key factors. However, challenges persist, including issues associated with system integration and data security. As the market unfolds, service types, such as hardware as a service (HaaS) and software as a service (SaaS), continue to gain traction.
  • According to recent studies, the HaaS segment is projected to grow at a significant rate, accounting for over 50% of the total DaaS market share by 2025. Regulatory compliance, particularly in sectors like healthcare and finance, also plays a crucial role in shaping the market's evolution. In the global context, regional markets like North America and Europe are leading the charge, while emerging economies in Asia Pacific and Latin America are poised for substantial growth. Related markets such as the IoT and cloud computing sectors are experiencing parallel growth, further fueling the potential for innovation and expansion within the DaaS market.

What will be the Size of the Device As A Service Market during the forecast period?

Device As A Service Market Size

Get Key Insights on Market Forecast (PDF) Request Free Sample

How is the Device As A Service Market Segmented and what are the key trends of market segmentation?

The device as a service industry research report provides comprehensive data (region-wise segment analysis), with forecasts and estimates in "USD million" for the period 2025-2029, as well as historical data from 2019-2023 for the following segments.

  • Device
    • Desktops
    • Laptops
    • Tablets
    • Others
  • Component
    • Hardware
    • Software
    • Services
  • Pricing Scheme
    • Subscription-based
    • Pay-as-you-go
  • Deployment Type
    • Cloud-Based
    • On-Premises
  • Geography
    • North America
      • US
      • Mexico
    • Europe
      • France
      • Germany
      • Italy
      • Spain
      • UK
    • Middle East and Africa
      • UAE
    • APAC
      • Australia
      • China
      • India
      • Japan
      • South Korea
    • South America
      • Brazil
    • Rest of World (ROW)

By Device Insights

The desktops segment is estimated to witness significant growth during the forecast period.

Desktop as a Service (DaaS) is a cloud-based solution that delivers virtual desktops to end-users via the internet. This offering enables organizations to streamline IT infrastructure and reduce costs. For instance, transitioning to DaaS eliminates the need for on-premises servers and infrastructure management, saving both time and resources for the organization. The adoption of DaaS is on the rise, with an estimated 25% of enterprises expected to implement this solution by 2023. Furthermore, the market for cloud-based desktop services is projected to expand by 30% within the next five years. These figures underscore the growing appeal of DaaS among businesses seeking operational efficiency and cost optimization.

Device As A Service Market Size

Request Free Sample

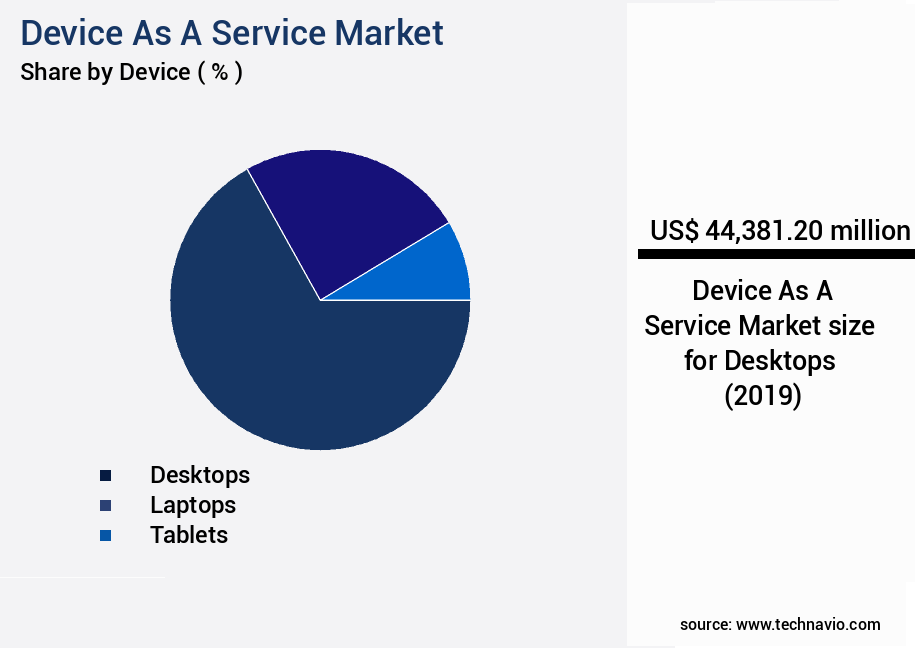
The Desktops segment was valued at USD 44.38 billion in 2019 and showed a gradual increase during the forecast period.

DaaS solutions offer various benefits, including remote diagnostics, software updates, disaster recovery, and predictive maintenance. These features enable businesses to maintain their IT infrastructure effectively and ensure a seamless end-user experience. Additionally, DaaS providers offer service level agreements (SLAs) and technical support, ensuring that businesses receive reliable and high-quality services. Moreover, DaaS solutions enable organizations to manage their hardware lifecycle more effectively through remote device management, hardware upgrades, and integration platforms. Furthermore, these solutions offer usage-based pricing, allowing businesses to pay only for the resources they consume. Security is another critical aspect of DaaS, with providers offering data encryption, network security, and security patch management.

These features help businesses protect their sensitive information and maintain compliance with industry regulations. In summary, the Desktop as a Service market is experiencing significant growth, with organizations increasingly adopting this solution to streamline IT infrastructure, optimize costs, and enhance operational efficiency. The market is expected to continue expanding, driven by the ongoing demand for cloud-based services and the need for remote work solutions.

Device As A Service Market Size

Request Free Sample

Regional Analysis

APAC is estimated to contribute 32% to the growth of the global market during the forecast period. Technavio's analysts have elaborately explained the regional trends and drivers that shape the market during the forecast period.

Device As A Service Market Share by Geography

See How Device As A Service Market Demand is Rising in APAC Request Free Sample

The US market is poised to significantly contribute to the global Device as a Service (DaaS) market's revenue growth. The increasing demand to manage on-premises data centers and cloud computing services drives this trend. With advanced technological infrastructure and a substantial presence of cloud service providers like Microsoft, Salesforce, Oracle, HP, and Adobe, the market's expansion is imminent. In fact, there were approximately 1,200 cloud data centers in the US as of 2022, hosting over 30% of the world's cloud workloads.

Moreover, around 70% of Fortune 500 companies have already adopted cloud services. These statistics underscore the market's potential, making the US a significant player in the DaaS landscape.

Market Dynamics

Our researchers analyzed the data with 2024 as the base year, along with the key drivers, trends, and challenges. A holistic analysis of drivers will help companies refine their marketing strategies to gain a competitive advantage.

The Device as a Service (DaaS) market is experiencing significant growth as businesses seek to optimize their IT infrastructure and reduce costs through remote device management tools. DaaS offers various benefits, including software licensing compliance, predictive maintenance algorithms, and usage-based pricing strategies. Cloud-based device monitoring is a crucial component of DaaS, enabling IT teams to keep track of their devices' performance and status in real-time. IT infrastructure optimization is another key advantage, as DaaS providers offer proactive maintenance schedules, automated patching workflows, and service level agreement metrics. Data encryption standards and disaster recovery planning are essential considerations in the DaaS market.

Providers offer robust security features, including remote access security protocols, to ensure data protection. Total cost of ownership analysis is a critical factor in the decision-making process, with consumption-based billing models and hardware lifecycle cost savings offering significant value. Compared to traditional IT asset management software, DaaS solutions offer more flexibility and scalability. For instance, a leading DaaS provider reported a 30% reduction in hardware costs for their clients, while another provider achieved a 45% decrease in help desk support tickets. The DaaS market's dynamics are shaped by various factors, including the increasing adoption of Software as a Service (SaaS) and Platform as a Service (PaaS) models.

Usage-based pricing strategies and proactive maintenance schedules are becoming industry standards, driving market growth. In conclusion, the DaaS market offers businesses significant benefits, including cost savings, improved IT infrastructure optimization, and enhanced security features. With the increasing adoption of cloud-based solutions and the shift towards consumption-based billing models, the market is poised for continued growth.

Device As A Service Market Size

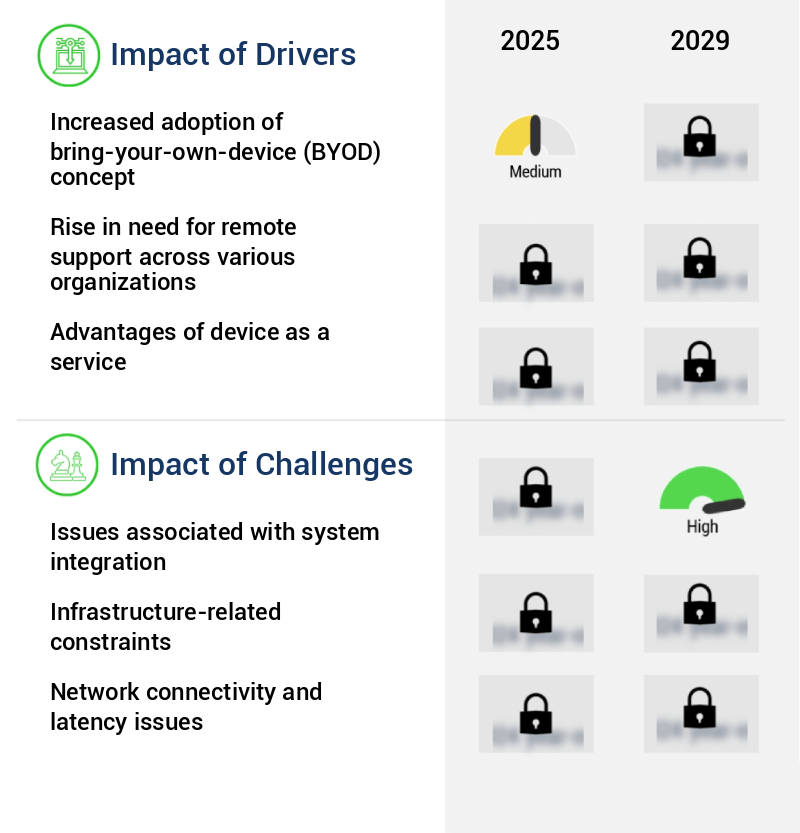
What are the key market drivers leading to the rise in the adoption of Device As A Service Industry?

  • The bring-your-own-device (BYOD) concept's widespread adoption serves as the primary catalyst for market growth. 
  • Enterprise mobility, the use of mobile devices for business purposes, has seen significant growth in recent years as employees increasingly prefer using smartphones, tablets, and laptops at work. This trend, known as Bring Your Own Device (BYOD), necessitates specific management and service delivery frameworks to ensure a secure and productive work environment. In March 2025, JumpCloud shared strategies for Managed Service Providers (MSPs) to enhance BYOD security. JumpCloud's platform offers unified device and identity management, simplifying policy enforcement and supporting the transition to a Zero Trust security model. This approach effectively addresses the challenges posed by diverse device ecosystems and evolving cyber threats.
  • Companies are increasingly focusing on providing the appropriate mobile devices to their employees, recognizing the importance of a mobile-first workforce. 

What are the market trends shaping the Device As A Service Industry?

  • The increasing demand for work flexibility represents a significant market trend.
  • Organizations are increasingly embracing flexible work models to optimize workforce productivity and enhance employee satisfaction. One such model gaining popularity is the hybrid work model, which accommodates a mix of in-office, remote, and mobile workers. This arrangement empowers employees with the freedom to determine their work location and style, leading to increased productivity. The hybrid work model offers numerous advantages for all stakeholders. Employees experience heightened flexibility, autonomy, and job satisfaction. Businesses benefit from reduced office space and maintenance expenses, as well as access to a broader talent pool.
  • The environment also gains from decreased commuting and reduced carbon footprint. The shift to the hybrid work model underscores the evolving nature of work dynamics. By adopting this flexible arrangement, organizations can attract and retain top talent, improve operational efficiency, and foster a more inclusive and sustainable work environment.

What challenges does the Device As A Service Industry face during its growth?

  • The integration of systems poses a significant challenge, impeding growth within the industry. This issue, which is of great concern to professionals, arises from the complexities involved in merging different systems and ensuring seamless communication between them. 
  • Device as a Service (DaaS) is gaining traction among enterprises as a cost-effective alternative to traditional IT deployment. Instead of purchasing or constructing their own infrastructure, enterprises opt for DaaS, which includes device procurement, software installation, configuration, and maintenance. This approach offers businesses flexibility and adaptability. However, integrating new software systems and IT infrastructure poses challenges. One significant issue is data transfer timing. Migrating large data volumes into a DaaS solution can be time-consuming. According to a study, the average data migration project takes between 6 to 12 months to complete. Moreover, the complexity of the integration process can lead to potential data loss or corruption, which could negatively impact business operations.
  • Another challenge is ensuring compatibility between the existing IT infrastructure and the new DaaS solution. Enterprises must evaluate the compatibility of their current systems with the DaaS provider's offerings. This process can be time-consuming and requires a significant investment in resources. Despite these challenges, the benefits of DaaS, such as cost savings, improved business processes, and increased efficiency, make it an attractive option for enterprises. As more businesses adopt this model, the market is expected to continue evolving, with providers offering more customized solutions to address the unique needs of various industries.

Exclusive Customer Landscape

The device as a service market forecasting report includes the adoption lifecycle of the market, covering from the innovator's stage to the laggard's stage. It focuses on adoption rates in different regions based on penetration. Furthermore, the device as a service market report also includes key purchase criteria and drivers of price sensitivity to help companies evaluate and develop their market growth analysis strategies.

Device As A Service Market Share by Geography

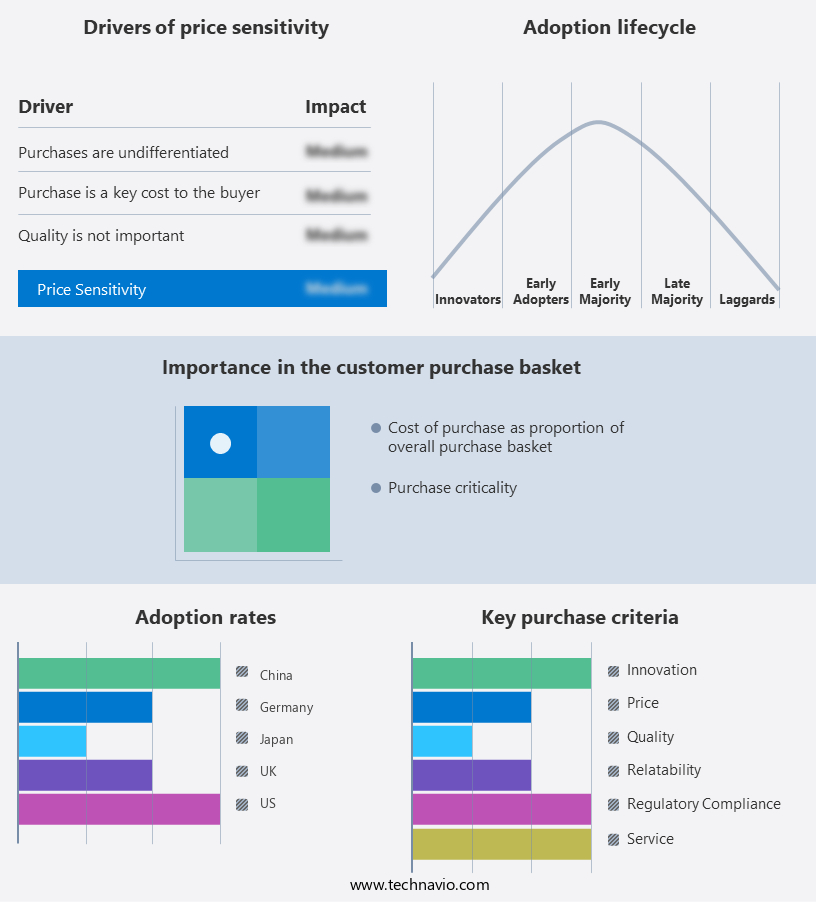
 Customer Landscape of Device As A Service Industry

Competitive Landscape & Market Insights

Companies are implementing various strategies, such as strategic alliances, device as a service market forecast, partnerships, mergers and acquisitions, geographical expansion, and product/service launches, to enhance their presence in the industry.

Dell Technologies - This company specializes in providing Device as a Service (DaaS) offerings for hardware, software, communications, and media industries. 

The industry research and growth report includes detailed analyses of the competitive landscape of the market and information about key companies, including:

  • Dell Technologies
  • HP Inc.
  • Lenovo
  • Microsoft
  • Apple
  • Samsung
  • Cisco Systems
  • Intel
  • IBM
  • Google
  • Acer
  • Asus
  • Fujitsu
  • Toshiba
  • Panasonic
  • Compucentro
  • CHG-MERIDIAN
  • Econocom
  • 3stepIT
  • Grenke

Qualitative and quantitative analysis of companies has been conducted to help clients understand the wider business environment as well as the strengths and weaknesses of key industry players. Data is qualitatively analyzed to categorize companies as pure play, category-focused, industry-focused, and diversified; it is quantitatively analyzed to categorize companies as dominant, leading, strong, tentative, and weak.

Recent Development and News in Device As A Service Market

  • In January 2024, IBM announced the expansion of its Device as a Service (DaaS) offering to include Internet of Things (IoT) devices, marking a significant strategic shift in the company's DaaS portfolio (IBM Press Release). This move aimed to cater to the growing demand for IoT device management in various industries.
  • In March 2024, Microsoft entered into a partnership with Fujitsu to offer Device as a Service solutions to joint customers in the Asia Pacific region. This collaboration enabled both companies to leverage their respective strengths in cloud services and IT infrastructure to deliver comprehensive DaaS offerings (Microsoft News Center).
  • In May 2024, Lenovo completed the acquisition of IBM's x86 server business, which included the associated DaaS contracts. This acquisition expanded Lenovo's DaaS capabilities and strengthened its position in the market (Lenovo Press Release).
  • In April 2025, Apple unveiled its new AppleCare+ for Business DaaS offering, which included financing options for businesses to purchase Apple devices and receive priority support services. This move aimed to capture a larger share of the enterprise market by providing a more comprehensive DaaS solution (Apple Newsroom).

Dive into Technavio's robust research methodology, blending expert interviews, extensive data synthesis, and validated models for unparalleled Device As A Service Market insights. See full methodology.

Market Scope

Report Coverage

Details

Page number

213

Base year

2024

Historic period

2019-2023

Forecast period

2025-2029

Growth momentum & CAGR

Accelerate at a CAGR of 34.6%

Market growth 2025-2029

USD 498272.8 million

Market structure

Fragmented

YoY growth 2024-2025(%)

31.4

Key countries

US, China, Germany, Japan, UK, Australia, India, France, Brazil, UAE, Rest of World (ROW), Saudi Arabia, France, South Korea, Mexico, Italy, and Spain

Competitive landscape

Leading Companies, Market Positioning of Companies, Competitive Strategies, and Industry Risks

Request Free Sample

Research Analyst Overview

  • In the dynamic and evolving landscape of IT, device monitoring and IT asset management have emerged as crucial components of effective business operations. The deployment of devices, be it laptops, desktops, or mobile devices, necessitates a robust approach to manage and optimize their usage. Cloud-based services have revolutionized device management through subscription models, enabling operational efficiency and cost optimization. Remote diagnostics and software updates ensure seamless device performance, while disaster recovery and network security safeguard critical IT infrastructure. The shift towards usage-based pricing and predictive maintenance has further enhanced the ROI of device management. These strategies allow businesses to allocate resources efficiently, minimize downtime, and optimize hardware lifecycle management.
  • Customer service and end-user experience are paramount in today's competitive business environment. Service level agreements and help desk support ensure that issues are addressed promptly, while data backup and software licensing models provide peace of mind. Integration platforms facilitate the seamless interaction between various IT components, enabling technical support and data encryption to protect sensitive information. Hardware upgrades and security patch management are essential for maintaining optimal device performance and network security. Remote access and remote device management enable businesses to manage their IT assets from anywhere, ensuring business continuity and flexibility. The ongoing evolution of device management continues to reshape the IT landscape, offering innovative solutions for cost optimization, operational efficiency, and enhanced end-user experiences.

What are the Key Data Covered in this Device As A Service Market Research and Growth Report?

  • What is the expected growth of the Device As A Service Market between 2025 and 2029?

    • USD 498.27 billion, at a CAGR of 34.6%

  • What segmentation does the market report cover?

    • The report segmented by Device (Desktops, Laptops, Tablets, and Others), Component (Hardware, Software, and Services), Pricing Scheme (Subscription-based and Pay-as-you-go), Geography (North America, APAC, Europe, South America, and Middle East and Africa), and Deployment Type (Cloud-Based and On-Premises)

  • Which regions are analyzed in the report?

    • North America, APAC, Europe, South America, and Middle East and Africa

  • What are the key growth drivers and market challenges?

    • Increased adoption of bring-your-own-device (BYOD) concept, Issues associated with system integration

  • Who are the major players in the Device As A Service Market?

    • Key Companies Dell Technologies, HP Inc., Lenovo, Microsoft, Apple, Samsung, Cisco Systems, Intel, IBM, Google, Acer, Asus, Fujitsu, Toshiba, Panasonic, Compucentro, CHG-MERIDIAN, Econocom, 3stepIT, and Grenke

Market Research Insights

  • The Device as a Service (DaaS) market continues to gain traction, with businesses increasingly recognizing the value of outsourcing device management to third-party providers. According to recent estimates, the global DaaS market is projected to reach USD150 billion by 2026, growing at a compound annual growth rate of 22%. This significant expansion can be attributed to the numerous benefits DaaS offers, including problem management, capacity planning, data governance, and compliance with various standards. Moreover, the shift towards consumption-based billing models and the integration of managed services, such as proactive maintenance, system performance monitoring, and company management, have further fueled the market's growth.
  • In contrast, traditional methods of device management, which relied on in-house teams and capital expenditures, often resulted in high upfront costs and limited scalability. By adopting DaaS, businesses can optimize resource allocation, reduce risk, and ensure uptime, making it an essential component of modern IT strategies.

We can help! Our analysts can customize this device as a service market research report to meet your requirements.

Get in touch

1 Executive Summary

  • 1.1 Market overview
    • Executive Summary - Chart on Market Overview
    • Executive Summary - Data Table on Market Overview
    • Executive Summary - Chart on Global Market Characteristics
    • Executive Summary - Chart on Market by Geography
    • Executive Summary - Chart on Market Segmentation by Device
    • Executive Summary - Chart on Market Segmentation by Component
    • Executive Summary - Chart on Market Segmentation by Pricing Scheme
    • Executive Summary - Chart on Incremental Growth
    • Executive Summary - Data Table on Incremental Growth
    • Executive Summary - Chart on Company Market Positioning

2 Technavio Analysis

  • 2.1 Analysis of price sensitivity, lifecycle, customer purchase basket, adoption rates, and purchase criteria
    • Analysis of price sensitivity, lifecycle, customer purchase basket, adoption rates, and purchase criteria
  • 2.2 Criticality of inputs and Factors of differentiation
    • Overview on criticality of inputs and factors of differentiation
  • 2.3 Factors of disruption
    • Overview on factors of disruption
  • 2.4 Impact of drivers and challenges
    • Impact of drivers and challenges in 2024 and 2029

3 Market Landscape

  • 3.1 Market ecosystem
    • Parent Market
    • Data Table on - Parent Market
  • 3.2 Market characteristics
    • Market characteristics analysis
  • 3.3 Value chain analysis
    • Value chain analysis

4 Market Sizing

  • 4.1 Market definition
    • Offerings of companies included in the market definition
  • 4.2 Market segment analysis
    • Market segments
  • 4.3 Market size 2024
    • 4.4 Market outlook: Forecast for 2024-2029
      • Chart on Global - Market size and forecast 2024-2029 ($ million)
      • Data Table on Global - Market size and forecast 2024-2029 ($ million)
      • Chart on Global Market: Year-over-year growth 2024-2029 (%)
      • Data Table on Global Market: Year-over-year growth 2024-2029 (%)

    5 Historic Market Size

    • 5.1 Global Device As A Service Market 2019 - 2023
      • Historic Market Size - Data Table on Global Device As A Service Market 2019 - 2023 ($ million)
    • 5.2 Device segment analysis 2019 - 2023
      • Historic Market Size - Device Segment 2019 - 2023 ($ million)
    • 5.3 Component segment analysis 2019 - 2023
      • Historic Market Size - Component Segment 2019 - 2023 ($ million)
    • 5.4 Pricing Scheme segment analysis 2019 - 2023
      • Historic Market Size - Pricing Scheme Segment 2019 - 2023 ($ million)
    • 5.5 Geography segment analysis 2019 - 2023
      • Historic Market Size - Geography Segment 2019 - 2023 ($ million)
    • 5.6 Country segment analysis 2019 - 2023
      • Historic Market Size - Country Segment 2019 - 2023 ($ million)

    6 Qualitative Analysis

    • 6.1 The AI impact on Global Device as a Service Market

      7 Five Forces Analysis

      • 7.1 Five forces summary
        • Five forces analysis - Comparison between 2024 and 2029
      • 7.2 Bargaining power of buyers
        • Bargaining power of buyers - Impact of key factors 2024 and 2029
      • 7.3 Bargaining power of suppliers
        • Bargaining power of suppliers - Impact of key factors in 2024 and 2029
      • 7.4 Threat of new entrants
        • Threat of new entrants - Impact of key factors in 2024 and 2029
      • 7.5 Threat of substitutes
        • Threat of substitutes - Impact of key factors in 2024 and 2029
      • 7.6 Threat of rivalry
        • Threat of rivalry - Impact of key factors in 2024 and 2029
      • 7.7 Market condition
        • Chart on Market condition - Five forces 2024 and 2029

      8 Market Segmentation by Device

      • 8.1 Market segments
        • Chart on Device - Market share (2024-2029) (%)
        • Data Table on Device - Market share (2024-2029) (%)
      • 8.2 Comparison by Device
        • Chart on Comparison by Device
        • Data Table on Comparison by Device
      • 8.3 Desktops - Market size and forecast (2024-2029)
        • Chart on Desktops - Market size and forecast (2024-2029) ($ million)
        • Data Table on Desktops - Market size and forecast (2024-2029) ($ million)
        • Chart on Desktops - Year-over-year growth (2024-2029) (%)
        • Data Table on Desktops - Year-over-year growth (2024-2029) (%)
      • 8.4 Laptops - Market size and forecast (2024-2029)
        • Chart on Laptops - Market size and forecast (2024-2029) ($ million)
        • Data Table on Laptops - Market size and forecast (2024-2029) ($ million)
        • Chart on Laptops - Year-over-year growth (2024-2029) (%)
        • Data Table on Laptops - Year-over-year growth (2024-2029) (%)
      • 8.5 Tablets - Market size and forecast (2024-2029)
        • Chart on Tablets - Market size and forecast (2024-2029) ($ million)
        • Data Table on Tablets - Market size and forecast (2024-2029) ($ million)
        • Chart on Tablets - Year-over-year growth (2024-2029) (%)
        • Data Table on Tablets - Year-over-year growth (2024-2029) (%)
      • 8.6 Others - Market size and forecast (2024-2029)
        • Chart on Others - Market size and forecast (2024-2029) ($ million)
        • Data Table on Others - Market size and forecast (2024-2029) ($ million)
        • Chart on Others - Year-over-year growth (2024-2029) (%)
        • Data Table on Others - Year-over-year growth (2024-2029) (%)
      • 8.7 Market opportunity by Device
        • Market opportunity by Device ($ million)
        • Data Table on Market opportunity by Device ($ million)

      9 Market Segmentation by Component

      • 9.1 Market segments
        • Chart on Component - Market share (2024-2029) (%)
        • Data Table on Component - Market share (2024-2029) (%)
      • 9.2 Comparison by Component
        • Chart on Comparison by Component
        • Data Table on Comparison by Component
      • 9.3 Hardware - Market size and forecast (2024-2029)
        • Chart on Hardware - Market size and forecast (2024-2029) ($ million)
        • Data Table on Hardware - Market size and forecast (2024-2029) ($ million)
        • Chart on Hardware - Year-over-year growth (2024-2029) (%)
        • Data Table on Hardware - Year-over-year growth (2024-2029) (%)
      • 9.4 Software - Market size and forecast (2024-2029)
        • Chart on Software - Market size and forecast (2024-2029) ($ million)
        • Data Table on Software - Market size and forecast (2024-2029) ($ million)
        • Chart on Software - Year-over-year growth (2024-2029) (%)
        • Data Table on Software - Year-over-year growth (2024-2029) (%)
      • 9.5 Services - Market size and forecast (2024-2029)
        • Chart on Services - Market size and forecast (2024-2029) ($ million)
        • Data Table on Services - Market size and forecast (2024-2029) ($ million)
        • Chart on Services - Year-over-year growth (2024-2029) (%)
        • Data Table on Services - Year-over-year growth (2024-2029) (%)
      • 9.6 Market opportunity by Component
        • Market opportunity by Component ($ million)
        • Data Table on Market opportunity by Component ($ million)

      10 Market Segmentation by Pricing Scheme

      • 10.1 Market segments
        • Chart on Pricing Scheme - Market share (2024-2029) (%)
        • Data Table on Pricing Scheme - Market share (2024-2029) (%)
      • 10.2 Comparison by Pricing Scheme
        • Chart on Comparison by Pricing Scheme
        • Data Table on Comparison by Pricing Scheme
      • 10.3 Subscription-based - Market size and forecast (2024-2029)
        • Chart on Subscription-based - Market size and forecast (2024-2029) ($ million)
        • Data Table on Subscription-based - Market size and forecast (2024-2029) ($ million)
        • Chart on Subscription-based - Year-over-year growth (2024-2029) (%)
        • Data Table on Subscription-based - Year-over-year growth (2024-2029) (%)
      • 10.4 Pay-as-you-go - Market size and forecast (2024-2029)
        • Chart on Pay-as-you-go - Market size and forecast (2024-2029) ($ million)
        • Data Table on Pay-as-you-go - Market size and forecast (2024-2029) ($ million)
        • Chart on Pay-as-you-go - Year-over-year growth (2024-2029) (%)
        • Data Table on Pay-as-you-go - Year-over-year growth (2024-2029) (%)
      • 10.5 Market opportunity by Pricing Scheme
        • Market opportunity by Pricing Scheme ($ million)
        • Data Table on Market opportunity by Pricing Scheme ($ million)

      11 Market Segmentation by Deployment Type

      • 11.1 Market segments
        • Chart on Deployment Type - Market share (2024-2029) (%)
        • Data Table on Deployment Type - Market share (2024-2029) (%)
      • 11.2 Comparison by Deployment Type
        • Chart on Comparison by Deployment Type
        • Data Table on Comparison by Deployment Type
      • 11.3 Cloud-Based - Market size and forecast (2024-2029)
        • Chart on Cloud-Based - Market size and forecast (2024-2029) ($ million)
        • Data Table on Cloud-Based - Market size and forecast (2024-2029) ($ million)
        • Chart on Cloud-Based - Year-over-year growth (2024-2029) (%)
        • Data Table on Cloud-Based - Year-over-year growth (2024-2029) (%)
      • 11.4 On-Premises - Market size and forecast (2024-2029)
        • Chart on On-Premises - Market size and forecast (2024-2029) ($ million)
        • Data Table on On-Premises - Market size and forecast (2024-2029) ($ million)
        • Chart on On-Premises - Year-over-year growth (2024-2029) (%)
        • Data Table on On-Premises - Year-over-year growth (2024-2029) (%)
      • 11.5 Market opportunity by Deployment Type
        • Market opportunity by Deployment Type ($ million)
        • Data Table on Market opportunity by Deployment Type ($ million)

      12 Customer Landscape

      • 12.1 Customer landscape overview
        • Analysis of price sensitivity, lifecycle, customer purchase basket, adoption rates, and purchase criteria

      13 Geographic Landscape

      • 13.1 Geographic segmentation
        • Chart on Market share by geography 2024-2029 (%)
        • Data Table on Market share by geography 2024-2029 (%)
      • 13.2 Geographic comparison
        • Chart on Geographic comparison
        • Data Table on Geographic comparison
      • 13.3 North America - Market size and forecast 2024-2029
        • Chart on North America - Market size and forecast 2024-2029 ($ million)
        • Data Table on North America - Market size and forecast 2024-2029 ($ million)
        • Chart on North America - Year-over-year growth 2024-2029 (%)
        • Data Table on North America - Year-over-year growth 2024-2029 (%)
      • 13.4 APAC - Market size and forecast 2024-2029
        • Chart on APAC - Market size and forecast 2024-2029 ($ million)
        • Data Table on APAC - Market size and forecast 2024-2029 ($ million)
        • Chart on APAC - Year-over-year growth 2024-2029 (%)
        • Data Table on APAC - Year-over-year growth 2024-2029 (%)
      • 13.5 Europe - Market size and forecast 2024-2029
        • Chart on Europe - Market size and forecast 2024-2029 ($ million)
        • Data Table on Europe - Market size and forecast 2024-2029 ($ million)
        • Chart on Europe - Year-over-year growth 2024-2029 (%)
        • Data Table on Europe - Year-over-year growth 2024-2029 (%)
      • 13.6 South America - Market size and forecast 2024-2029
        • Chart on South America - Market size and forecast 2024-2029 ($ million)
        • Data Table on South America - Market size and forecast 2024-2029 ($ million)
        • Chart on South America - Year-over-year growth 2024-2029 (%)
        • Data Table on South America - Year-over-year growth 2024-2029 (%)
      • 13.7 Middle East and Africa - Market size and forecast 2024-2029
        • Chart on Middle East and Africa - Market size and forecast 2024-2029 ($ million)
        • Data Table on Middle East and Africa - Market size and forecast 2024-2029 ($ million)
        • Chart on Middle East and Africa - Year-over-year growth 2024-2029 (%)
        • Data Table on Middle East and Africa - Year-over-year growth 2024-2029 (%)
      • 13.8 US - Market size and forecast 2024-2029
        • Chart on US - Market size and forecast 2024-2029 ($ million)
        • Data Table on US - Market size and forecast 2024-2029 ($ million)
        • Chart on US - Year-over-year growth 2024-2029 (%)
        • Data Table on US - Year-over-year growth 2024-2029 (%)
      • 13.9 China - Market size and forecast 2024-2029
        • Chart on China - Market size and forecast 2024-2029 ($ million)
        • Data Table on China - Market size and forecast 2024-2029 ($ million)
        • Chart on China - Year-over-year growth 2024-2029 (%)
        • Data Table on China - Year-over-year growth 2024-2029 (%)
      • 13.10 Canada - Market size and forecast 2024-2029
        • Chart on Canada - Market size and forecast 2024-2029 ($ million)
        • Data Table on Canada - Market size and forecast 2024-2029 ($ million)
        • Chart on Canada - Year-over-year growth 2024-2029 (%)
        • Data Table on Canada - Year-over-year growth 2024-2029 (%)
      • 13.11 Japan - Market size and forecast 2024-2029
        • Chart on Japan - Market size and forecast 2024-2029 ($ million)
        • Data Table on Japan - Market size and forecast 2024-2029 ($ million)
        • Chart on Japan - Year-over-year growth 2024-2029 (%)
        • Data Table on Japan - Year-over-year growth 2024-2029 (%)
      • 13.12 India - Market size and forecast 2024-2029
        • Chart on India - Market size and forecast 2024-2029 ($ million)
        • Data Table on India - Market size and forecast 2024-2029 ($ million)
        • Chart on India - Year-over-year growth 2024-2029 (%)
        • Data Table on India - Year-over-year growth 2024-2029 (%)
      • 13.13 UK - Market size and forecast 2024-2029
        • Chart on UK - Market size and forecast 2024-2029 ($ million)
        • Data Table on UK - Market size and forecast 2024-2029 ($ million)
        • Chart on UK - Year-over-year growth 2024-2029 (%)
        • Data Table on UK - Year-over-year growth 2024-2029 (%)
      • 13.14 South Korea - Market size and forecast 2024-2029
        • Chart on South Korea - Market size and forecast 2024-2029 ($ million)
        • Data Table on South Korea - Market size and forecast 2024-2029 ($ million)
        • Chart on South Korea - Year-over-year growth 2024-2029 (%)
        • Data Table on South Korea - Year-over-year growth 2024-2029 (%)
      • 13.15 Germany - Market size and forecast 2024-2029
        • Chart on Germany - Market size and forecast 2024-2029 ($ million)
        • Data Table on Germany - Market size and forecast 2024-2029 ($ million)
        • Chart on Germany - Year-over-year growth 2024-2029 (%)
        • Data Table on Germany - Year-over-year growth 2024-2029 (%)
      • 13.16 Australia - Market size and forecast 2024-2029
        • Chart on Australia - Market size and forecast 2024-2029 ($ million)
        • Data Table on Australia - Market size and forecast 2024-2029 ($ million)
        • Chart on Australia - Year-over-year growth 2024-2029 (%)
        • Data Table on Australia - Year-over-year growth 2024-2029 (%)
      • 13.17 Mexico - Market size and forecast 2024-2029
        • Chart on Mexico - Market size and forecast 2024-2029 ($ million)
        • Data Table on Mexico - Market size and forecast 2024-2029 ($ million)
        • Chart on Mexico - Year-over-year growth 2024-2029 (%)
        • Data Table on Mexico - Year-over-year growth 2024-2029 (%)
      • 13.18 Market opportunity by geography
        • Market opportunity by geography ($ million)
        • Data Tables on Market opportunity by geography ($ million)
      • 13.19 US - Market size and forecast (2024-2029)
        • Chart on US - Market size and forecast (2024-2029) ($ million)
        • Data Table on US - Market size and forecast (2024-2029) ($ million)
        • Chart on US - Year-over-year growth (2024-2029) (%)
        • Data Table on US - Year-over-year growth (2024-2029) (%)
      • 13.20 France - Market size and forecast (2024-2029)
        • Chart on France - Market size and forecast (2024-2029) ($ million)
        • Data Table on France - Market size and forecast (2024-2029) ($ million)
        • Chart on France - Year-over-year growth (2024-2029) (%)
        • Data Table on France - Year-over-year growth (2024-2029) (%)
      • 13.21 Brazil - Market size and forecast (2024-2029)
        • Chart on Brazil - Market size and forecast (2024-2029) ($ million)
        • Data Table on Brazil - Market size and forecast (2024-2029) ($ million)
        • Chart on Brazil - Year-over-year growth (2024-2029) (%)
        • Data Table on Brazil - Year-over-year growth (2024-2029) (%)
      • 13.22 UAE - Market size and forecast (2024-2029)
        • Chart on UAE - Market size and forecast (2024-2029) ($ million)
        • Data Table on UAE - Market size and forecast (2024-2029) ($ million)
        • Chart on UAE - Year-over-year growth (2024-2029) (%)
        • Data Table on UAE - Year-over-year growth (2024-2029) (%)
      • 13.23 Rest of World (ROW) - Market size and forecast (2024-2029)
        • Chart on Rest of World (ROW) - Market size and forecast (2024-2029) ($ million)
        • Data Table on Rest of World (ROW) - Market size and forecast (2024-2029) ($ million)
        • Chart on Rest of World (ROW) - Year-over-year growth (2024-2029) (%)
        • Data Table on Rest of World (ROW) - Year-over-year growth (2024-2029) (%)
      • 13.24 Saudi Arabia - Market size and forecast (2024-2029)
        • Chart on Saudi Arabia - Market size and forecast (2024-2029) ($ million)
        • Data Table on Saudi Arabia - Market size and forecast (2024-2029) ($ million)
        • Chart on Saudi Arabia - Year-over-year growth (2024-2029) (%)
        • Data Table on Saudi Arabia - Year-over-year growth (2024-2029) (%)
      • 13.25 Italy - Market size and forecast (2024-2029)
        • Chart on Italy - Market size and forecast (2024-2029) ($ million)
        • Data Table on Italy - Market size and forecast (2024-2029) ($ million)
        • Chart on Italy - Year-over-year growth (2024-2029) (%)
        • Data Table on Italy - Year-over-year growth (2024-2029) (%)
      • 13.26 Spain - Market size and forecast (2024-2029)
        • Chart on Spain - Market size and forecast (2024-2029) ($ million)
        • Data Table on Spain - Market size and forecast (2024-2029) ($ million)
        • Chart on Spain - Year-over-year growth (2024-2029) (%)
        • Data Table on Spain - Year-over-year growth (2024-2029) (%)

      14 Drivers, Challenges, and Opportunity/Restraints

      • 14.1 Market drivers
        • 14.2 Market challenges
          • 14.3 Impact of drivers and challenges
            • Impact of drivers and challenges in 2024 and 2029
          • 14.4 Market opportunities/restraints

            15 Competitive Landscape

            • 15.1 Overview
              • 15.2 Competitive Landscape
                • Overview on criticality of inputs and factors of differentiation
              • 15.3 Landscape disruption
                • Overview on factors of disruption
              • 15.4 Industry risks
                • Impact of key risks on business

              16 Competitive Analysis

              • 16.1 Companies profiled
                • Companies covered
              • 16.2 Market positioning of companies
                • Matrix on companies position and classification
              • 16.3 Dell Technologies
                • Dell Technologies - Overview
                • Dell Technologies - Product / Service
                • Dell Technologies - Key offerings
              • 16.4 HP Inc.
                • HP Inc. - Overview
                • HP Inc. - Product / Service
                • HP Inc. - Key offerings
              • 16.5 Lenovo
                • Lenovo - Overview
                • Lenovo - Product / Service
                • Lenovo - Key offerings
              • 16.6 Microsoft
                • Microsoft - Overview
                • Microsoft - Product / Service
                • Microsoft - Key offerings
              • 16.7 Apple
                • Apple - Overview
                • Apple - Product / Service
                • Apple - Key offerings
              • 16.8 Samsung
                • Samsung - Overview
                • Samsung - Product / Service
                • Samsung - Key offerings
              • 16.9 Cisco Systems
                • Cisco Systems - Overview
                • Cisco Systems - Product / Service
                • Cisco Systems - Key offerings
              • 16.10 Intel
                • Intel - Overview
                • Intel - Product / Service
                • Intel - Key offerings
              • 16.11 IBM
                • IBM - Overview
                • IBM - Product / Service
                • IBM - Key offerings
              • 16.12 Google
                • Google - Overview
                • Google - Product / Service
                • Google - Key offerings
              • 16.13 Acer
                • Acer - Overview
                • Acer - Product / Service
                • Acer - Key offerings
              • 16.14 Asus
                • Asus - Overview
                • Asus - Product / Service
                • Asus - Key offerings
              • 16.15 Fujitsu
                • Fujitsu - Overview
                • Fujitsu - Product / Service
                • Fujitsu - Key offerings
              • 16.16 Toshiba
                • Toshiba - Overview
                • Toshiba - Product / Service
                • Toshiba - Key offerings
              • 16.17 Panasonic
                • Panasonic - Overview
                • Panasonic - Product / Service
                • Panasonic - Key offerings
              • 16.18 Compucentro
                • Compucentro - Overview
                • Compucentro - Product / Service
                • Compucentro - Key offerings
              • 16.19 CHG-MERIDIAN
                • CHG-MERIDIAN - Overview
                • CHG-MERIDIAN - Product / Service
                • CHG-MERIDIAN - Key offerings
              • 16.20 Econocom
                • Econocom - Overview
                • Econocom - Product / Service
                • Econocom - Key offerings
              • 3stepIT
                • 3stepIT - Overview
                • 3stepIT - Product / Service
                • 3stepIT - Key offerings
              • 16.22 Grenke
                • Grenke - Overview
                • Grenke - Product / Service
                • Grenke - Key offerings
              • 16.23 Accenture PLC
                • Accenture PLC - Overview
                • Accenture PLC - Product / Service
                • Accenture PLC - Key offerings
              • 16.24 Acer Inc.
                • Acer Inc. - Overview
                • Acer Inc. - Product / Service
                • Acer Inc. - Key offerings
              • 16.25 Amazon.com Inc.
                • Amazon.com Inc. - Overview
                • Amazon.com Inc. - Product / Service
                • Amazon.com Inc. - Key offerings
              • 16.26 Apple Inc.
                • Apple Inc. - Overview
                • Apple Inc. - Product / Service
                • Apple Inc. - Key offerings
              • 16.27 Capgemini Services SAS
                • Capgemini Services SAS - Overview
                • Capgemini Services SAS - Product / Service
                • Capgemini Services SAS - Key offerings
              • 16.28 Cisco Systems Inc.
                • Cisco Systems Inc. - Overview
                • Cisco Systems Inc. - Product / Service
                • Cisco Systems Inc. - Key offerings
              • 16.29 Citrix Systems Inc.
                • Citrix Systems Inc. - Overview
                • Citrix Systems Inc. - Product / Service
                • Citrix Systems Inc. - Key offerings
              • 16.30 Cognizant Technology Solutions Corp.
                • Cognizant Technology Solutions Corp. - Overview
                • Cognizant Technology Solutions Corp. - Product / Service
                • Cognizant Technology Solutions Corp. - Key offerings
              • 16.31 Computacenter plc
                • Computacenter plc - Overview
                • Computacenter plc - Product / Service
                • Computacenter plc - Key offerings
              • 16.32 Dell Technologies Inc.
                • Dell Technologies Inc. - Overview
                • Dell Technologies Inc. - Product / Service
                • Dell Technologies Inc. - Key offerings
              • 16.33 DXC Technology Co.
                • DXC Technology Co. - Overview
                • DXC Technology Co. - Product / Service
                • DXC Technology Co. - Key offerings
              • 16.34 Foxway AB
                • Foxway AB - Overview
                • Foxway AB - Product / Service
                • Foxway AB - Key offerings
              • 16.35 HP Inc.
                • HP Inc. - Overview
                • HP Inc. - Product / Service
                • HP Inc. - Key offerings
              • 16.36 Intel Corp.
                • Intel Corp. - Overview
                • Intel Corp. - Product / Service
                • Intel Corp. - Key offerings
              • 16.37 Lenovo Group Ltd.
                • Lenovo Group Ltd. - Overview
                • Lenovo Group Ltd. - Product / Service
                • Lenovo Group Ltd. - Key offerings
              • 16.38 Microsoft Corp.
                • Microsoft Corp. - Overview
                • Microsoft Corp. - Product / Service
                • Microsoft Corp. - Key offerings
              • 16.39 PC Connection Inc.
                • PC Connection Inc. - Overview
                • PC Connection Inc. - Product / Service
                • PC Connection Inc. - Key offerings
              • 16.40 Samsung Electronics Co. Ltd.
                • Samsung Electronics Co. Ltd. - Overview
                • Samsung Electronics Co. Ltd. - Product / Service
                • Samsung Electronics Co. Ltd. - Key offerings
              • 16.41 Telia Co. AB
                • Telia Co. AB - Overview
                • Telia Co. AB - Product / Service
                • Telia Co. AB - Key offerings

              17 Appendix

              • 17.1 Scope of the report
                • 17.2 Inclusions and exclusions checklist
                  • Inclusions checklist
                  • Exclusions checklist
                • 17.3 Currency conversion rates for US$
                  • Currency conversion rates for US$
                • 17.4 Research methodology
                  • Research methodology
                • 17.5 Data procurement
                  • Information sources
                • 17.6 Data validation
                  • Data validation
                • 17.7 Validation techniques employed for market sizing
                  • Validation techniques employed for market sizing
                • 17.8 Data synthesis
                  • Data synthesis
                • 17.9 360 degree market analysis
                  • 360 degree market analysis
                • 17.10 List of abbreviations
                  • List of abbreviations

                Research Methodology

                Technavio presents a detailed picture of the market by way of study, synthesis, and summation of data from multiple sources. The analysts have presented the various facets of the market with a particular focus on identifying the key industry influencers. The data thus presented is comprehensive, reliable, and the result of extensive research, both primary and secondary.

                INFORMATION SOURCES

                Primary sources

                • Manufacturers and suppliers
                • Channel partners
                • Industry experts
                • Strategic decision makers

                Secondary sources

                • Industry journals and periodicals
                • Government data
                • Financial reports of key industry players
                • Historical data
                • Press releases

                DATA ANALYSIS

                Data Synthesis

                • Collation of data
                • Estimation of key figures
                • Analysis of derived insights

                Data Validation

                • Triangulation with data models
                • Reference against proprietary databases
                • Corroboration with industry experts

                REPORT WRITING

                Qualitative

                • Market drivers
                • Market challenges
                • Market trends
                • Five forces analysis

                Quantitative

                • Market size and forecast
                • Market segmentation
                • Geographical insights
                • Competitive landscape

                Interested in this report?

                Get your sample now to see our research methodology and insights!

                Download Now

                Frequently Asked Questions

                Device As A Service market growth will increase by $ 498272.8 mn during 2025-2029 .

                The Device As A Service market is expected to grow at a CAGR of 34.6% during 2025-2029 .

                Device As A Service market is segmented by Device( Desktops, Laptops, Tablets, Others) Component( Hardware, Software, Services) Pricing Scheme( Subscription-based, Pay-as-you-go, Europe, South America, Middle East and Africa)

                Dell Technologies, HP Inc., Lenovo, Microsoft, Apple, Samsung, Cisco Systems, Intel, IBM, Google, Acer, Asus, Fujitsu, Toshiba, Panasonic, Compucentro, CHG-MERIDIAN, Econocom, 3stepIT, Grenke are a few of the key vendors in the Device As A Service market.

                APAC will register the highest growth rate of 32% among the other regions. Therefore, the Device As A Service market in APAC is expected to garner significant business opportunities for the vendors during the forecast period.

                US, China, Germany, Japan, UK, Australia, India, France, Brazil, UAE, Rest of World (ROW), Saudi Arabia, France, South Korea, Mexico, Italy, Spain

                • Increased adoption of bring-your-own-device (BYOD) conceptEnterprise mobility has gained traction in the corporate world in response to the rising preferences among employees to use their smartphones is the driving factor this market.
                • tablets is the driving factor this market.
                • and laptops at work. BYOD demands specific management and service delivery frameworks to guarantee an electronically secure and productive work environment. In March 2025 is the driving factor this market.
                • JumpCloud presented strategies for Managed Service Providers (MSPs) to improve BYOD security. JumpClouds platform provides unified device and identity management is the driving factor this market.
                • simplifying policy enforcement and supporting the shift to a Zero Trust security model. This approach effectively tackles the challenges posed by diverse device ecosystems and evolving cyber threats. The major focus of companies is on providing the right mobile devices to their employees. Thus is the driving factor this market.
                • the implementation of the BYOD policy is an emerging trend. The growth of the BYOD model means that a large number of operating systems and mobile devices is the driving factor this market.
                • including iOS is the driving factor this market.
                • Android is the driving factor this market.
                • Windows is the driving factor this market.
                • smartphones is the driving factor this market.
                • and tablets is the driving factor this market.
                • can access secure computer networks in the company. The BYOD policy aims at providing a cost-effective solution to enterprises is the driving factor this market.
                • mobility to employees is the driving factor this market.
                • and enhanced productivity. BYOD helps firms reduce their IT costs by reducing capital expenditure and improving efficiency. For the successful implementation of BYOD is the driving factor this market.
                • companies are providing device as a service solutions to ensure an environment where the employees of an organization can use their devices using a robust Internet connectivity infrastructure. For instance is the driving factor this market.
                • Citrix provides desktop-as-a-service solutions is the driving factor this market.
                • using which employees can have consistent is the driving factor this market.
                • secure is the driving factor this market.
                • reliable access to all the applications and tools on any device and from any location. Therefore is the driving factor this market.
                • the increased adoption of the BYOD concept is expected to have a positive impact on the growth of the global device as a service market during the forecast period. is the driving factor this market.

                The Device As A Service market vendors should focus on grabbing business opportunities from the Desktops segment as it accounted for the largest market share in the base year.