Digital Twin In Logistics Market Analysis, Size, and Forecast 2026-2030: North America (US, Canada, and Mexico), APAC (China, Japan, and India), Europe (Germany, UK, and France), Middle East and Africa (UAE, Saudi Arabia, and South Africa), South America (Brazil, Argentina, and Colombia), and Rest of World (ROW)

Digital Twin In Logistics Market Analysis, Size, and Forecast 2026-2030:
North America (US, Canada, and Mexico), APAC (China, Japan, and India), Europe (Germany, UK, and France), Middle East and Africa (UAE, Saudi Arabia, and South Africa), South America (Brazil, Argentina, and Colombia), and Rest of World (ROW)

Published: Apr 2026 305 Pages SKU: IRTNTR81440

Market Overview at a Glance

$4.12 B
Market Opportunity
26.3%
CAGR 2025 - 2030
32.8%
North America Growth
$888.6 Mn
Software segment 2024

Digital Twin In Logistics Market Size 2026-2030

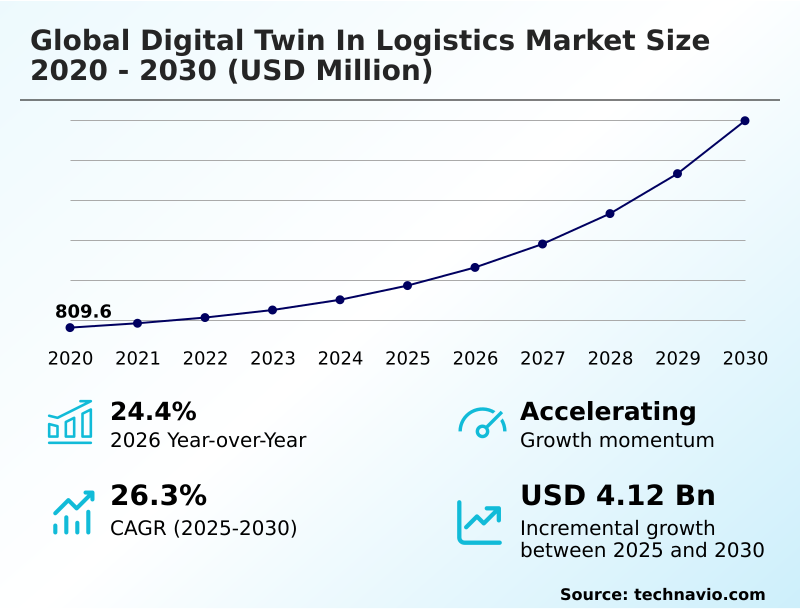
The digital twin in logistics market size is valued to increase by USD 4.12 billion, at a CAGR of 26.3% from 2025 to 2030. Raising demand for real time visibility and operational transparency will drive the digital twin in logistics market.

Major Market Trends & Insights

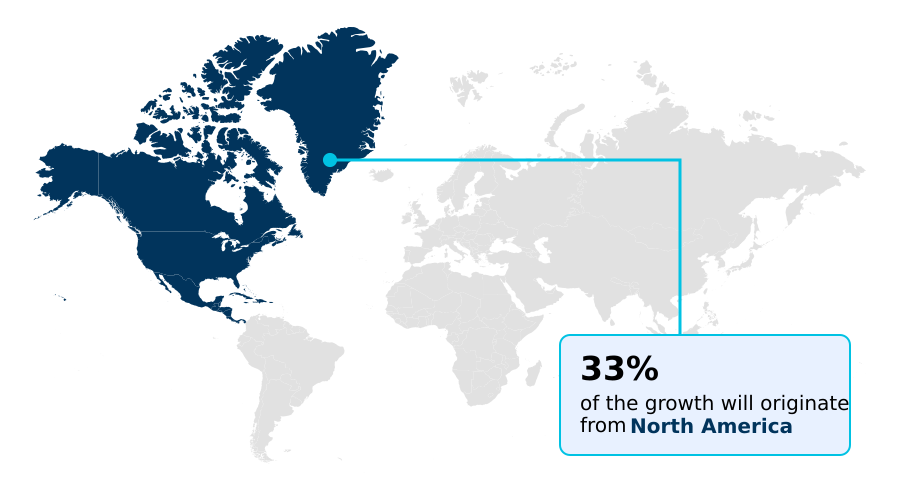
  • North America dominated the market and accounted for a 32.8% growth during the forecast period.
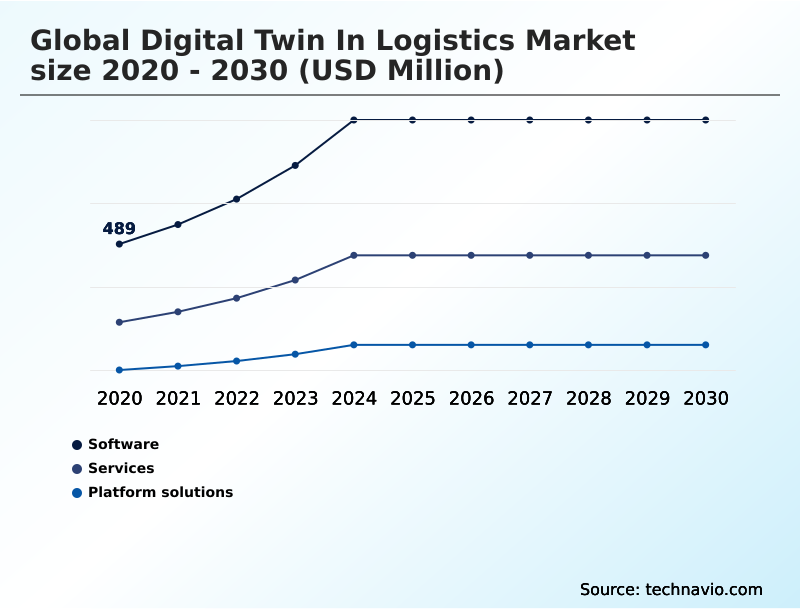
  • By Component - Software segment was valued at USD 888.6 million in 2024
  • By Deployment - Cloud-based segment accounted for the largest market revenue share in 2024

Market Size & Forecast

  • Market Opportunities: USD 5.17 billion
  • Market Future Opportunities: USD 4.12 billion
  • CAGR from 2025 to 2030 : 26.3%

Market Summary

  • The digital twin in logistics market is defined by the creation of dynamic, virtual replicas of physical assets, processes, and entire supply chains. This technology enables organizations to move beyond static analysis to a real-time, data-driven operational paradigm. By integrating continuous data streams from IoT sensor integration and enterprise systems, these high-fidelity models provide unprecedented supply chain visibility.
  • For example, a third-party logistics provider can use a digital twin to simulate the ripple effects of port congestion on its global network, testing various rerouting strategies in a virtual environment to mitigate delays without disrupting live operations. The adoption is fueled by the need for enhanced supply chain resilience and efficiency.
  • Key applications include predictive simulation for maintenance, warehouse automation planning, and fleet management optimization. However, challenges related to data harmonization and the initial investment required for sophisticated physical AI integration remain significant considerations for businesses aiming to deploy these advanced systems.
  • The ultimate goal is to achieve autonomous logistics, where virtual models not only mirror but also actively optimize physical world operations through agentic AI orchestration.

What will be the Size of the Digital Twin In Logistics Market during the forecast period?

Get Key Insights on Market Forecast (PDF) Request Free Sample

How is the Digital Twin In Logistics Market Segmented?

The digital twin in logistics industry research report provides comprehensive data (region-wise segment analysis), with forecasts and estimates in "USD million" for the period 2026-2030, as well as historical data from 2020-2024 for the following segments.

  • Component
    • Software
    • Services
    • Platform solutions
  • Deployment
    • Cloud-based
    • On-premises
  • Application
    • Warehouse optimization
    • Predictive maintenance
    • Supply chain planning
    • Fleet management
  • Geography
    • North America
      • US
      • Canada
      • Mexico
    • APAC
      • China
      • Japan
      • India
    • Europe
      • Germany
      • UK
      • France
    • Middle East and Africa
      • UAE
      • Saudi Arabia
      • South Africa
    • South America
      • Brazil
      • Argentina
      • Colombia
    • Rest of World (ROW)

By Component Insights

The software segment is estimated to witness significant growth during the forecast period.

The software component represents the core intelligence layer, enabling the creation and management of high-fidelity models for logistics operations. These solutions leverage prescriptive analytics and advanced algorithms to translate physical asset data into a dynamic virtual environment for predictive simulation.

Modern software integrates real-time data synchronization to power autonomous logistics decisions, moving beyond simple visualization to active operational control.

For instance, by using these platforms, organizations improve forecast accuracy for demand planning simulation by up to 25%, directly impacting inventory costs.

The emphasis is on developing robust systems that support complex operational efficiency metrics and risk mitigation simulation, allowing for preemptive adjustments to supply chain disruptions and enabling comprehensive asset lifecycle management before issues arise in the physical world.

Request Free Sample

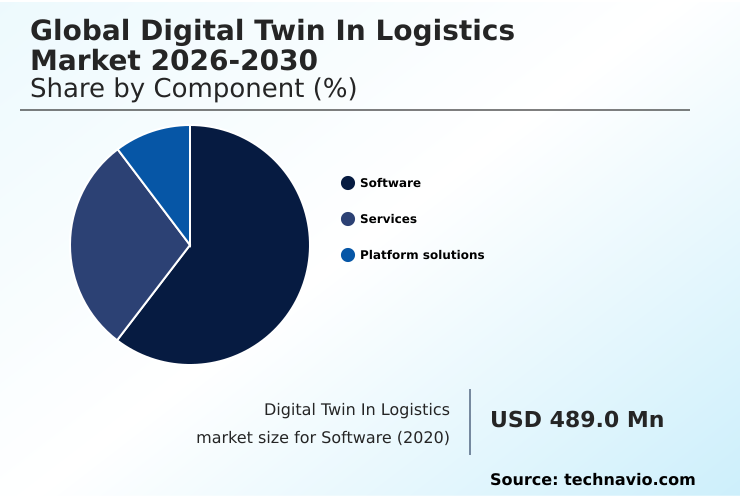
The Software segment was valued at USD 888.6 million in 2024 and showed a gradual increase during the forecast period.

Request Free Sample

Regional Analysis

North America is estimated to contribute 32.8% to the growth of the global market during the forecast period.Technavio’s analysts have elaborately explained the regional trends and drivers that shape the market during the forecast period.

See How Digital Twin In Logistics Market Demand is Rising in North America Request Free Sample

The market's geographic distribution reflects both technological maturity and economic ambition. North America currently leads, contributing 32.8% of the market's incremental growth, driven by advanced e-commerce fulfillment optimization and a focus on supply chain resilience.

High adoption of real-time logistics tracking and predictive maintenance for fleets is common.

In contrast, APAC is the fastest-growing region, with a projected expansion rate of 27.5%, fueled by massive investments in smart port logistics twin projects and manufacturing-centric supply chains.

Countries in the region are leveraging cross-border logistics simulation to manage complex trade corridors. Europe is focused on sustainable logistics planning and intralogistics optimization, using carbon footprint modeling to align with stringent environmental regulations.

The development of a multi-modal transport twin is a key priority for enhancing regional connectivity and efficiency.

Market Dynamics

Our researchers analyzed the data with 2025 as the base year, along with the key drivers, trends, and challenges. A holistic analysis of drivers will help companies refine their marketing strategies to gain a competitive advantage.

  • Strategically, the adoption of digital twin technology is moving from a competitive advantage to an operational necessity. Understanding the benefits of a logistics digital twin is the first step, but enterprises are now focused on quantifying the digital twin ROI in logistics.
  • This involves assessing how a real-time fleet management digital twin can reduce fuel costs or how a digital twin for warehouse optimization can increase throughput without major capital expenditure. The cost of implementing a digital twin remains a key consideration, especially as solutions become more complex with the integration of generative AI in logistics simulation.
  • For specialized sectors, the value is clearer; for example, a digital twin for cold chain logistics provides auditable proof of temperature integrity, which is invaluable. Similarly, a digital twin for port management can significantly reduce vessel turnaround times.
  • The technology is also becoming a key enabler for corporate sustainability goals, with digital twin for logistics sustainability platforms providing precise carbon accounting. Forward-thinking companies are now exploring building a warehouse digital twin not just for efficiency but for worker safety simulation.
  • As the market matures, decisions will increasingly be based on finding the right digital twin technology vendors that offer scalable digital twin platforms for shipping and transportation, ensuring that the investment supports long-term strategic goals beyond immediate operational gains.
  • Firms using these platforms for supply chain visibility have reported a twofold improvement in their ability to respond to disruptions compared to those without.

What are the key market drivers leading to the rise in the adoption of Digital Twin In Logistics Industry?

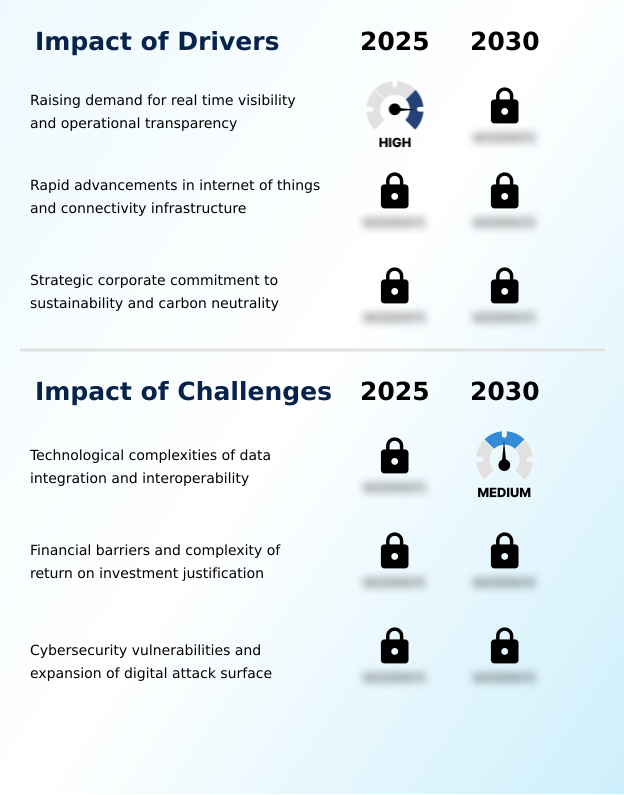
  • The market is primarily driven by the increasing demand for real-time visibility and operational transparency across complex global supply chains.

  • Market growth is fundamentally propelled by the urgent need for enhanced visibility and efficiency across global supply chains. The demand for a real-time supply chain control tower has intensified, with implementations leading to a 20% improvement in asset utilization.
  • The rapid proliferation of IoT in warehouse management and advanced sensor technology provides the granular data essential for high-fidelity digital replicas.
  • This connectivity, paired with advancements in logistics simulation software, allows for precise modeling of everything from warehouse workflows to multi-modal transport networks.
  • Furthermore, a strong corporate commitment to sustainability is driving adoption, as a digital twin for logistics can model and reduce carbon emissions by over 15% through optimized routing and energy management, directly supporting circular economy logistics initiatives.

What are the market trends shaping the Digital Twin In Logistics Industry?

  • A significant market trend is the integration of generative artificial intelligence with predictive simulation. This combination is advancing digital twins from descriptive models to prescriptive decision-making tools.

  • Key market trends are centered on the fusion of predictive analytics with immersive and autonomous technologies. The integration of generative AI is enabling a shift toward a prescriptive digital twin for supply chain, allowing systems to autonomously suggest optimal responses to disruptions, improving predictive accuracy by over 30%.
  • Concurrently, the emergence of the logistics metaverse and 3D supply chain visualization is transforming user interaction, creating immersive environments for virtual warehouse design and training. This approach reduces design errors by up to 40% before physical implementation. A third major trend is the move toward collaborative data ecosystems and interconnected platforms, supporting a comprehensive logistics network digital model.
  • This enhances real-time logistics tracking and coordination across multiple stakeholders, enabling more resilient and efficient global operations.

What challenges does the Digital Twin In Logistics Industry face during its growth?

  • A key challenge impeding market growth is the technological complexity associated with data integration and achieving interoperability between disparate logistics systems.

  • Despite strong drivers, significant challenges hinder widespread adoption. The primary hurdle is the technical complexity of data integration, with interoperability issues consuming over 60% of project timelines and driving up costs. Many organizations struggle with harmonizing data from legacy systems to feed a logistics twin, which is essential for accurate demand forecasting simulation and AI-driven logistics planning.
  • Another key restraint is the financial barrier, as the initial investment in building an end-to-end digital thread for logistics can be 3-4 times higher than for traditional analytics platforms, making ROI justification difficult for some stakeholders.
  • Finally, the expanded digital attack surface creates significant cybersecurity vulnerabilities, requiring robust security protocols to protect sensitive operational data within the supply chain stress testing and simulation environments.

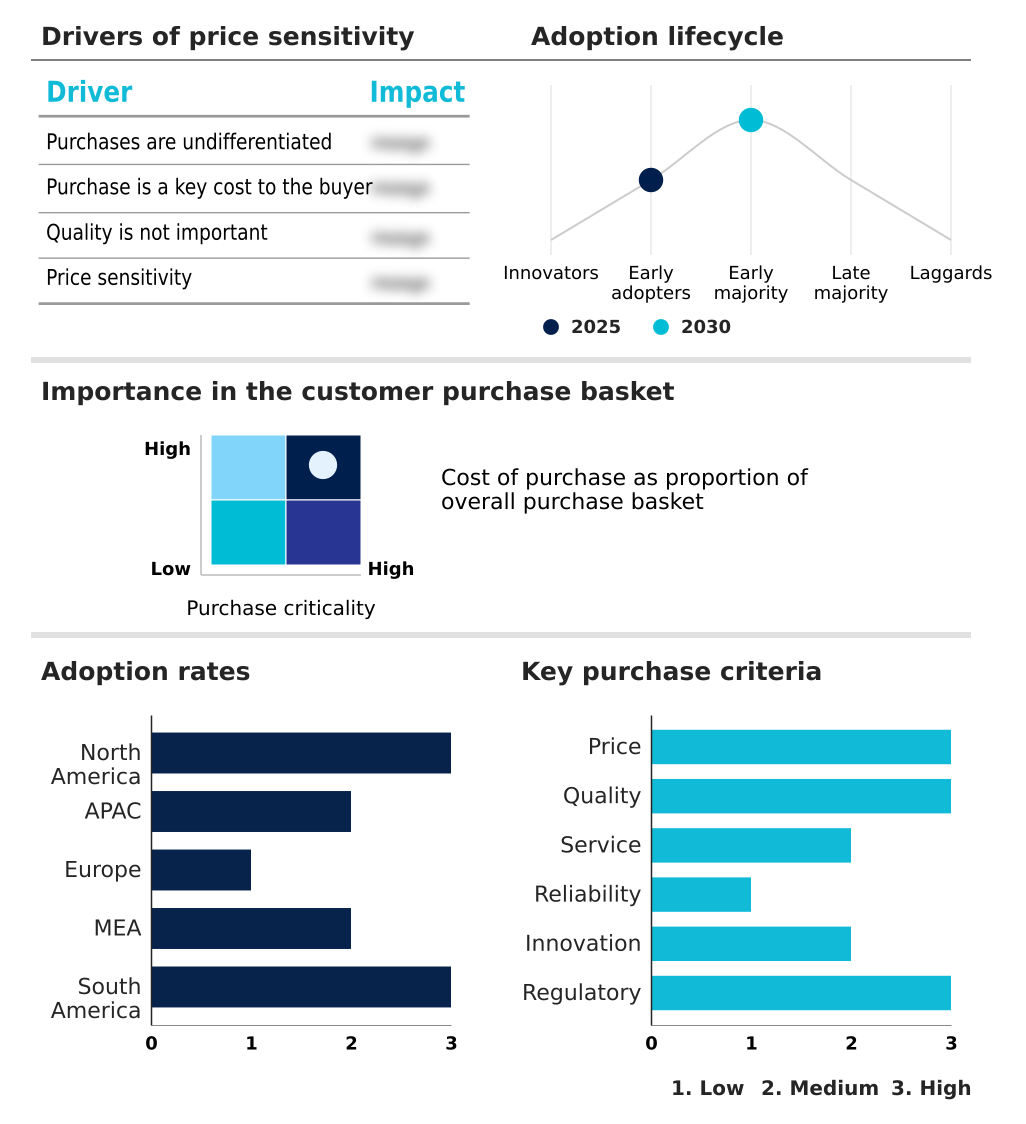
Exclusive Technavio Analysis on Customer Landscape

The digital twin in logistics market forecasting report includes the adoption lifecycle of the market, covering from the innovator’s stage to the laggard’s stage. It focuses on adoption rates in different regions based on penetration. Furthermore, the digital twin in logistics market report also includes key purchase criteria and drivers of price sensitivity to help companies evaluate and develop their market growth analysis strategies.

Customer Landscape of Digital Twin In Logistics Industry

Competitive Landscape

Companies are implementing various strategies, such as strategic alliances, digital twin in logistics market forecast, partnerships, mergers and acquisitions, geographical expansion, and product/service launches, to enhance their presence in the industry.

Amazon Web Services Inc. - Offerings include a scalable cloud infrastructure platform that enables the creation of integrated IoT-based virtual replicas and advanced logistics simulations for end-to-end supply chain management.

The industry research and growth report includes detailed analyses of the competitive landscape of the market and information about key companies, including:

  • Amazon Web Services Inc.
  • Bentley Systems Inc.
  • Blue Yonder Group Inc.
  • Dassault Systemes SE
  • General Electric Co.
  • Google LLC
  • Hexagon AB
  • IBM Corp.
  • Kinaxis Inc.
  • Manhattan Associates Inc.
  • Microsoft Corp.
  • NVIDIA Corp.
  • Oracle Corp.
  • Palantir Technologies Inc.
  • PTC Inc.
  • Robert Bosch GmbH
  • Rockwell Automation Inc.
  • SAP SE
  • Siemens AG
  • Unity Technologies Inc.

Qualitative and quantitative analysis of companies has been conducted to help clients understand the wider business environment as well as the strengths and weaknesses of key industry players. Data is qualitatively analyzed to categorize companies as pure play, category-focused, industry-focused, and diversified; it is quantitatively analyzed to categorize companies as dominant, leading, strong, tentative, and weak.

Recent Development and News in Digital twin in logistics market

  • In April 2025, PSA Singapore announced the successful deployment of a comprehensive digital twin for the second phase of the Tuas Port expansion, creating a virtual environment to coordinate automated guided vehicles and quay cranes.
  • In July 2025, Cainiao Smart Logistics Network introduced an end-to-end digital twin for its cross-border distribution centers in Southeast Asia, simulating the entire parcel journey from manufacturer to final delivery.
  • In March 2025, the Saudi Ports Authority finalized the creation of a digital twin for the Jeddah Islamic Port to optimize the berthing schedules of mega-vessels and simulate the impact of terminal expansions.
  • In May 2025, DP World integrated a high-definition digital twin into its BoxBay high-bay storage system at the Jebel Ali Port in Dubai, allowing operators to manage automated container movements in a 3D environment.

Dive into Technavio’s robust research methodology, blending expert interviews, extensive data synthesis, and validated models for unparalleled Digital Twin In Logistics Market insights. See full methodology.

Market Scope
Page number 305
Base year 2025
Historic period 2020-2024
Forecast period 2026-2030
Growth momentum & CAGR Accelerate at a CAGR of 26.3%
Market growth 2026-2030 USD 4121.2 million
Market structure Fragmented
YoY growth 2025-2026(%) 24.4%
Key countries US, Canada, Mexico, China, Japan, India, South Korea, Australia, Indonesia, Germany, UK, France, Italy, Spain, The Netherlands, UAE, Saudi Arabia, South Africa, Turkey, Israel, Brazil, Argentina and Colombia
Competitive landscape Leading Companies, Market Positioning of Companies, Competitive Strategies, and Industry Risks

Request Free Sample

Research Analyst Overview

  • The digital twin in logistics market is undergoing a significant transformation, shifting from static high-fidelity modeling to dynamic, intelligent orchestration. The core of this evolution lies in real-time data synchronization and the integration of prescriptive analytics, enabling systems to not only mirror but actively direct physical operations.
  • This is driven by advanced IoT sensor integration and sophisticated predictive simulation, which together provide unprecedented supply chain visibility. Boardroom decisions are now centered on leveraging these capabilities for strategic advantage, particularly in allocating capital for warehouse automation and fleet management optimization. This physical AI integration allows for comprehensive asset lifecycle management and proactive risk mitigation simulation.
  • The implementation of agentic AI orchestration and autonomous logistics concepts, supported by geospatial logistics and collaborative data ecosystems, is becoming a key differentiator.
  • This technological convergence allows for more effective transportation network optimization and port operations management, with firms achieving up to a 40% reduction in simulation setup time, accelerating the path to enhanced supply chain resilience and superior operational efficiency metrics.

What are the Key Data Covered in this Digital Twin In Logistics Market Research and Growth Report?

  • What is the expected growth of the Digital Twin In Logistics Market between 2026 and 2030?

    • USD 4.12 billion, at a CAGR of 26.3%

  • What segmentation does the market report cover?

    • The report is segmented by Component (Software, Services, and Platform solutions), Deployment (Cloud-based, and On-premises), Application (Warehouse optimization, Predictive maintenance, Supply chain planning, and Fleet management) and Geography (North America, APAC, Europe, Middle East and Africa, South America)

  • Which regions are analyzed in the report?

    • North America, APAC, Europe, Middle East and Africa and South America

  • What are the key growth drivers and market challenges?

    • Raising demand for real time visibility and operational transparency, Technological complexities of data integration and interoperability

  • Who are the major players in the Digital Twin In Logistics Market?

    • Amazon Web Services Inc., Bentley Systems Inc., Blue Yonder Group Inc., Dassault Systemes SE, General Electric Co., Google LLC, Hexagon AB, IBM Corp., Kinaxis Inc., Manhattan Associates Inc., Microsoft Corp., NVIDIA Corp., Oracle Corp., Palantir Technologies Inc., PTC Inc., Robert Bosch GmbH, Rockwell Automation Inc., SAP SE, Siemens AG and Unity Technologies Inc.

Market Research Insights

  • The market is characterized by a strategic shift toward intelligent and interconnected virtual ecosystems. Advanced logistics simulation software now enables organizations to improve on-time delivery rates by over 20% compared to legacy systems. The adoption of a supply chain control tower, powered by a logistics network digital model, provides a unified view that improves decision-making latency by up to 40%.
  • Firms utilizing a digital twin for supply chain analytics are achieving a more granular understanding of operational bottlenecks. The integration of IoT in warehouse management provides the real-time data needed for these systems.
  • This evolution toward AI-driven logistics planning is creating a more agile and responsive operational landscape, where virtual warehouse design and optimization can be validated before capital is committed.

We can help! Our analysts can customize this digital twin in logistics market research report to meet your requirements.

Get in touch

1. Executive Summary

1.1 Market overview

Executive Summary - Chart on Market Overview
Executive Summary - Data Table on Market Overview
Executive Summary - Chart on Global Market Characteristics
Executive Summary - Chart on Market by Geography
Executive Summary - Chart on Market Segmentation by Component
Executive Summary - Chart on Market Segmentation by Deployment
Executive Summary - Chart on Market Segmentation by Application
Executive Summary - Chart on Incremental Growth
Executive Summary - Data Table on Incremental Growth
Executive Summary - Chart on Company Market Positioning

2. Technavio Analysis

2.1 Analysis of price sensitivity, lifecycle, customer purchase basket, adoption rates, and purchase criteria

2.2 Criticality of inputs and Factors of differentiation

Chart on Overview on criticality of inputs and factors of differentiation

2.3 Factors of disruption

Chart on Overview on factors of disruption

2.4 Impact of drivers and challenges

Chart on Impact of drivers and challenges in 2025 and 2030

3. Market Landscape

3.1 Market ecosystem

Chart on Parent Market
Data Table on - Parent Market

3.2 Market characteristics

Chart on Market characteristics analysis

3.3 Value chain analysis

Chart on Value chain analysis

4. Market Sizing

4.1 Market definition

Data Table on Offerings of companies included in the market definition

4.2 Market segment analysis

Market segments

4.3 Market size 2025

4.4 Market outlook: Forecast for 2025-2030

Chart on Global - Market size and forecast 2025-2030 ($ million)
Data Table on Global - Market size and forecast 2025-2030 ($ million)
Chart on Global Market: Year-over-year growth 2025-2030 (%)
Data Table on Global Market: Year-over-year growth 2025-2030 (%)

5. Historic Market Size

5.1 Global Digital Twin In Logistics Market 2020 - 2024

Historic Market Size - Data Table on Global Digital Twin In Logistics Market 2020 - 2024 ($ million)

5.2 Component segment analysis 2020 - 2024

Historic Market Size - Component Segment 2020 - 2024 ($ million)

5.3 Deployment segment analysis 2020 - 2024

Historic Market Size - Deployment Segment 2020 - 2024 ($ million)

5.4 Application segment analysis 2020 - 2024

Historic Market Size - Application Segment 2020 - 2024 ($ million)

5.5 Geography segment analysis 2020 - 2024

Historic Market Size - Geography Segment 2020 - 2024 ($ million)

5.6 Country segment analysis 2020 - 2024

Historic Market Size - Country Segment 2020 - 2024 ($ million)

6. Qualitative Analysis

6.1 Impact of AI on global digital twin in logistics market

6.2 Impact of geopolitical conflicts on global digital twin in logistics market

7. Five Forces Analysis

7.1 Five forces summary

Five forces analysis - Comparison between 2025 and 2030

7.2 Bargaining power of buyers

Bargaining power of buyers - Impact of key factors 2025 and 2030

7.3 Bargaining power of suppliers

Bargaining power of suppliers - Impact of key factors in 2025 and 2030

7.4 Threat of new entrants

Threat of new entrants - Impact of key factors in 2025 and 2030

7.5 Threat of substitutes

Threat of substitutes - Impact of key factors in 2025 and 2030

7.6 Threat of rivalry

Threat of rivalry - Impact of key factors in 2025 and 2030

7.7 Market condition

Chart on Market condition - Five forces 2025 and 2030

8. Market Segmentation by Component

8.1 Market segments

Chart on Component - Market share 2025-2030 (%)
Data Table on Component - Market share 2025-2030 (%)

8.2 Comparison by Component

Chart on Comparison by Component
Data Table on Comparison by Component

8.3 Software - Market size and forecast 2025-2030

Chart on Software - Market size and forecast 2025-2030 ($ million)
Data Table on Software - Market size and forecast 2025-2030 ($ million)
Chart on Software - Year-over-year growth 2025-2030 (%)
Data Table on Software - Year-over-year growth 2025-2030 (%)

8.4 Services - Market size and forecast 2025-2030

Chart on Services - Market size and forecast 2025-2030 ($ million)
Data Table on Services - Market size and forecast 2025-2030 ($ million)
Chart on Services - Year-over-year growth 2025-2030 (%)
Data Table on Services - Year-over-year growth 2025-2030 (%)

8.5 Platform solutions - Market size and forecast 2025-2030

Chart on Platform solutions - Market size and forecast 2025-2030 ($ million)
Data Table on Platform solutions - Market size and forecast 2025-2030 ($ million)
Chart on Platform solutions - Year-over-year growth 2025-2030 (%)
Data Table on Platform solutions - Year-over-year growth 2025-2030 (%)

8.6 Market opportunity by Component

Market opportunity by Component ($ million)
Data Table on Market opportunity by Component ($ million)

9. Market Segmentation by Deployment

9.1 Market segments

Chart on Deployment - Market share 2025-2030 (%)
Data Table on Deployment - Market share 2025-2030 (%)

9.2 Comparison by Deployment

Chart on Comparison by Deployment
Data Table on Comparison by Deployment

9.3 Cloud-based - Market size and forecast 2025-2030

Chart on Cloud-based - Market size and forecast 2025-2030 ($ million)
Data Table on Cloud-based - Market size and forecast 2025-2030 ($ million)
Chart on Cloud-based - Year-over-year growth 2025-2030 (%)
Data Table on Cloud-based - Year-over-year growth 2025-2030 (%)

9.4 On-premises - Market size and forecast 2025-2030

Chart on On-premises - Market size and forecast 2025-2030 ($ million)
Data Table on On-premises - Market size and forecast 2025-2030 ($ million)
Chart on On-premises - Year-over-year growth 2025-2030 (%)
Data Table on On-premises - Year-over-year growth 2025-2030 (%)

9.5 Market opportunity by Deployment

Market opportunity by Deployment ($ million)
Data Table on Market opportunity by Deployment ($ million)

10. Market Segmentation by Application

10.1 Market segments

Chart on Application - Market share 2025-2030 (%)
Data Table on Application - Market share 2025-2030 (%)

10.2 Comparison by Application

Chart on Comparison by Application
Data Table on Comparison by Application

10.3 Warehouse optimization - Market size and forecast 2025-2030

Chart on Warehouse optimization - Market size and forecast 2025-2030 ($ million)
Data Table on Warehouse optimization - Market size and forecast 2025-2030 ($ million)
Chart on Warehouse optimization - Year-over-year growth 2025-2030 (%)
Data Table on Warehouse optimization - Year-over-year growth 2025-2030 (%)

10.4 Predictive maintenance - Market size and forecast 2025-2030

Chart on Predictive maintenance - Market size and forecast 2025-2030 ($ million)
Data Table on Predictive maintenance - Market size and forecast 2025-2030 ($ million)
Chart on Predictive maintenance - Year-over-year growth 2025-2030 (%)
Data Table on Predictive maintenance - Year-over-year growth 2025-2030 (%)

10.5 Supply chain planning - Market size and forecast 2025-2030

Chart on Supply chain planning - Market size and forecast 2025-2030 ($ million)
Data Table on Supply chain planning - Market size and forecast 2025-2030 ($ million)
Chart on Supply chain planning - Year-over-year growth 2025-2030 (%)
Data Table on Supply chain planning - Year-over-year growth 2025-2030 (%)

10.6 Fleet management - Market size and forecast 2025-2030

Chart on Fleet management - Market size and forecast 2025-2030 ($ million)
Data Table on Fleet management - Market size and forecast 2025-2030 ($ million)
Chart on Fleet management - Year-over-year growth 2025-2030 (%)
Data Table on Fleet management - Year-over-year growth 2025-2030 (%)

10.7 Market opportunity by Application

Market opportunity by Application ($ million)
Data Table on Market opportunity by Application ($ million)

11. Customer Landscape

11.1 Customer landscape overview

Analysis of price sensitivity, lifecycle, customer purchase basket, adoption rates, and purchase criteria

12. Geographic Landscape

12.1 Geographic segmentation

Chart on Market share by geography 2025-2030 (%)
Data Table on Market share by geography 2025-2030 (%)

12.2 Geographic comparison

Chart on Geographic comparison
Data Table on Geographic comparison

12.3 North America - Market size and forecast 2025-2030

Chart on North America - Market size and forecast 2025-2030 ($ million)
Data Table on North America - Market size and forecast 2025-2030 ($ million)
Chart on North America - Year-over-year growth 2025-2030 (%)
Data Table on North America - Year-over-year growth 2025-2030 (%)
Chart on Regional Comparison - North America
Data Table on Regional Comparison - North America

12.3.1 US - Market size and forecast 2025-2030

Chart on US - Market size and forecast 2025-2030 ($ million)
Data Table on US - Market size and forecast 2025-2030 ($ million)
Chart on US - Year-over-year growth 2025-2030 (%)
Data Table on US - Year-over-year growth 2025-2030 (%)

12.3.2 Canada - Market size and forecast 2025-2030

Chart on Canada - Market size and forecast 2025-2030 ($ million)
Data Table on Canada - Market size and forecast 2025-2030 ($ million)
Chart on Canada - Year-over-year growth 2025-2030 (%)
Data Table on Canada - Year-over-year growth 2025-2030 (%)

12.3.3 Mexico - Market size and forecast 2025-2030

Chart on Mexico - Market size and forecast 2025-2030 ($ million)
Data Table on Mexico - Market size and forecast 2025-2030 ($ million)
Chart on Mexico - Year-over-year growth 2025-2030 (%)
Data Table on Mexico - Year-over-year growth 2025-2030 (%)

12.4 APAC - Market size and forecast 2025-2030

Chart on APAC - Market size and forecast 2025-2030 ($ million)
Data Table on APAC - Market size and forecast 2025-2030 ($ million)
Chart on APAC - Year-over-year growth 2025-2030 (%)
Data Table on APAC - Year-over-year growth 2025-2030 (%)
Chart on Regional Comparison - APAC
Data Table on Regional Comparison - APAC

12.4.1 China - Market size and forecast 2025-2030

Chart on China - Market size and forecast 2025-2030 ($ million)
Data Table on China - Market size and forecast 2025-2030 ($ million)
Chart on China - Year-over-year growth 2025-2030 (%)
Data Table on China - Year-over-year growth 2025-2030 (%)

12.4.2 Japan - Market size and forecast 2025-2030

Chart on Japan - Market size and forecast 2025-2030 ($ million)
Data Table on Japan - Market size and forecast 2025-2030 ($ million)
Chart on Japan - Year-over-year growth 2025-2030 (%)
Data Table on Japan - Year-over-year growth 2025-2030 (%)

12.4.3 India - Market size and forecast 2025-2030

Chart on India - Market size and forecast 2025-2030 ($ million)
Data Table on India - Market size and forecast 2025-2030 ($ million)
Chart on India - Year-over-year growth 2025-2030 (%)
Data Table on India - Year-over-year growth 2025-2030 (%)

12.4.4 South Korea - Market size and forecast 2025-2030

Chart on South Korea - Market size and forecast 2025-2030 ($ million)
Data Table on South Korea - Market size and forecast 2025-2030 ($ million)
Chart on South Korea - Year-over-year growth 2025-2030 (%)
Data Table on South Korea - Year-over-year growth 2025-2030 (%)

12.4.5 Australia - Market size and forecast 2025-2030

Chart on Australia - Market size and forecast 2025-2030 ($ million)
Data Table on Australia - Market size and forecast 2025-2030 ($ million)
Chart on Australia - Year-over-year growth 2025-2030 (%)
Data Table on Australia - Year-over-year growth 2025-2030 (%)

12.4.6 Indonesia - Market size and forecast 2025-2030

Chart on Indonesia - Market size and forecast 2025-2030 ($ million)
Data Table on Indonesia - Market size and forecast 2025-2030 ($ million)
Chart on Indonesia - Year-over-year growth 2025-2030 (%)
Data Table on Indonesia - Year-over-year growth 2025-2030 (%)

12.5 Europe - Market size and forecast 2025-2030

Chart on Europe - Market size and forecast 2025-2030 ($ million)
Data Table on Europe - Market size and forecast 2025-2030 ($ million)
Chart on Europe - Year-over-year growth 2025-2030 (%)
Data Table on Europe - Year-over-year growth 2025-2030 (%)
Chart on Regional Comparison - Europe
Data Table on Regional Comparison - Europe

12.5.1 Germany - Market size and forecast 2025-2030

Chart on Germany - Market size and forecast 2025-2030 ($ million)
Data Table on Germany - Market size and forecast 2025-2030 ($ million)
Chart on Germany - Year-over-year growth 2025-2030 (%)
Data Table on Germany - Year-over-year growth 2025-2030 (%)

12.5.2 UK - Market size and forecast 2025-2030

Chart on UK - Market size and forecast 2025-2030 ($ million)
Data Table on UK - Market size and forecast 2025-2030 ($ million)
Chart on UK - Year-over-year growth 2025-2030 (%)
Data Table on UK - Year-over-year growth 2025-2030 (%)

12.5.3 France - Market size and forecast 2025-2030

Chart on France - Market size and forecast 2025-2030 ($ million)
Data Table on France - Market size and forecast 2025-2030 ($ million)
Chart on France - Year-over-year growth 2025-2030 (%)
Data Table on France - Year-over-year growth 2025-2030 (%)

12.5.4 Italy - Market size and forecast 2025-2030

Chart on Italy - Market size and forecast 2025-2030 ($ million)
Data Table on Italy - Market size and forecast 2025-2030 ($ million)
Chart on Italy - Year-over-year growth 2025-2030 (%)
Data Table on Italy - Year-over-year growth 2025-2030 (%)

12.5.5 Spain - Market size and forecast 2025-2030

Chart on Spain - Market size and forecast 2025-2030 ($ million)
Data Table on Spain - Market size and forecast 2025-2030 ($ million)
Chart on Spain - Year-over-year growth 2025-2030 (%)
Data Table on Spain - Year-over-year growth 2025-2030 (%)

12.5.6 The Netherlands - Market size and forecast 2025-2030

Chart on The Netherlands - Market size and forecast 2025-2030 ($ million)
Data Table on The Netherlands - Market size and forecast 2025-2030 ($ million)
Chart on The Netherlands - Year-over-year growth 2025-2030 (%)
Data Table on The Netherlands - Year-over-year growth 2025-2030 (%)

12.6 Middle East and Africa - Market size and forecast 2025-2030

Chart on Middle East and Africa - Market size and forecast 2025-2030 ($ million)
Data Table on Middle East and Africa - Market size and forecast 2025-2030 ($ million)
Chart on Middle East and Africa - Year-over-year growth 2025-2030 (%)
Data Table on Middle East and Africa - Year-over-year growth 2025-2030 (%)
Chart on Regional Comparison - Middle East and Africa
Data Table on Regional Comparison - Middle East and Africa

12.6.1 UAE - Market size and forecast 2025-2030

Chart on UAE - Market size and forecast 2025-2030 ($ million)
Data Table on UAE - Market size and forecast 2025-2030 ($ million)
Chart on UAE - Year-over-year growth 2025-2030 (%)
Data Table on UAE - Year-over-year growth 2025-2030 (%)

12.6.2 Saudi Arabia - Market size and forecast 2025-2030

Chart on Saudi Arabia - Market size and forecast 2025-2030 ($ million)
Data Table on Saudi Arabia - Market size and forecast 2025-2030 ($ million)
Chart on Saudi Arabia - Year-over-year growth 2025-2030 (%)
Data Table on Saudi Arabia - Year-over-year growth 2025-2030 (%)

12.6.3 South Africa - Market size and forecast 2025-2030

Chart on South Africa - Market size and forecast 2025-2030 ($ million)
Data Table on South Africa - Market size and forecast 2025-2030 ($ million)
Chart on South Africa - Year-over-year growth 2025-2030 (%)
Data Table on South Africa - Year-over-year growth 2025-2030 (%)

12.6.4 Turkey - Market size and forecast 2025-2030

Chart on Turkey - Market size and forecast 2025-2030 ($ million)
Data Table on Turkey - Market size and forecast 2025-2030 ($ million)
Chart on Turkey - Year-over-year growth 2025-2030 (%)
Data Table on Turkey - Year-over-year growth 2025-2030 (%)

12.6.5 Israel - Market size and forecast 2025-2030

Chart on Israel - Market size and forecast 2025-2030 ($ million)
Data Table on Israel - Market size and forecast 2025-2030 ($ million)
Chart on Israel - Year-over-year growth 2025-2030 (%)
Data Table on Israel - Year-over-year growth 2025-2030 (%)

12.7 South America - Market size and forecast 2025-2030

Chart on South America - Market size and forecast 2025-2030 ($ million)
Data Table on South America - Market size and forecast 2025-2030 ($ million)
Chart on South America - Year-over-year growth 2025-2030 (%)
Data Table on South America - Year-over-year growth 2025-2030 (%)
Chart on Regional Comparison - South America
Data Table on Regional Comparison - South America

12.7.1 Brazil - Market size and forecast 2025-2030

Chart on Brazil - Market size and forecast 2025-2030 ($ million)
Data Table on Brazil - Market size and forecast 2025-2030 ($ million)
Chart on Brazil - Year-over-year growth 2025-2030 (%)
Data Table on Brazil - Year-over-year growth 2025-2030 (%)

12.7.2 Argentina - Market size and forecast 2025-2030

Chart on Argentina - Market size and forecast 2025-2030 ($ million)
Data Table on Argentina - Market size and forecast 2025-2030 ($ million)
Chart on Argentina - Year-over-year growth 2025-2030 (%)
Data Table on Argentina - Year-over-year growth 2025-2030 (%)

12.7.3 Colombia - Market size and forecast 2025-2030

Chart on Colombia - Market size and forecast 2025-2030 ($ million)
Data Table on Colombia - Market size and forecast 2025-2030 ($ million)
Chart on Colombia - Year-over-year growth 2025-2030 (%)
Data Table on Colombia - Year-over-year growth 2025-2030 (%)

12.8 Market opportunity by geography

Market opportunity by geography ($ million)
Data Tables on Market opportunity by geography ($ million)

13. Drivers, Challenges, and Opportunity

13.1 Market drivers

Raising demand for real time visibility and operational transparency
Rapid advancements in internet of things and connectivity infrastructure
Strategic corporate commitment to sustainability and carbon neutrality

13.2 Market challenges

Technological complexities of data integration and interoperability
Financial barriers and complexity of return on investment justification
Cybersecurity vulnerabilities and expansion of digital attack surface

13.3 Impact of drivers and challenges

Impact of drivers and challenges in 2025 and 2030

13.4 Market opportunities

Integration of generative artificial intelligence and predictive simulation
Emergence of logistics metaverse and high fidelity spatial visualization
Shift toward collaborative data ecosystems and twin of twins concept

14. Competitive Landscape

14.1 Overview

14.2

Overview on criticality of inputs and factors of differentiation

14.3 Landscape disruption

Overview on factors of disruption

14.4 Industry risks

Impact of key risks on business

15. Competitive Analysis

15.1 Companies profiled

Companies covered

15.2 Company ranking index

15.3 Market positioning of companies

Matrix on companies position and classification

15.4 Amazon Web Services Inc.

Amazon Web Services Inc. - Overview
Amazon Web Services Inc. - Product / Service
Amazon Web Services Inc. - Key offerings
SWOT

15.5 Bentley Systems Inc.

Bentley Systems Inc. - Overview
Bentley Systems Inc. - Business segments
Bentley Systems Inc. - Key offerings
Bentley Systems Inc. - Segment focus
SWOT

15.6 Dassault Systemes SE

Dassault Systemes SE - Overview
Dassault Systemes SE - Business segments
Dassault Systemes SE - Key offerings
Dassault Systemes SE - Segment focus
SWOT

15.7 General Electric Co.

General Electric Co. - Overview
General Electric Co. - Business segments
General Electric Co. - Key offerings
General Electric Co. - Segment focus
SWOT

15.8 Hexagon AB

Hexagon AB - Overview
Hexagon AB - Business segments
Hexagon AB - Key news
Hexagon AB - Key offerings
Hexagon AB - Segment focus
SWOT

15.9 IBM Corp.

IBM Corp. - Overview
IBM Corp. - Business segments
IBM Corp. - Key news
IBM Corp. - Key offerings
IBM Corp. - Segment focus
SWOT

15.10 Manhattan Associates Inc.

Manhattan Associates Inc. - Overview
Manhattan Associates Inc. - Business segments
Manhattan Associates Inc. - Key offerings
Manhattan Associates Inc. - Segment focus
SWOT

15.11 Microsoft Corp.

Microsoft Corp. - Overview
Microsoft Corp. - Business segments
Microsoft Corp. - Key news
Microsoft Corp. - Key offerings
Microsoft Corp. - Segment focus
SWOT

15.12 NVIDIA Corp.

NVIDIA Corp. - Overview
NVIDIA Corp. - Business segments
NVIDIA Corp. - Key news
NVIDIA Corp. - Key offerings
NVIDIA Corp. - Segment focus
SWOT

15.13 Oracle Corp.

Oracle Corp. - Overview
Oracle Corp. - Business segments
Oracle Corp. - Key news
Oracle Corp. - Key offerings
Oracle Corp. - Segment focus
SWOT

15.14 Palantir Technologies Inc.

Palantir Technologies Inc. - Overview
Palantir Technologies Inc. - Business segments
Palantir Technologies Inc. - Key offerings
Palantir Technologies Inc. - Segment focus
SWOT

15.15 PTC Inc.

PTC Inc. - Overview
PTC Inc. - Business segments
PTC Inc. - Key offerings
PTC Inc. - Segment focus
SWOT

15.16 Robert Bosch GmbH

Robert Bosch GmbH - Overview
Robert Bosch GmbH - Product / Service
Robert Bosch GmbH - Key offerings
SWOT

15.17 SAP SE

SAP SE - Overview
SAP SE - Business segments
SAP SE - Key news
SAP SE - Key offerings
SAP SE - Segment focus
SWOT

15.18 Siemens AG

Siemens AG - Overview
Siemens AG - Business segments
Siemens AG - Key news
Siemens AG - Key offerings
Siemens AG - Segment focus
SWOT

16. Appendix

16.1 Scope of the report

Market definition
Objectives
Notes and caveats

16.2 Inclusions and exclusions checklist

Inclusions checklist
Exclusions checklist

16.3 Currency conversion rates for US$

16.4 Research methodology

16.5 Data procurement

Information sources

16.6 Data validation

16.7 Validation techniques employed for market sizing

16.8 Data synthesis

16.9 360 degree market analysis

16.10 List of abbreviations

Research Methodology

Technavio presents a detailed picture of the market by way of study, synthesis, and summation of data from multiple sources. The analysts have presented the various facets of the market with a particular focus on identifying the key industry influencers. The data thus presented is comprehensive, reliable, and the result of extensive research, both primary and secondary.

INFORMATION SOURCES

Primary sources

  • Manufacturers and suppliers
  • Channel partners
  • Industry experts
  • Strategic decision makers

Secondary sources

  • Industry journals and periodicals
  • Government data
  • Financial reports of key industry players
  • Historical data
  • Press releases

DATA ANALYSIS

Data Synthesis

  • Collation of data
  • Estimation of key figures
  • Analysis of derived insights

Data Validation

  • Triangulation with data models
  • Reference against proprietary databases
  • Corroboration with industry experts

REPORT WRITING

Qualitative

  • Market drivers
  • Market challenges
  • Market trends
  • Five forces analysis

Quantitative

  • Market size and forecast
  • Market segmentation
  • Geographical insights
  • Competitive landscape

Interested in this report?

Get your sample now to see our research methodology and insights!

Download Now

Frequently Asked Questions

Digital Twin In Logistics market growth will increase by USD 4121.2 million during 2026-2030.

The Digital Twin In Logistics market is expected to grow at a CAGR of 26.3% during 2026-2030.

Digital Twin In Logistics market is segmented by Component (Software, Services, Platform solutions) Deployment (Cloud-based, On-premises) Application (Warehouse optimization, Predictive maintenance, Supply chain planning, Fleet management)

Amazon Web Services Inc., Bentley Systems Inc., Blue Yonder Group Inc., Dassault Systemes SE, General Electric Co., Google LLC, Hexagon AB, IBM Corp., Kinaxis Inc., Manhattan Associates Inc., Microsoft Corp., NVIDIA Corp., Oracle Corp., Palantir Technologies Inc., PTC Inc., Robert Bosch GmbH, Rockwell Automation Inc., SAP SE, Siemens AG, Unity Technologies Inc. are a few of the key vendors in the Digital Twin In Logistics market.

North America will register the highest growth rate of 32.8% among the other regions. Therefore, the Digital Twin In Logistics market in North America is expected to garner significant business opportunities for the vendors during the forecast period.

US, Canada, Mexico, China, Japan, India, South Korea, Australia, Indonesia, Germany, UK, France, Italy, Spain, The Netherlands, UAE, Saudi Arabia, South Africa, Turkey, Israel, Brazil, Argentina, Colombia

  • Raising demand for real time visibility and operational transparency is the driving factor this market.

The Digital Twin In Logistics market vendors should focus on grabbing business opportunities from the Component segment as it accounted for the largest market share in the base year.
RIA - Research AI Assistant
Ask RIA