Display For Retail Applications Market Size 2024-2028
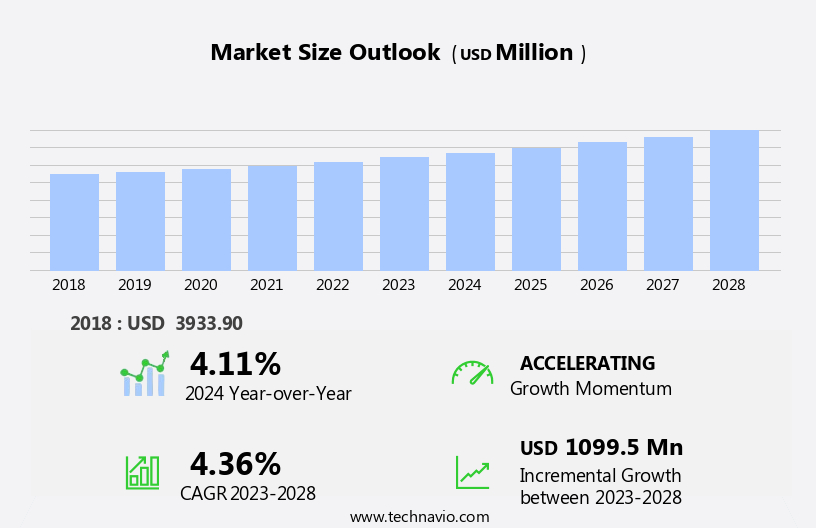
The display for retail applications market size is forecast to increase by USD 1.1 billion at a CAGR of 4.36% between 2023 and 2028.
What will be the Size of the Display For Retail Applications Market During the Forecast Period?
How is this Display For Retail Applications Industry segmented and which is the largest segment?
The display for retail applications industry research report provides comprehensive data (region-wise segment analysis), with forecasts and estimates in "USD million" for the period 2024-2028, as well as historical data from 2018-2022 for the following segments.
- Type
- Touchscreen display
- Non-touchscreen display
- Application
- Apparel and footwear
- Departmental stores
- Jewelry and watches
- Bags and luggage
- Others
- Geography
- APAC
- China
- India
- Japan
- North America
- US
- Europe
- Germany
- South America
- Middle East and Africa
- APAC
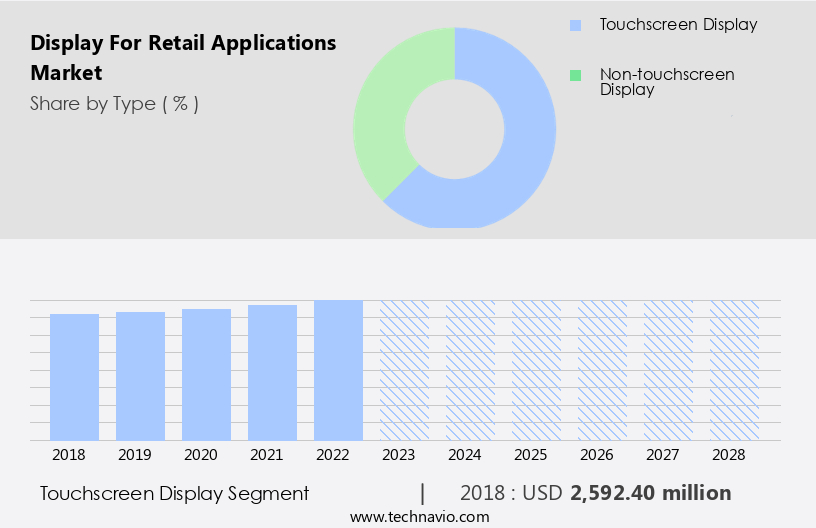
By Type Insights
The touchscreen display segment is estimated to witness significant growth during the forecast period. Touch-screen retail displays have become a significant component of modern retail environments, enhancing the shopping experience through interactive digital signage and point-of-sale systems. These displays employ various touchscreen technologies, such as resistive, capacitive, infrared, acoustic, and optical, each with unique advantages. Resistive touchscreens, for instance, offer handwriting recognition and functionality in colder climates, making them suitable for various retail applications, including department stores, apparel stores, footwear specialty stores, jewelry stores, watch specialty stores, independent small grocers, and more. Capacitive touchscreens, popular at the point of sale, provide a responsive and intuitive user interface. Retail displays, merchandise, and product merchandising benefit from these advanced technologies, creating an engaging and informative retail environment.
Additionally, sustainable displays made of environmentally friendly materials are gaining popularity, aligning with the industry's shift towards eco-conscious practices.
Get a glance at the market report of various segments Request Free Sample
The Touchscreen display segment was valued at USD 2.59 billion in 2018 and showed a gradual increase during the forecast period.
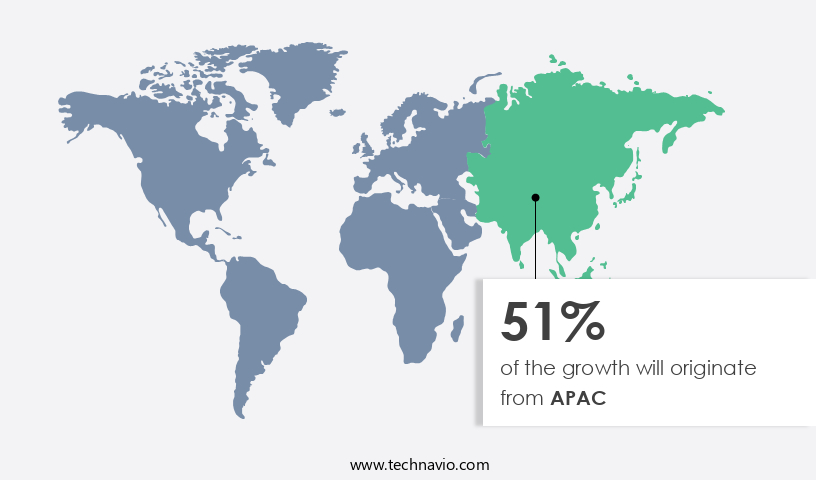
Regional Analysis
APAC is estimated to contribute 51% to the growth of the global market during the forecast period. Technavio’s analysts have elaborately explained the regional trends and drivers that shape the market during the forecast period.
For more insights on the market size of various regions, Request Free Sample
The retail displays market is experiencing significant growth due to the expansion of retail stores, particularly in countries like China and India, where the retail sector is thriving. The food and beverage and automotive industries are major contributors to the Chinese economy, leading to an increase in retail establishments and subsequent demand for high-quality retail displays. Both large multinational corporations and independent retailers are investing in durable and visually appealing displays to showcase their merchandise. This includes touch-screen and non-touch-screen displays, digital signage, augmented reality, and sustainable options made from eco-friendly materials. In the US, retail environments continue to evolve with interactive displays, product merchandising, and improved shopping experiences.
POS systems, ATMs, and various retail stores are incorporating these technologies to enhance the customer experience. Key players In the retail displays market include companies of touch-enabled and non-touch displays, POS systems, and sustainable display solutions.
Market Dynamics
Our researchers analyzed the data with 2023 as the base year, along with the key drivers, trends, and challenges. A holistic analysis of drivers will help companies refine their marketing strategies to gain a competitive advantage.
What are the key market drivers leading to the rise In the adoption of Display For Retail Applications Industry?
- Advantages over traditional advertisement methods is the key driver of the market.Retail displays, encompassing both touch-screen and non-touch-screen options, are revolutionizing the retail environment by offering dynamic, interactive experiences for consumers. Departmental stores, apparel stores, footwear specialty stores, jewelry stores, watch specialty stores, independent small grocers, and various retail sectors are adopting these advanced displays to enhance merchandise presentation and shopping experience. Digital signage and touch-enabled displays provide opportunities for real-time product merchandising, augmented reality, and e-commerce integration. Sustainable and environmentally friendly materials are also being used to create visually appealing and eco-friendly displays. In-store displays and window displays are becoming more interactive and engaging, attracting customers and increasing sales.
The advantages of retail displays over traditional print media are numerous. They eliminate paper waste, reduce the need for frequent updates, and offer more customizable and dynamic content. Moreover, they can be integrated with POS systems, ATMs, and other retail technologies to streamline operations and provide a seamless shopping experience. In conclusion, the adoption of retail displays is expected to continue growing due to their numerous benefits, including environmental sustainability, customizable content, and operational efficiency. These displays are transforming the retail landscape by offering interactive, engaging, and eco-friendly solutions for product merchandising and customer engagement.
What are the market trends shaping the Display For Retail Applications market?
- Emergence of new display technologies is the upcoming market trend.The retail display market is experiencing innovation through the integration of advanced technologies such as touch-screen and non-touch-screen displays. Touch-screen retail displays offer interactive experiences for consumers, enhancing the shopping experience. Non-touch-screen displays, including laser phosphor display (LPD) and narrow pixel pitch (NPP) LED displays, provide high-quality visuals and are increasingly popular. LPD displays, developed by Prysm in 2010, use a plastic and glass hybrid material and colored phosphor stripes, enabling large video walls. NPP LED displays offer slim designs and high resolution, making them suitable for window and in-store displays. Additionally, sustainable displays using environmentally friendly materials and digital signage with augmented reality are gaining traction.
Retailers in various sectors, such as departmental stores, apparel stores, footwear specialty stores, jewelry stores, watch specialty stores, independent small grocers, and retail stores, are adopting these technologies to optimize product merchandising and create engaging retail environments. POS Systems, ATMs, and e-commerce platforms are also integrating these displays for seamless transactions and enhanced customer experiences.
What challenges does the Display For Retail Applications Industry face during its growth?
- Development of new content is a key challenge affecting the industry growth.In the dynamic retail landscape, touch-screen and non-touch-screen digital displays play a pivotal role in engaging customers and enhancing the shopping experience. Department stores, apparel stores, footwear specialty stores, jewelry stores, watch specialty stores, independent small grocers, and various retail sectors employ retail displays to showcase merchandise effectively. These displays come in various forms, including window displays, in-store displays, and interactive digital signage. Retailers invest in digital displays to offer customers an immersive shopping experience. Interactive touch-screen displays allow customers to explore products in detail, while digital signage delivers targeted messages and promotions. Augmented reality technology further enhances the shopping experience by overlaying digital information on the physical world.
However, updating the content on these displays regularly is crucial to maintain customer interest. Retailers need to allocate resources for creating new content and managing digital displays. POS Systems, ATMs, and other retail technology solutions can integrate with digital displays to provide a seamless shopping experience. Sustainable displays made from environmentally friendly materials are also gaining popularity due to their eco-friendly nature. In conclusion, digital displays offer numerous benefits to retailers, from product merchandising to creating a memorable shopping experience. However, the costs associated with content development and maintenance are essential considerations. Retailers must weigh the benefits against the costs to determine the optimal use of digital displays In their retail environment.
Exclusive Customer Landscape
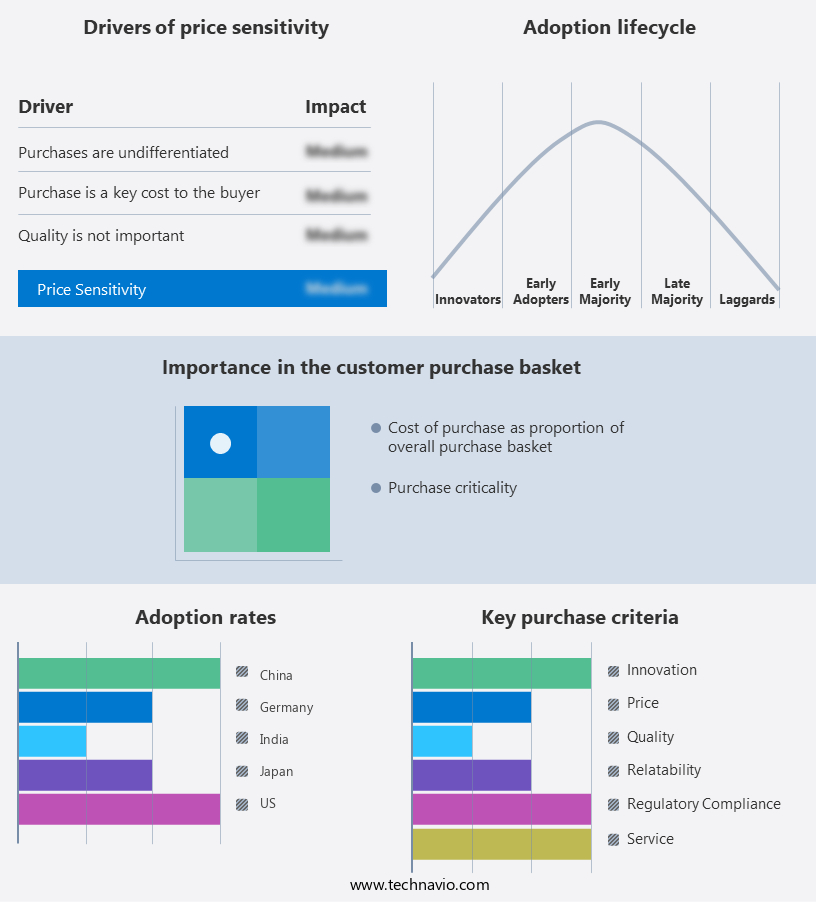
The display for retail applications market forecasting report includes the adoption lifecycle of the market, covering from the innovator’s stage to the laggard’s stage. It focuses on adoption rates in different regions based on penetration. Furthermore, the display for retail applications market report also includes key purchase criteria and drivers of price sensitivity to help companies evaluate and develop their market growth analysis strategies.
Customer Landscape
Key Companies & Market Insights
Companies are implementing various strategies, such as strategic alliances, display for retail applications market forecast, partnerships, mergers and acquisitions, geographical expansion, and product/service launches, to enhance their presence In the industry.
AUO Corp. - The company specializes in providing advanced display solutions for retail applications. Their offerings encompass commercial LCD displays, customizable to various sizes and specifications for indoor and outdoor use. Additionally, they provide giant outdoor LED billboards, ensuring optimal visual experience for diverse application scenarios.
The industry research and growth report includes detailed analyses of the competitive landscape of the market and information about key companies, including:
- AUO Corp.
- Corning Inc.
- Crystal Display Systems Ltd.
- Daktronics Inc.
- Elo Touch Solutions Inc.
- Furukawa Electric Co. Ltd.
- Hon Hai Precision Industry Co. Ltd.
- Kent Displays Inc.
- Koninklijke Philips N.V.
- Leyard Group
- LG Electronics Inc.
- Mitsubishi Electric Corp.
- NEC Corp.
- Panasonic Holdings Corp.
- Samsung Electronics Co. Ltd.
- Seiko Epson Corp.
- Sony Group Corp.
- Toshiba Corp.
- ViewSonic Corp.
- YFY Inc.
Qualitative and quantitative analysis of companies has been conducted to help clients understand the wider business environment as well as the strengths and weaknesses of key industry players. Data is qualitatively analyzed to categorize companies as pure play, category-focused, industry-focused, and diversified; it is quantitatively analyzed to categorize companies as dominant, leading, strong, tentative, and weak.
Research Analyst Overview
Retail displays continue to evolve, offering merchants innovative ways to showcase their merchandise and enhance the shopping experience for consumers. Two primary types of retail displays dominate the market: touch-screen and non-touch-screen. Both options provide unique advantages, catering to various retail environments. Touch-screen retail displays have gained popularity due to their interactive nature. These displays allow consumers to engage with merchandise in a more immersive way, enabling them to explore product features, customize options, and make purchases directly on the screen. This technology is particularly effective in departmental stores, apparel stores, footwear specialty stores, jewelry stores, and watch specialty stores.
Interactive displays can also be found in electronics retailers, where customers can test out gadgets before buying. On the other hand, non-touch-screen retail displays are a more traditional option. They are widely used in various retail settings, including independent small grocers. These displays are often used for product merchandising, visual merchandising, and window displays. Non-touch displays can be static or digital, featuring digital signage, augmented reality, or e-commerce integration. Retailers must consider the retail environment when choosing between touch-screen and non-touch-screen displays. Touch-screen displays are ideal for showcasing high-end merchandise and offering customization options. They can also be used to provide product information, process transactions, and offer interactive experiences.
Non-touch-screen displays, on the other hand, are suitable for showcasing a large assortment of merchandise and creating eye-catching window displays. Retailers are increasingly focusing on sustainable displays and environmentally friendly materials. Sustainable displays not only reduce waste but also appeal to eco-conscious consumers. These displays can be made from recycled materials, use energy-efficient lighting, and feature long-lasting components. Store design plays a crucial role In the success of retail displays. Effective use of space, product placement, and visual merchandising can significantly impact sales. Retailers must also consider the role of technology In their store design, such as touch-enabled displays, POS systems, and ATMs.
In conclusion, retail displays continue to evolve, offering merchants innovative ways to showcase their merchandise and enhance the shopping experience for consumers. Touch-screen and non-touch-screen displays each offer unique advantages, and retailers must consider the retail environment, product offerings, and consumer preferences when choosing between the two. Additionally, sustainability and technology integration are becoming essential components of effective retail displays.
|
Market Scope |
|
|
Report Coverage |
Details |
|
Page number |
187 |
|
Base year |
2023 |
|
Historic period |
2018-2022 |
|
Forecast period |
2024-2028 |
|
Growth momentum & CAGR |
Accelerate at a CAGR of 4.36% |
|
Market growth 2024-2028 |
USD 1099.5 million |
|
Market structure |
Fragmented |
|
YoY growth 2023-2024(%) |
4.11 |
|
Key countries |
US, China, Japan, India, and Germany |
|
Competitive landscape |
Leading Companies, Market Positioning of Companies, Competitive Strategies, and Industry Risks |
What are the Key Data Covered in this Display For Retail Applications Market Research and Growth Report?
- CAGR of the Display For Retail Applications industry during the forecast period
- Detailed information on factors that will drive the growth and forecasting between 2024 and 2028
- Precise estimation of the size of the market and its contribution of the industry in focus to the parent market
- Accurate predictions about upcoming growth and trends and changes in consumer behaviour
- Growth of the market across APAC, North America, Europe, South America, and Middle East and Africa
- Thorough analysis of the market’s competitive landscape and detailed information about companies
- Comprehensive analysis of factors that will challenge the display for retail applications market growth of industry companies
We can help! Our analysts can customize this display for retail applications market research report to meet your requirements.
 RIA -
RIA - 
