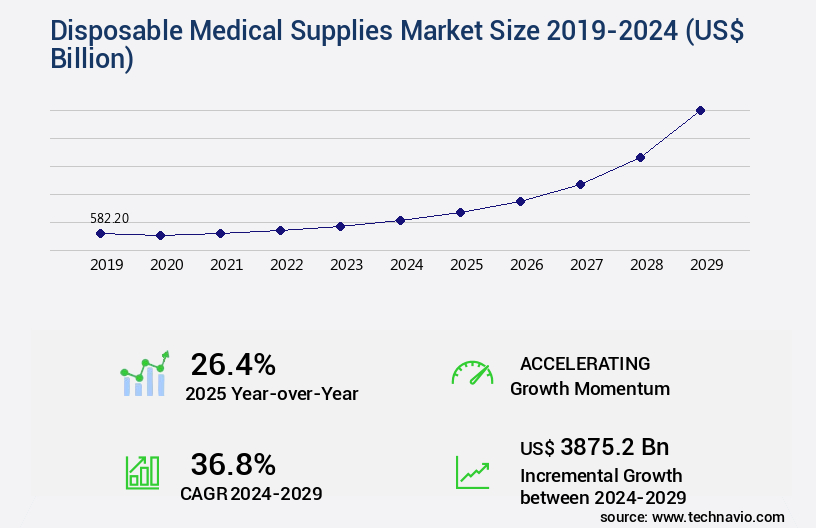
Disposable Medical Supplies Market Size 2025-2029
The disposable medical supplies market size is forecast to increase by USD 3875.2 billion, at a CAGR of 36.8% between 2024 and 2029.
Major Market Trends & Insights
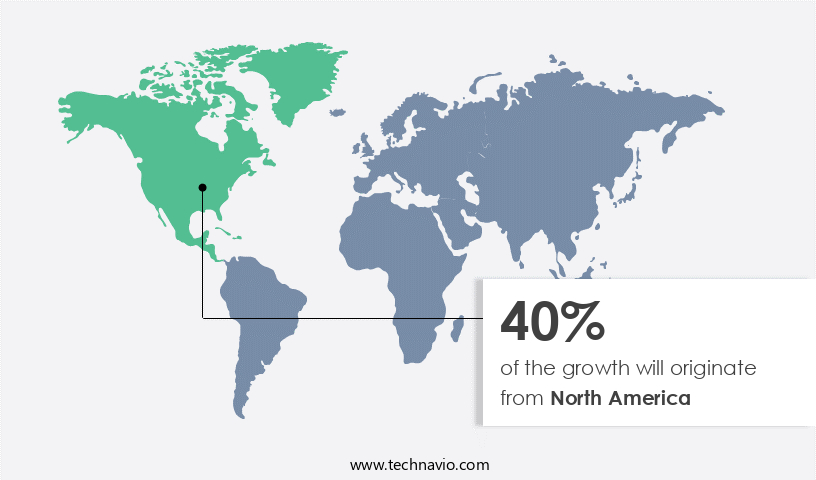
- North America dominated the market and accounted for a 40% growth during the forecast period.
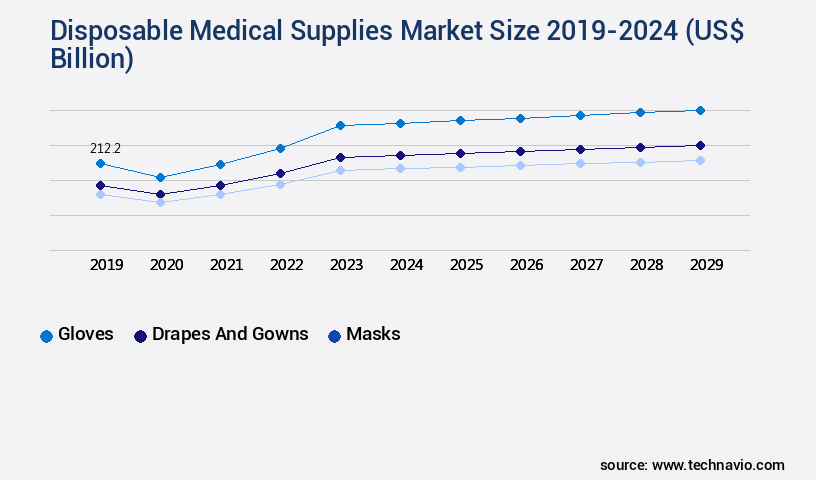
- By the Type - Gloves segment was valued at USD 212.20 billion in 2023
- By the End-user - Hospitals and clinics segment accounted for the largest market revenue share in 2023
Market Size & Forecast
- Market Opportunities: USD 741.55 billion
- Market Future Opportunities: USD 3875.20 billion
- CAGR : 36.8%
- North America: Largest market in 2023
Market Summary
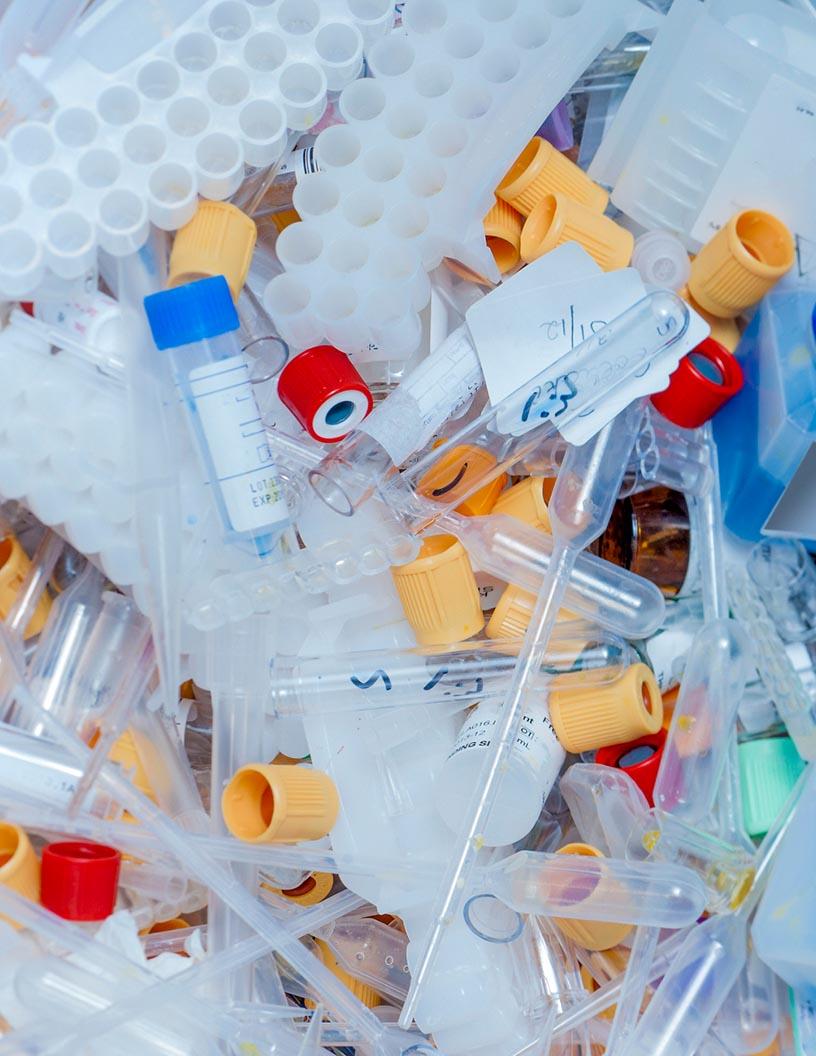
- The market is experiencing significant growth due to the increasing demand for these supplies in healthcare settings. The need for disposable medical supplies is driven by the desire to maintain infection control and prevent the spread of diseases. Technological advances are also playing a crucial role in enhancing the quality of disposable medical supplies, offering improved patient safety and outcomes. However, environmental concerns associated with the improper disposal of these supplies pose a significant challenge. As waste management becomes a growing concern, companies must find innovative solutions to ensure the responsible disposal of disposable medical supplies.
- To capitalize on market opportunities and navigate challenges effectively, companies should focus on developing sustainable disposal methods and investing in research and development to create high-quality, cost-effective products. By addressing these key drivers and challenges, market players can position themselves for long-term success in the dynamic the market.
What will be the Size of the Disposable Medical Supplies Market during the forecast period?
Explore market size, adoption trends, and growth potential for disposable medical supplies market Request Free Sample
- The market continues to evolve, driven by advancements in healthcare technology and the growing demand for enhanced patient safety and infection control. IV cannulas, made from innovative materials, enable efficient fluid administration while minimizing the risk of infection. Disposable lab equipment ensures the sterility of experimental samples, contributing to accurate results. Healthcare waste disposal solutions mitigate potential health hazards, while patient safety technologies, such as medical device sterilization and infection control protocols, safeguard patient wellbeing. Biomedical waste management systems streamline the disposal process, reducing environmental impact. In the realm of respiratory therapy, disposable devices, like nebulizers and oxygen masks, ensure the highest level of hygiene and patient comfort.
- Sterile packaging materials protect these devices from contamination during transportation and storage. Contact lens solutions, dialysis equipment, and single-use surgical instruments all share this commitment to maintaining a sterile environment. Patient safety extends to the production processes of essential supplies. Medical grade polymers are used in the manufacturing of syringes, nitrile gloves, surgical drapes, and disposable infusion sets, ensuring the production of high-quality, safe products. Needle disposal systems and needle stick prevention technologies further minimize the risk of infection and injury. Incontinence supplies, such as disposable briefs and pads, provide essential comfort and hygiene for patients, while latex-free gloves cater to those with allergies or sensitivities.
- Disposable specimen containers and blood collection tubes maintain the sterility of samples during transportation and storage, ensuring accurate diagnostic results. Electrocardiogram electrodes and surgical gowns and masks are integral components of patient care, with filtration technologies ensuring the protection of both patients and healthcare workers. The ongoing dynamism of the market reflects the continuous advancements in healthcare technology and the evolving needs of the healthcare sector.
How is this Disposable Medical Supplies Industry segmented?
The disposable medical supplies industry research report provides comprehensive data (region-wise segment analysis), with forecasts and estimates in "USD billion" for the period 2025-2029, as well as historical data from 2019-2023 for the following segments.
- Type
- Gloves
- Drapes and gowns
- Masks
- Others
- End-user
- Hospitals and clinics
- Ambulatory surgery center
- Others
- Distribution Channel
- Offline
- Online
- Application
- Plastics
- Nonwovens
- Rubber/Latex
- Metals
- Biodegradable materials
- Geography
- North America
- US
- Canada
- Europe
- France
- Germany
- Italy
- UK
- APAC
- China
- India
- Japan
- South America
- Brazil
- Rest of World (ROW)
- North America
By Type Insights
The gloves segment is estimated to witness significant growth during the forecast period.
The market is witnessing significant growth due to increasing healthcare demands and the importance of maintaining hygiene and safety in healthcare settings. Key product categories include respiratory therapy devices, sterile packaging materials, contact lens solution, dialysis equipment, catheter design features, personal protective equipment, syringe manufacturing process, nitrile glove production, surgical drape materials, iv administration sets, needle disposal systems, disposable infusion sets, single-use surgical instruments, pharmaceutical packaging, medical grade polymers, blood collection tubes, wound care dressings, needle stick prevention, surgical gown production, surgical mask filtration, electrocardiogram electrodes, incontinence supplies, latex-free gloves, disposable specimen containers, iv cannulas, disposable lab equipment, healthcare waste disposal, patient safety technologies, medical device sterilization, infection control protocols, and biomedical waste management.
Rising concerns about hygiene and safety from healthcare-associated infections (HAIs) are major drivers for the market. HAIs can occur in hospitals, long-term care, home care, and ambulatory care due to various factors such as the increasing number of morbidities and mortality rates, transmission of drug-resistant bacteria, prolonged hospital stays, disease outbreaks, and poor infection-control practices. To prevent HAIs, there is a growing demand for disposable medical supplies that ensure hygiene and safety. Additionally, an increasing number of surgeries and widespread availability and affordability of disposable medical gloves are further fueling market growth. The affordability and convenience of disposable medical supplies have made them a preferred choice for healthcare providers, leading to their widespread adoption.
Medical grade polymers and advanced technologies are being used to produce high-quality disposable medical supplies that cater to the evolving needs of the healthcare industry. In conclusion, the market is experiencing substantial growth due to the importance of maintaining hygiene and safety in healthcare settings, the increasing number of surgeries, and the affordability and convenience of disposable medical supplies. The market is expected to continue growing as healthcare providers prioritize patient safety and infection control.
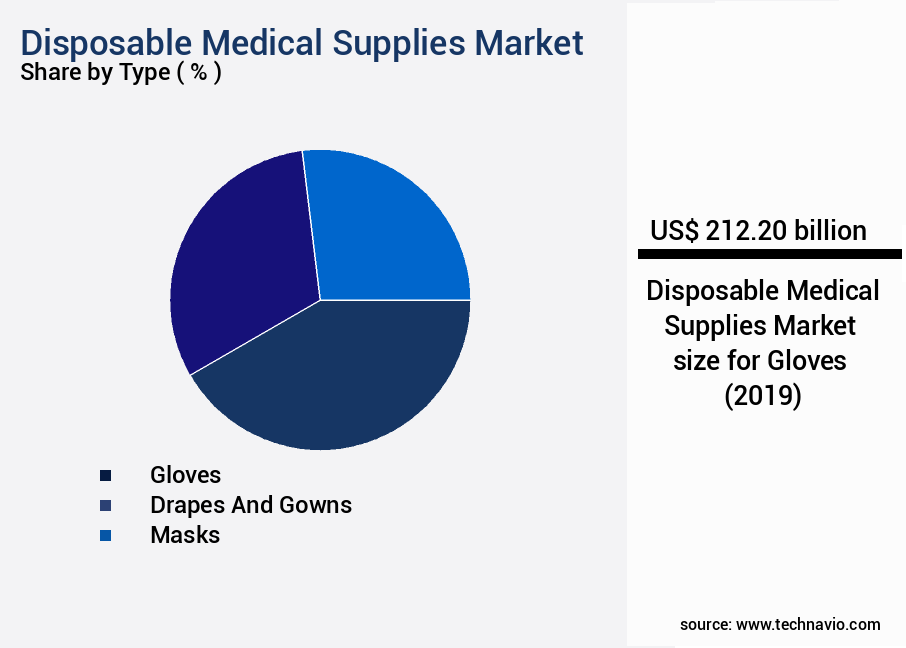
The Gloves segment was valued at USD 212.20 billion in 2019 and showed a gradual increase during the forecast period.
Regional Analysis
North America is estimated to contribute 40% to the growth of the global market during the forecast period.Technavio's analysts have elaborately explained the regional trends and drivers that shape the market during the forecast period.
See How Disposable Medical Supplies Market Demand is Rising in North America Request Free Sample
The market in North America is experiencing significant growth due to several factors. The increasing prevalence of chronic diseases and lifestyle-related illnesses, such as heart disorders, necessitates the use of various medical devices and supplies, including respiratory therapy devices, sterile packaging materials, dialysis equipment, and catheter design features. The rise in surgical and diagnostic procedures, driven by an aging population and advancements in medical technology, further boosts market demand. Healthcare professionals' growing awareness of infection prevention and strict regulations to maintain hygiene and safety at hospital facilities are also crucial factors. Supportive government initiatives and the presence of prominent companies in the region further propel market growth.
Infectious diseases, such as COVID-19, have highlighted the importance of personal protective equipment (PPE), including nitrile gloves and surgical masks with advanced filtration capabilities. Pharmaceutical packaging, medical grade polymers, blood collection tubes, wound care dressings, needle stick prevention, and disposable lab equipment are other essential disposable medical supplies that witness increasing demand. Patient safety technologies, such as medical device sterilization and infection control protocols, are critical components of the healthcare industry. Biomedical waste management and healthcare waste disposal are also essential aspects of the market, ensuring the safe disposal of used medical supplies and maintaining a clean and hygienic environment.
In summary, the market in North America is driven by the rising incidences and prevalence of diseases, the increasing number of surgical and diagnostic procedures, and the growing awareness of infection prevention and safety regulations.
Market Dynamics
Our researchers analyzed the data with 2024 as the base year, along with the key drivers, trends, and challenges. A holistic analysis of drivers will help companies refine their marketing strategies to gain a competitive advantage.
The disposable medical supplies market is undergoing rapid innovation, driven by the increasing need for surgical instrument sterilization validation and compliance with stringent safety protocols. Manufacturers prioritize disposable medical device material selection to ensure biocompatibility and reliability, while addressing the impact of packaging on product sterility and overall stability. Effective medical supply chain risk management and quality control procedures for disposable gloves are critical in maintaining standards and reducing contamination risks.
Healthcare providers are focusing on efficient biomedical waste management protocols and best practices in healthcare waste disposal management to minimize environmental impact. A comparison of sterilization methods for medical devices highlights advancements in ensuring infection prevention, complemented by the design and development of single-use endoscopes that enhance patient safety. Adhering to regulatory requirements for disposable medical supplies remains a priority as sustainability and cost-efficiency become more relevant.
Innovations such as advanced materials used in wound care dressings and safety features for intravenous catheters and infusion sets are improving treatment outcomes. Additionally, the impact of disposable medical supply usage on healthcare costs drives the need for improved efficiency for disposable medical supply logistics and techniques for reducing medical supply chain waste. Efforts toward enhancing the traceability of disposable medical products, evaluating the biocompatibility of medical device materials, and adopting strategies for improving the sustainability of medical supplies position the industry for significant long-term growth.
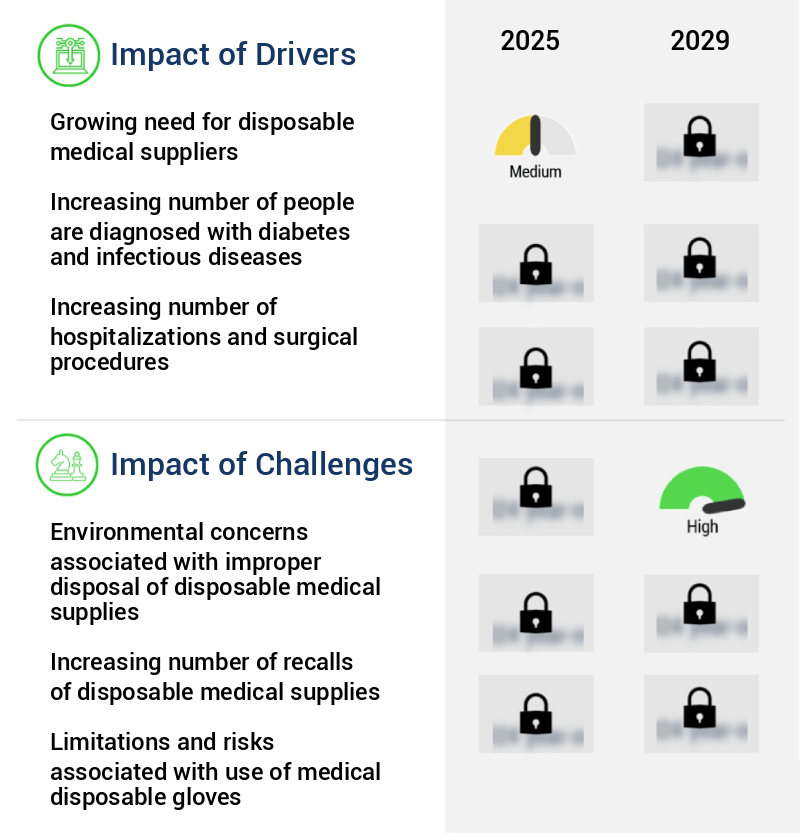
What are the key market drivers leading to the rise in the adoption of Disposable Medical Supplies Industry?
- The increasing demand for disposable medical supplies is the primary market driver, underpinned by the importance of maintaining sterility and reducing the risk of infection in healthcare settings.
- Disposable medical supplies, including wound care dressings, needle stick prevention devices, surgical gowns, surgical masks, electrocardiogram electrodes, incontinence supplies, latex-free gloves, and disposable specimen containers, are gaining popularity among end-users due to their infection prevention benefits. The preference for disposable supplies over reusable devices is driven by the lower risk of cross-contamination. Single-use medical supplies do not require reprocessing, reducing the likelihood of inadequately cleaned reprocessing agents that can penetrate the device's intricate structures and create potential breeding grounds for bacteria and viruses. These microorganisms can compromise the device's functionality and potentially harm patients. This trend is particularly significant for medical supplies used in critical care settings, where the risk of infection transmission is high. The demand for disposable medical supplies is expected to continue growing as healthcare providers prioritize patient safety and infection control.
What are the market trends shaping the Disposable Medical Supplies Industry?
- The trend in the market is toward utilizing technological advances to enhance product quality. This approach is mandatory for professionals seeking to stay current and competitive.
- Disposable medical supplies have become essential components in healthcare settings, with companies continually innovating to meet the evolving needs of medical and surgical procedures. Advanced iv cannulas made from superior materials ensure patient safety and effective fluid administration. In the realm of disposable lab equipment, technologies such as medical device sterilization and infection control protocols are prioritized to maintain a clean and safe environment. Biomedical waste management is another critical area of focus, with companies investing in harmonious solutions to minimize the risk of contamination and adhere to regulatory requirements. Innovative technologies are propelling the development of disposable medical supplies, enhancing their performance, durability, comfort, and ease of use.
- For instance, Braun SE's Stimuplex Ultra 360 is a next-generation echogenic stimulating needle for nerve blocks, designed to provide improved visibility during ultrasound procedures through advanced echogenicity, 360-degree visibility, and puncture consistency. This needle's adoption by healthcare professionals underscores the importance of such advancements in ensuring successful medical procedures. Companies are also dedicating significant resources to research and development, leveraging diverse technologies to create high-quality disposable medical supplies that cater to various applications. This commitment to innovation is crucial in addressing the complex demands of the healthcare industry and improving patient outcomes.
What challenges does the Disposable Medical Supplies Industry face during its growth?
- The improper disposal of disposable medical supplies poses significant environmental concerns, which represents a major challenge and potential hindrance to the growth of the medical industry.
- Disposable medical supplies play a crucial role in healthcare settings to prevent the transmission of infections during medical procedures. These supplies include respiratory therapy devices, sterile packaging materials, contact lens solution, dialysis equipment, and personal protective equipment. The increasing focus on patient safety and infection control has led to a rise in demand for these supplies. However, the disposal of these supplies after use generates significant hospital waste, which may contain infectious and hazardous materials. This waste can pose risks to the environment and healthcare workers.
- The manufacturing processes for items such as syringes and nitrile gloves involve strict quality control measures to ensure sterility and safety. Catheter design features also prioritize ease of use, sterility, and patient comfort. The use of disposable medical supplies is a necessary aspect of modern healthcare, and ongoing research aims to improve their functionality and sustainability.
Exclusive Customer Landscape
The disposable medical supplies market forecasting report includes the adoption lifecycle of the market, covering from the innovator's stage to the laggard's stage. It focuses on adoption rates in different regions based on penetration. Furthermore, the disposable medical supplies market report also includes key purchase criteria and drivers of price sensitivity to help companies evaluate and develop their market growth analysis strategies.
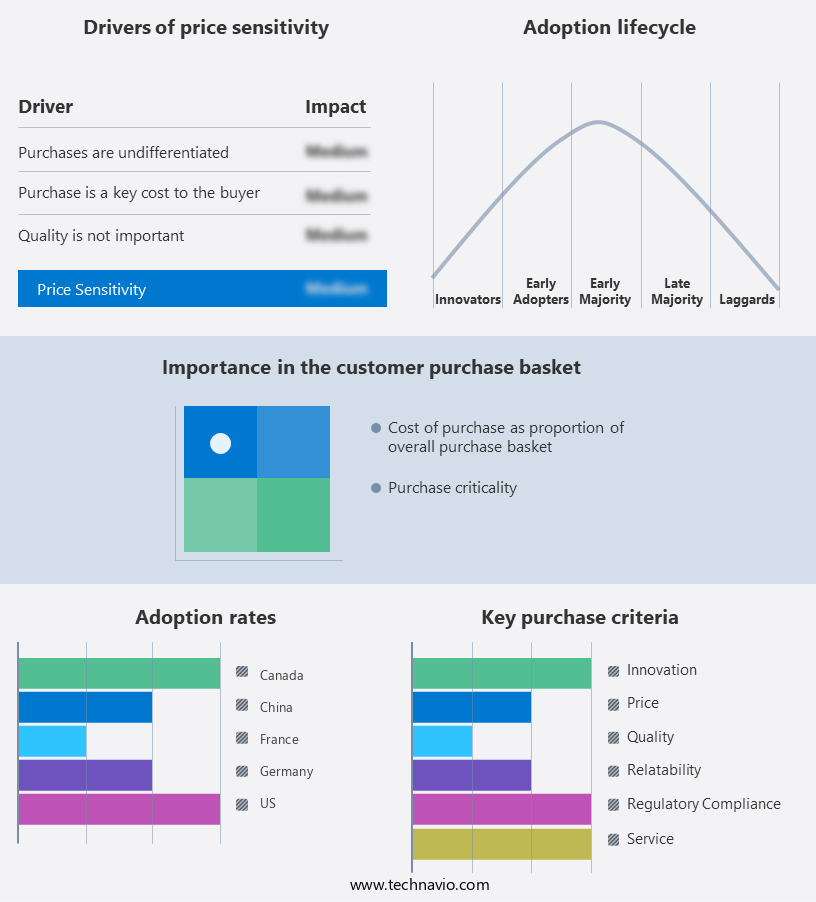
Customer Landscape of Disposable Medical Supplies Industry
Key Companies & Market Insights
Companies are implementing various strategies, such as strategic alliances, disposable medical supplies market forecast, partnerships, mergers and acquisitions, geographical expansion, and product/service launches, to enhance their presence in the industry.
3M Co. - The company specializes in providing a range of disposable medical supplies, including the 3M Aura respirator, surgical masks such as the 3M Standard Tie-On model, and the 3M Bair Hugger Warming Blanket. These products contribute significantly to maintaining a safe and efficient healthcare environment.
The industry research and growth report includes detailed analyses of the competitive landscape of the market and information about key companies, including:
- 3M Co.
- Ambu AS
- Ansell Ltd.
- B.Braun SE
- Becton Dickinson and Co.
- Cardinal Health Inc.
- Fresenius SE and Co. KGaA
- GPC Medical Ltd.
- ICU Medical Inc.
- Johnson and Johnson Services Inc.
- Medline Industries LP
- Medtronic Plc
- Molnlycke Health Care AB
- Nipro Corp.
- Semperit AG Holding
- Smith and Nephew plc
- Stryker Corp.
- Teleflex Inc.
- Terumo Corp.
Qualitative and quantitative analysis of companies has been conducted to help clients understand the wider business environment as well as the strengths and weaknesses of key industry players. Data is qualitatively analyzed to categorize companies as pure play, category-focused, industry-focused, and diversified; it is quantitatively analyzed to categorize companies as dominant, leading, strong, tentative, and weak.
Recent Development and News in Disposable Medical Supplies Market
- In January 2024, Medtronic plc, a global healthcare solutions company, announced the launch of its new disposable insulin pump, MiniMedTM 780G with SmartGuardTM technology, which uses artificial intelligence to improve insulin delivery for diabetes patients (Medtronic Press Release, 2024).
- In March 2024, 3M and Honeywell International, Inc. Entered into a strategic partnership to expand their joint venture, 3M Honeywell Safety Products LLC, focusing on the production and distribution of N95 respirators and other personal protective equipment (PPE) for the healthcare sector (3M & Honeywell Press Release, 2024).
- In April 2025, Stryker Corporation completed the acquisition of Invacare Corporation, a leading provider of medical equipment and disposable supplies for the home healthcare market, for approximately USD7.1 billion (Stryker Press Release, 2025).
- In May 2025, the European Commission approved the marketing authorization for Terumo Corporation's new disposable infusion set, Supasette Pro, designed to reduce the risk of infections in patients receiving long-term intravenous therapy (Terumo Press Release, 2025).
Research Analyst Overview
- The market encompasses a diverse range of products, including wound dressings, surgical instruments, patient monitoring equipment, and clinical trial supplies. Product shelf life is a critical factor in this market, as suppliers must ensure the aseptic processing of their offerings to maintain sterility assurance methods. Needle safety devices and antimicrobial coatings are essential components in reducing infection risks. Sterilization validation through ethylene oxide and gamma radiation is common practice to ensure product quality and safety. Supply chain traceability is another essential trend, as regulatory compliance demands transparency in the production and distribution of medical supplies.
- Surgical instrument design and material biocompatibility are crucial aspects of medical plastics, which are widely used in disposable medical devices. Home healthcare supplies, such as disposable diagnostics and protective apparel, also follow stringent quality control testing and regulatory standards. Surgical mesh materials, drug delivery systems, and medical implant materials undergo extensive testing for safety and efficacy. Surgical sealant technology and medical waste recycling are emerging trends, offering potential cost savings and environmental benefits. Medical device reusability is another topic of interest, as some suppliers explore alternative methods to reduce waste and improve sustainability.
Dive into Technavio's robust research methodology, blending expert interviews, extensive data synthesis, and validated models for unparalleled Disposable Medical Supplies Market insights. See full methodology.
|
Market Scope |
|
|
Report Coverage |
Details |
|
Page number |
250 |
|
Base year |
2024 |
|
Historic period |
2019-2023 |
|
Forecast period |
2025-2029 |
|
Growth momentum & CAGR |
Accelerate at a CAGR of 36.8% |
|
Market growth 2025-2029 |
USD 3875.2 billion |
|
Market structure |
Fragmented |
|
YoY growth 2024-2025(%) |
26.4 |
|
Key countries |
US, Germany, China, Canada, France, UK, Japan, Italy, Brazil, and India |
|
Competitive landscape |
Leading Companies, Market Positioning of Companies, Competitive Strategies, and Industry Risks |
What are the Key Data Covered in this Disposable Medical Supplies Market Research and Growth Report?
- CAGR of the Disposable Medical Supplies industry during the forecast period
- Detailed information on factors that will drive the growth and forecasting between 2025 and 2029
- Precise estimation of the size of the market and its contribution of the industry in focus to the parent market
- Accurate predictions about upcoming growth and trends and changes in consumer behaviour
- Growth of the market across North America, Europe, Asia, and Rest of World (ROW)
- Thorough analysis of the market's competitive landscape and detailed information about companies
- Comprehensive analysis of factors that will challenge the disposable medical supplies market growth of industry companies
We can help! Our analysts can customize this disposable medical supplies market research report to meet your requirements.
 RIA -
RIA - 
