Donkey Milk Market Analysis, Size, and Forecast 2024-2028: North America (Canada and Mexico), Europe (France, Germany, and UK), Middle East and Africa (UAE), APAC (China, India, Indonesia, Japan, Malaysia, South Korea, and Thailand), South America (Brazil), and Rest of World (ROW)

Donkey Milk Market Analysis, Size, and Forecast 2024-2028:
North America (Canada and Mexico), Europe (France, Germany, and UK), Middle East and Africa (UAE), APAC (China, India, Indonesia, Japan, Malaysia, South Korea, and Thailand), South America (Brazil), and Rest of World (ROW)

Published: Feb 2024 156 Pages SKU: IRTNTR73735

Market Overview at a Glance

$20.16 Mn
Market Opportunity
9.64%
CAGR
8.63
YoY growth 2023-2024(%)

Donkey Milk Market Size 2024-2028

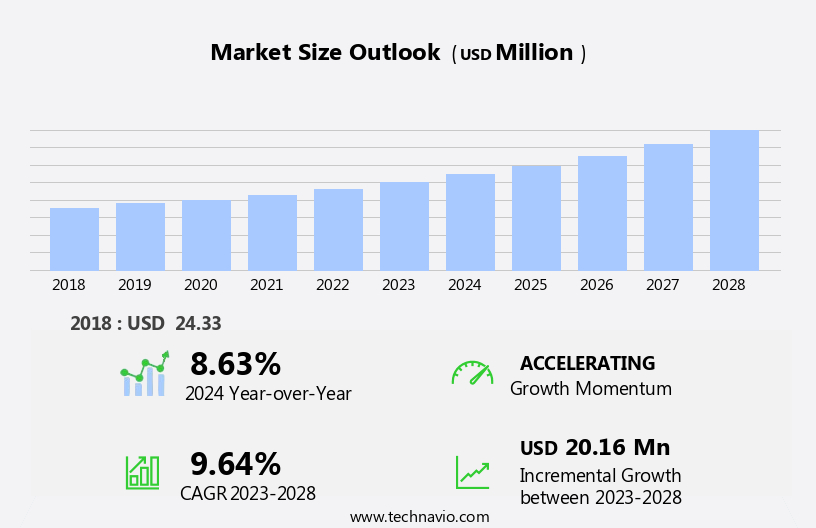
The donkey milk market size is forecast to increase by USD 20.16 million, at a CAGR of 9.64% between 2023 and 2028.

  • The market is witnessing significant growth due to the increasing demand for sugar-free and organic dairy alternatives. This trend is particularly prominent in the health-conscious consumer population, who seek nutrient-rich and natural food and beverage options. Furthermore, the cosmetics industry's growing focus on anti-aging products is driving the demand for donkey milk, which is known for its anti-inflammatory and anti-aging properties. However, the market faces challenges in the form of the availability of substitutes for donkey milk, such as goat and cow milk, which may offer similar benefits at lower costs. Companies seeking to capitalize on the market's potential must focus on differentiating their offerings through unique value propositions, such as superior product quality, ethical sourcing, and innovative applications.
  • Additionally, collaborations and partnerships with key players in the cosmetics industry could provide significant growth opportunities. In summary, the market is experiencing robust growth driven by health and wellness trends and the cosmetics industry's focus on anti-aging products. Companies must navigate the challenge of competing with substitutes and differentiate their offerings to capture market share.

What will be the Size of the Donkey Milk Market during the forecast period?

Donkey Milk Market Size

Explore in-depth regional segment analysis with market size data - historical 2018-2022 and forecasts 2024-2028 - in the full report.  
Request Free Sample

The market exhibits a dynamic and evolving landscape, driven by ongoing research and development in various sectors. Production efficiency is a key focus, with protein content analysis and immunoglobulin levels under constant scrutiny to optimize milk yield and quality. Farm management practices and animal welfare standards are essential for ensuring a consistent supply of high-quality milk. Food safety standards and nutritional labeling are paramount in the market, with traceability systems ensuring transparency and consumer trust. Pasteurization methods and mineral concentration are critical factors in maintaining the probiotic properties of donkey milk, while milk processing techniques and digestibility testing contribute to product differentiation and value-added offerings.

Quality control measures and regulatory compliance are essential for economic viability, with shelf life extension a priority to minimize waste and maximize profitability. Sensory evaluation and microbial contamination testing are ongoing concerns, with antioxidant capacity and allergenic potential also under scrutiny to meet consumer preferences. The market demand for donkey milk continues to grow, driven by its unique health benefits and nutritional profile. As such, supply chain logistics and farm management practices are continually evolving to meet the increasing demand. The ongoing research and development in this sector ensure that donkey milk remains a dynamic and innovative market, with new applications and value-added products continually emerging.

How is this Donkey Milk Industry segmented?

The donkey milk industry research report provides comprehensive data (region-wise segment analysis), with forecasts and estimates in "USD million" for the period 2024-2028, as well as historical data from 2018-2022 for the following segments.

  • Application
    • Cosmetics and personal care
    • Food and beverages
  • Product Type
    • Powder
    • Liquid
  • Distribution Channel
    • Online Retail
    • Supermarkets and Hypermarkets
    • Health Food Stores
    • Direct Sales
  • Consumer Segment
    • Health-Conscious Consumer
    • Cosmetic Industry
    • General Consumers
    • Allergy Sufferers
  • Geography
    • North America
      • US
      • Canada
      • Mexico
    • Europe
      • France
      • Germany
      • UK
    • Middle East and Africa
      • UAE
    • APAC
      • China
      • India
      • Indonesia
      • Japan
      • Malaysia
      • South Korea
      • Thailand
    • South America
      • Brazil
    • Rest of World (ROW)

By Application Insights

The cosmetics and personal care segment is estimated to witness significant growth during the forecast period.

The market experiences steady growth in 2023, with the cosmetics and personal care segment holding a substantial share. The increasing demand for natural and organic skincare solutions, driven by consumer preferences and the personal care industry's evolving trends, fuels this segment's expansion. Donkey milk, a natural and eco-friendly ingredient, is free from synthetic chemicals and additives, making it an attractive option for manufacturers. Innovation in the cosmetics and personal care sector, such as the development of new donkey milk-based products and formulations, further propels market growth. This segment's expansion also includes the incorporation of donkey milk in hair care products, like shampoo conditioners.

Animal welfare standards, protein content analysis, immunoglobulin levels, fatty acid profile, vitamin analysis, and mineral concentration are essential considerations in donkey milk production. Food safety standards, packaging materials, traceability systems, and regulatory compliance ensure product quality and consumer safety. Milk processing techniques, such as pasteurization methods, digestibility testing, and sensory evaluation, contribute to the market's efficiency and product differentiation. Value-added products, lactation management, and shelf life extension strategies further enhance market value. Quality control measures, supply chain logistics, and microbial contamination testing maintain economic viability and consumer trust. Antioxidant capacity, probiotic properties, and allergenic potential are essential aspects of donkey milk composition that add to its health benefits.

In conclusion, the market is driven by consumer preferences, innovative product development, and stringent quality control measures. The cosmetics and personal care segment's growth is a significant contributor to the market's expansion, as manufacturers seek to cater to the increasing demand for natural and organic skincare solutions.

Donkey Milk Market Size

Request Free Sample

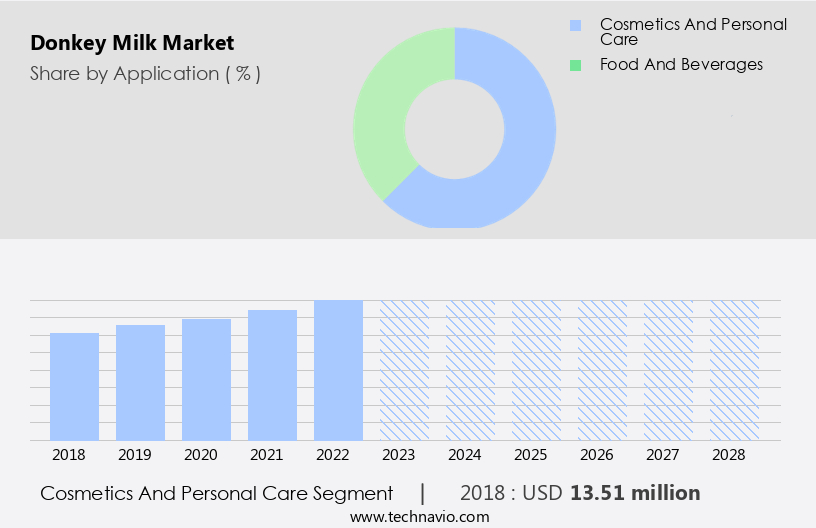
The Cosmetics and personal care segment was valued at USD 13.51 million in 2018 and showed a gradual increase during the forecast period.

Regional Analysis

Europe is estimated to contribute 39% to the growth of the global market during the forecast period.Technavio's analysts have elaborately explained the regional trends and drivers that shape the market during the forecast period.

Donkey Milk Market Share by Geography

 Request Free Sample

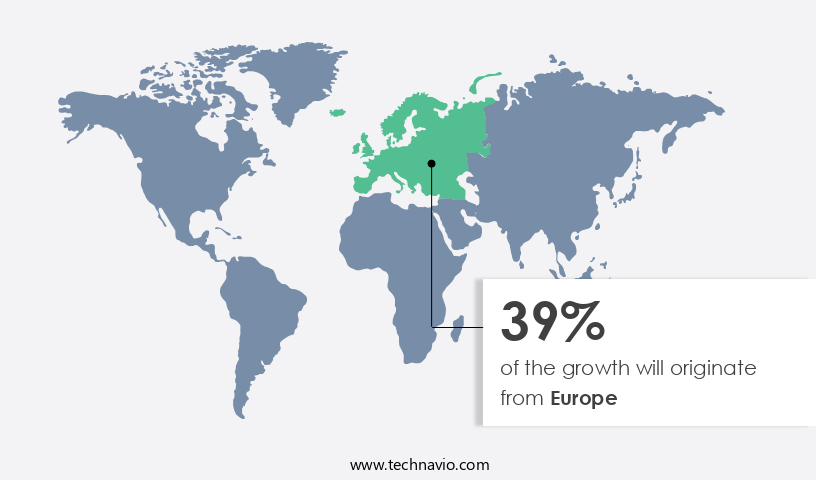
In the dynamic global market for donkey milk, Europe holds a substantial share due to the escalating demand for natural ingredients in cosmetics and increasing consumer health consciousness. Countries like the UK, Germany, and Italy are major contributors, with the UK specifically seeing a surge in the use of donkey milk for maintaining wellness. Other European nations, including Spain, Portugal, Belgium, Bulgaria, Greece, and France, also consume donkey milk and related products. Factors fueling market expansion include the rising imports of powdered donkey milk and evolving health preferences among consumers. Production efficiency is ensured through rigorous farm management practices and quality control measures.

Protein content analysis, immunoglobulin levels, and fatty acid profile are crucial aspects of milk processing techniques. Animal welfare standards, vitamin analysis, and health benefits claims are key considerations for both producers and consumers. Food safety standards are stringently adhered to, with traceability systems and probiotic properties ensuring product authenticity. Mineral concentration, nutritional labeling, and market demand forecasting are essential elements of economic viability. Milk processing techniques include pasteurization methods and digestibility testing, while product differentiation is achieved through value-added offerings like lactation management and shelf life extension. Regulatory compliance, sensory evaluation, microbial contamination, antioxidant capacity, and allergenic potential are critical aspects of maintaining consumer trust and market growth.

Market Dynamics

Our researchers analyzed the data with 2023 as the base year, along with the key drivers, trends, and challenges. A holistic analysis of drivers will help companies refine their marketing strategies to gain a competitive advantage.

Donkey milk opportunities 2024 include donkey milk for cosmetics and hypoallergenic dairy products, meeting demand. Donkey milk supply chain tools streamline operations, while donkey milk competitive insights highlight niche suppliers. Sustainable donkey farming supports eco-friendly dairy trends. Donkey milk regulations 2024-2028 shape donkey milk demand in Europe 2024. Premium donkey milk offerings and donkey milk market forecasts drive adoption. Donkey milk for health stores and custom donkey milk products target niches. Donkey milk barriers and strategies address production scale, with donkey milk sourcing innovations and donkey milk cost efficiency boosting margins. Donkey milk market intelligence and specialty dairy advancements propel growth.

What are the key market drivers leading to the rise in the adoption of Donkey Milk Industry?

  • The increasing preference for sugar-free and organic donkey milk products is the primary market trend, driven by growing consumer awareness and demand for healthier and more natural dairy alternatives. 
  • Donkey milk, a niche dairy product, is gaining popularity due to its potential health benefits. With increasing consumer awareness and concern for nutrition, the demand for donkey milk is on the rise. companies are focusing on enhancing production efficiency to meet the growing market needs. Protein content analysis and immunoglobulin levels are crucial factors in ensuring the quality of donkey milk. Moreover, the fatty acid profile, vitamin analysis, and adherence to animal welfare standards are essential for product differentiation. Food safety standards are a priority to maintain consumer trust.
  • Health benefits claims, such as improved digestion and allergy relief, add to the market's appeal. As the demand for sugar-free products continues to surge, companies are expected to introduce sugar-free donkey milk variants to cater to this trend. The forecast period is likely to witness significant growth in this sector.

What are the market trends shaping the Donkey Milk Industry?

  • The increasing interest in anti-aging cosmetics signifies a prominent market trend. This sector is experiencing significant growth due to the rising demand from consumers seeking to combat the signs of aging.
  • Donkey milk, a natural source rich in essential fatty acids, vitamins, and minerals, is gaining popularity in the anti-aging cosmetics industry. This beverage from donkeys is known for its restorative properties, aiding in the reduction of fine lines and regeneration of damaged skin cells. The increasing awareness of skincare among the younger generation, coupled with the belief in natural and organic products, fuels the demand for donkey milk in cosmetics. Traceability systems and farm management practices are crucial in ensuring the quality of donkey milk. Proper packaging materials and supply chain logistics are essential to maintain the product's integrity during transportation and storage.
  • Pasteurization methods and mineral concentration are key factors in determining the milk's quality and shelf life. The probiotic properties of donkey milk contribute to its anti-inflammatory and antibacterial benefits, making it an effective solution for acne, eczema, and other skin conditions. The milk's protective vitamins and nutrients offer sun damage protection, further enhancing its anti-aging properties. By focusing on these aspects, the market is expected to grow, offering opportunities for businesses to cater to the increasing demand for natural and effective skincare solutions.

What challenges does the Donkey Milk Industry face during its growth?

  • The lack of viable alternatives to donkey milk poses a significant challenge to the expansion of the related industry. 
  • Donkey milk faces competition from various alternatives in the global market, such as camel, goat, bovine milk, and plant-based milk. These substitutes have gained popularity due to their unique nutritional profiles and consumer preferences. For instance, camel milk-based products, including powder, chocolates, and skincare items, offer superior health benefits and are increasingly used as ingredients in food and beverage manufacturing. The availability of these alternatives can impact the growth of the market during the forecast period. Consumers' preferences and market trends influence the demand for these dairy alternatives. Milk processing techniques, such as pasteurization and homogenization, ensure the preservation of essential nutrients and enhance the shelf life of these products.
  • Nutritional labeling and digestibility testing are crucial factors in differentiating these milk alternatives and providing value-added products to consumers. Lactation management practices also play a significant role in ensuring the quality and consistency of milk production. The market demand for these dairy alternatives is expected to continue growing, driven by their unique health benefits and consumer preferences.

Exclusive Customer Landscape

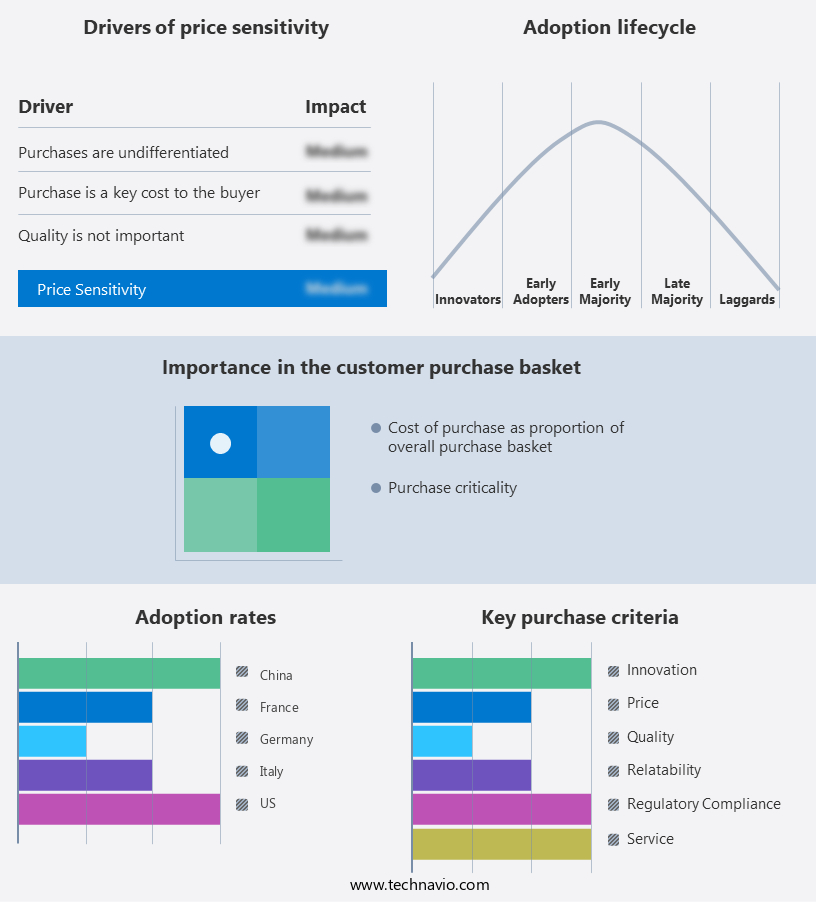
The donkey milk market forecasting report includes the adoption lifecycle of the market, covering from the innovator's stage to the laggard's stage. It focuses on adoption rates in different regions based on penetration. Furthermore, the donkey milk market report also includes key purchase criteria and drivers of price sensitivity to help companies evaluate and develop their market growth analysis strategies.

Donkey Milk Market Share by Geography

 Customer Landscape

Key Companies & Market Insights

Companies are implementing various strategies, such as strategic alliances, donkey milk market forecast, partnerships, mergers and acquisitions, geographical expansion, and product/service launches, to enhance their presence in the industry.

Aadvik Foods and Products Pvt. Ltd. - This company specializes in producing and marketing a range of donkey milk products. Their offerings include Lac Jennius freeze-dried donkey milk powder and unique donkey milk soaps in green tea and coffee flavors. These high-quality items cater to consumers seeking alternative sources for skincare and nutrition.

The industry research and growth report includes detailed analyses of the competitive landscape of the market and information about key companies, including:

  • Aadvik Foods and Products Pvt. Ltd.
  • Asinus Atlanticus SA
  • AZIENDA AGRICOLA MONTEBADUCCO
  • Chowdeswari Dairy Farm
  • Dolphin IBA Nutricosmetics and Cosmeceuticals Pvt Ltd.
  • Donna Tina Co.
  • Dulcededonke 
  • Eurolactis Group SA
  • Golden Donkeys Farm
  • J M JADEJA DONKEY FARM
  • JSR Donkey Farm
  • Kalyani Farm House
  • Mahadev Donkey Milk Dairy
  • RJ Donkey Farm
  • Shri Aarogyam Donkey Milk
  • SRI. SHANTHI TYRES
  • TDS Donkey Farm
  • The Donkey Dairy Pty Ltd.
  • VedaOils
  • YESRAJ AGRO EXPORTS PVT. LTD

Qualitative and quantitative analysis of companies has been conducted to help clients understand the wider business environment as well as the strengths and weaknesses of key industry players. Data is qualitatively analyzed to categorize companies as pure play, category-focused, industry-focused, and diversified; it is quantitatively analyzed to categorize companies as dominant, leading, strong, tentative, and weak.

Recent Development and News in Donkey Milk Market

  • In January 2024, French dairy company, Lactalis, announced the launch of its new donkey milk brand, "Lactalis Préféré Donkey Milk," marking a significant entry into the market (Lactalis Press Release, 2024). This move aimed to cater to the growing demand for specialized dairy products, particularly for those with lactose intolerance or allergies.
  • In March 2024, Danish biotech firm, Bio-Techne, and Italian donkey milk producer, Fattorie La Vialla, signed a strategic partnership to develop and commercialize donkey milk-derived peptides for therapeutic applications (Bio-Techne Press Release, 2024). This collaboration combined Bio-Techne's expertise in biotechnology with Fattorie La Vialla's donkey milk production, targeting the pharmaceutical and nutraceutical industries.
  • In May 2024, Spanish company, Granja La Mancha, secured a €5 million investment from venture capital firm, Kireas, to expand its donkey milk production capacity and enter new markets (Granja La Mancha Press Release, 2024). This investment supported the company's growth strategy, enabling it to meet the increasing demand for donkey milk and its derivatives.
  • In February 2025, the European Commission approved the use of donkey milk as a novel food ingredient, paving the way for its commercialization in the European Union (European Commission Press Release, 2025). This regulatory approval opened up new opportunities for donkey milk producers and processors, allowing them to tap into the vast European market.

Research Analyst Overview

  • The market exhibits dynamic trends, with a focus on milk yield optimization and sustainability initiatives. Consumers seek immune system support and turn to this unique milk for its therapeutic properties. Distribution channels expand, incorporating nutritional supplements and functional food ingredients. Protein hydrolysate and casein micelles are key components, while sensory attributes and lipid extraction enhance product appeal. Skincare benefits, hair care, and pharmaceutical applications fuel growth.
  • Ethical sourcing and lactose content are critical considerations for ethical and health-conscious consumers. Pricing strategies and consumer acceptance shape market competition. Whey protein isolate and colostrum harvesting offer gut health improvement and anti-aging properties. Infant formula application and cosmetic ingredient uses further broaden market reach.

Dive into Technavio's robust research methodology, blending expert interviews, extensive data synthesis, and validated models for unparalleled Donkey Milk Market insights. See full methodology.

Market Scope

Report Coverage

Details

Page number

156

Base year

2023

Historic period

2018-2022

Forecast period

2024-2028

Growth momentum & CAGR

Accelerate at a CAGR of 9.64%

Market growth 2024-2028

USD 20.16 million

Market structure

Fragmented

YoY growth 2023-2024(%)

8.63

Key countries

US, Malaysia, Indonesia, Germany, UK, South Korea, France, Canada, Brazil, Thailand, UAE, Mexico, China, Japan, and India

Competitive landscape

Leading Companies, Market Positioning of Companies, Competitive Strategies, and Industry Risks

Request Free Sample

What are the Key Data Covered in this Donkey Milk Market Research and Growth Report?

  • CAGR of the Donkey Milk industry during the forecast period
  • Detailed information on factors that will drive the growth and forecasting between 2024 and 2028
  • Precise estimation of the size of the market and its contribution of the industry in focus to the parent market
  • Accurate predictions about upcoming growth and trends and changes in consumer behaviour
  • Growth of the market across Europe, APAC, North America, Middle East and Africa, and South America
  • Thorough analysis of the market's competitive landscape and detailed information about companies
  • Comprehensive analysis of factors that will challenge the donkey milk market growth of industry companies

We can help! Our analysts can customize this donkey milk market research report to meet your requirements.

Get in touch

1 Executive Summary

  • 1.1 Market overview
    • Exhibit 01: Executive Summary – Chart on Market Overview
    • Exhibit 02: Executive Summary – Data Table on Market Overview
    • Exhibit 03: Executive Summary – Chart on Global Market Characteristics
    • Exhibit 04: Executive Summary – Chart on Market by Geography
    • Exhibit 05: Executive Summary – Chart on Market Segmentation by Application
    • Exhibit 06: Executive Summary – Chart on Market Segmentation by Product Type
    • Exhibit 07: Executive Summary – Chart on Incremental Growth
    • Exhibit 08: Executive Summary – Data Table on Incremental Growth
    • Exhibit 09: Executive Summary – Chart on Vendor Market Positioning

2 Market Landscape

  • 2.1 Market ecosystem
    • Exhibit 10: Parent market
    • Exhibit 11: Market Characteristics

3 Market Sizing

  • 3.1 Market definition
    • Exhibit 12: Offerings of vendors included in the market definition
  • 3.2 Market segment analysis
    • Exhibit 13: Market segments
  • 3.3 Market size 2023
    • 3.4 Market outlook: Forecast for 2023-2028
      • Exhibit 14: Chart on Global - Market size and forecast 2023-2028 ($ million)
      • Exhibit 15: Data Table on Global - Market size and forecast 2023-2028 ($ million)
      • Exhibit 16: Chart on Global Market: Year-over-year growth 2023-2028 (%)
      • Exhibit 17: Data Table on Global Market: Year-over-year growth 2023-2028 (%)

    4 Historic Market Size

    • 4.1 Global donkey milk market 2018 - 2022
      • Exhibit 18: Historic Market Size – Data Table on global donkey milk market 2018 - 2022 ($ million)
    • 4.2 Application Segment Analysis 2018 - 2022
      • Exhibit 19: Historic Market Size – Application Segment 2018 - 2022 ($ million)
    • 4.3 Product Type Segment Analysis 2018 - 2022
      • Exhibit 20: Historic Market Size – Product Type Segment 2018 - 2022 ($ million)
    • 4.4 Geography Segment Analysis 2018 - 2022
      • Exhibit 21: Historic Market Size – Geography Segment 2018 - 2022 ($ million)
    • 4.5 Country Segment Analysis 2018 - 2022
      • Exhibit 22: Historic Market Size – Country Segment 2018 - 2022 ($ million)

    5 Five Forces Analysis

    • 5.1 Five forces summary
      • Exhibit 23: Five forces analysis - Comparison between 2023 and 2028
    • 5.2 Bargaining power of buyers
      • Exhibit 24: Chart on Bargaining power of buyers – Impact of key factors 2023 and 2028
    • 5.3 Bargaining power of suppliers
      • Exhibit 25: Bargaining power of suppliers – Impact of key factors in 2023 and 2028
    • 5.4 Threat of new entrants
      • Exhibit 26: Threat of new entrants – Impact of key factors in 2023 and 2028
    • 5.5 Threat of substitutes
      • Exhibit 27: Threat of substitutes – Impact of key factors in 2023 and 2028
    • 5.6 Threat of rivalry
      • Exhibit 28: Threat of rivalry – Impact of key factors in 2023 and 2028
    • 5.7 Market condition
      • Exhibit 29: Chart on Market condition - Five forces 2023 and 2028

    6 Market Segmentation by Application

    • 6.1 Market segments
      • Chart on Application - Market share (2023-2028) (%)
      • Data Table on Application - Market share (2023-2028) (%)
    • 6.2 Comparison by Application
      • Chart on Comparison by Application
      • Data Table on Comparison by Application
    • 6.3 Cosmetics and personal care - Market size and forecast (2023-2028)
      • Chart on Cosmetics and personal care - Market size and forecast (2023-2028) ($ million)
      • Data Table on Cosmetics and personal care - Market size and forecast (2023-2028) ($ million)
      • Chart on Cosmetics and personal care - Year-over-year growth (2023-2028) (%)
      • Data Table on Cosmetics and personal care - Year-over-year growth (2023-2028) (%)
    • 6.4 Food and beverages - Market size and forecast (2023-2028)
      • Chart on Food and beverages - Market size and forecast (2023-2028) ($ million)
      • Data Table on Food and beverages - Market size and forecast (2023-2028) ($ million)
      • Chart on Food and beverages - Year-over-year growth (2023-2028) (%)
      • Data Table on Food and beverages - Year-over-year growth (2023-2028) (%)
    • 6.5 Market opportunity by Application
      • Market opportunity by Application ($ million)
      • Data Table on Market opportunity by Application ($ million)

    7 Market Segmentation by Product Type

    • 7.1 Market segments
      • Chart on Product Type - Market share (2023-2028) (%)
      • Data Table on Product Type - Market share (2023-2028) (%)
    • 7.2 Comparison by Product Type
      • Chart on Comparison by Product Type
      • Data Table on Comparison by Product Type
    • 7.3 Powder - Market size and forecast (2023-2028)
      • Chart on Powder - Market size and forecast (2023-2028) ($ million)
      • Data Table on Powder - Market size and forecast (2023-2028) ($ million)
      • Chart on Powder - Year-over-year growth (2023-2028) (%)
      • Data Table on Powder - Year-over-year growth (2023-2028) (%)
    • 7.4 Liquid - Market size and forecast (2023-2028)
      • Chart on Liquid - Market size and forecast (2023-2028) ($ million)
      • Data Table on Liquid - Market size and forecast (2023-2028) ($ million)
      • Chart on Liquid - Year-over-year growth (2023-2028) (%)
      • Data Table on Liquid - Year-over-year growth (2023-2028) (%)
    • 7.5 Market opportunity by Product Type
      • Market opportunity by Product Type ($ million)
      • Data Table on Market opportunity by Product Type ($ million)

    8 Customer Landscape

    • 8.1 Customer landscape overview
      • Exhibit 58: Analysis of price sensitivity, lifecycle, customer purchase basket, adoption rates, and purchase criteria

    9 Geographic Landscape

    • 9.1 Geographic segmentation
      • Exhibit 59: Chart on Market share by geography 2023-2028 (%)
      • Exhibit 60: Data Table on Market share by geography 2023-2028 (%)
    • 9.2 Geographic comparison
      • Exhibit 61: Chart on Geographic comparison
      • Exhibit 62: Data Table on Geographic comparison
    • 9.3 Europe - Market size and forecast 2023-2028
      • Exhibit 63: Chart on Europe - Market size and forecast 2023-2028 ($ million)
      • Exhibit 64: Data Table on Europe - Market size and forecast 2023-2028 ($ million)
      • Exhibit 65: Chart on Europe - Year-over-year growth 2023-2028 (%)
      • Exhibit 66: Data Table on Europe - Year-over-year growth 2023-2028 (%)
    • 9.4 APAC - Market size and forecast 2023-2028
      • Exhibit 67: Chart on APAC - Market size and forecast 2023-2028 ($ million)
      • Exhibit 68: Data Table on APAC - Market size and forecast 2023-2028 ($ million)
      • Exhibit 69: Chart on APAC - Year-over-year growth 2023-2028 (%)
      • Exhibit 70: Data Table on APAC - Year-over-year growth 2023-2028 (%)
    • 9.5 North America - Market size and forecast 2023-2028
      • Exhibit 71: Chart on North America - Market size and forecast 2023-2028 ($ million)
      • Exhibit 72: Data Table on North America - Market size and forecast 2023-2028 ($ million)
      • Exhibit 73: Chart on North America - Year-over-year growth 2023-2028 (%)
      • Exhibit 74: Data Table on North America - Year-over-year growth 2023-2028 (%)
    • 9.6 Middle East and Africa - Market size and forecast 2023-2028
      • Exhibit 75: Chart on Middle East and Africa - Market size and forecast 2023-2028 ($ million)
      • Exhibit 76: Data Table on Middle East and Africa - Market size and forecast 2023-2028 ($ million)
      • Exhibit 77: Chart on Middle East and Africa - Year-over-year growth 2023-2028 (%)
      • Exhibit 78: Data Table on Middle East and Africa - Year-over-year growth 2023-2028 (%)
    • 9.7 South America - Market size and forecast 2023-2028
      • Exhibit 79: Chart on South America - Market size and forecast 2023-2028 ($ million)
      • Exhibit 80: Data Table on South America - Market size and forecast 2023-2028 ($ million)
      • Exhibit 81: Chart on South America - Year-over-year growth 2023-2028 (%)
      • Exhibit 82: Data Table on South America - Year-over-year growth 2023-2028 (%)
    • 9.8 US - Market size and forecast 2023-2028
      • Exhibit 83: Chart on US - Market size and forecast 2023-2028 ($ million)
      • Exhibit 84: Data Table on US - Market size and forecast 2023-2028 ($ million)
      • Exhibit 85: Chart on US - Year-over-year growth 2023-2028 (%)
      • Exhibit 86: Data Table on US - Year-over-year growth 2023-2028 (%)
    • 9.9 Italy - Market size and forecast 2023-2028
      • Exhibit 87: Chart on Italy - Market size and forecast 2023-2028 ($ million)
      • Exhibit 88: Data Table on Italy - Market size and forecast 2023-2028 ($ million)
      • Exhibit 89: Chart on Italy - Year-over-year growth 2023-2028 (%)
      • Exhibit 90: Data Table on Italy - Year-over-year growth 2023-2028 (%)
    • 9.10 Germany - Market size and forecast 2023-2028
      • Exhibit 91: Chart on Germany - Market size and forecast 2023-2028 ($ million)
      • Exhibit 92: Data Table on Germany - Market size and forecast 2023-2028 ($ million)
      • Exhibit 93: Chart on Germany - Year-over-year growth 2023-2028 (%)
      • Exhibit 94: Data Table on Germany - Year-over-year growth 2023-2028 (%)
    • 9.11 France - Market size and forecast 2023-2028
      • Exhibit 95: Chart on France - Market size and forecast 2023-2028 ($ million)
      • Exhibit 96: Data Table on France - Market size and forecast 2023-2028 ($ million)
      • Exhibit 97: Chart on France - Year-over-year growth 2023-2028 (%)
      • Exhibit 98: Data Table on France - Year-over-year growth 2023-2028 (%)
    • 9.12 China - Market size and forecast 2023-2028
      • Exhibit 99: Chart on China - Market size and forecast 2023-2028 ($ million)
      • Exhibit 100: Data Table on China - Market size and forecast 2023-2028 ($ million)
      • Exhibit 101: Chart on China - Year-over-year growth 2023-2028 (%)
      • Exhibit 102: Data Table on China - Year-over-year growth 2023-2028 (%)
    • 9.13 Market opportunity by geography
      • Exhibit 103: Market opportunity by geography ($ million)
      • Exhibit 104: Data Tables on Market opportunity by geography ($ million)
    • 9.14 US - Market size and forecast (2023-2028)
      • Chart on US - Market size and forecast (2023-2028) ($ million)
      • Data Table on US - Market size and forecast (2023-2028) ($ million)
      • Chart on US - Year-over-year growth (2023-2028) (%)
      • Data Table on US - Year-over-year growth (2023-2028) (%)
    • 9.15 Malaysia - Market size and forecast (2023-2028)
      • Chart on Malaysia - Market size and forecast (2023-2028) ($ million)
      • Data Table on Malaysia - Market size and forecast (2023-2028) ($ million)
      • Chart on Malaysia - Year-over-year growth (2023-2028) (%)
      • Data Table on Malaysia - Year-over-year growth (2023-2028) (%)
    • 9.16 Indonesia - Market size and forecast (2023-2028)
      • Chart on Indonesia - Market size and forecast (2023-2028) ($ million)
      • Data Table on Indonesia - Market size and forecast (2023-2028) ($ million)
      • Chart on Indonesia - Year-over-year growth (2023-2028) (%)
      • Data Table on Indonesia - Year-over-year growth (2023-2028) (%)
    • 9.17 UK - Market size and forecast (2023-2028)
      • Chart on UK - Market size and forecast (2023-2028) ($ million)
      • Data Table on UK - Market size and forecast (2023-2028) ($ million)
      • Chart on UK - Year-over-year growth (2023-2028) (%)
      • Data Table on UK - Year-over-year growth (2023-2028) (%)
    • 9.18 South Korea - Market size and forecast (2023-2028)
      • Chart on South Korea - Market size and forecast (2023-2028) ($ million)
      • Data Table on South Korea - Market size and forecast (2023-2028) ($ million)
      • Chart on South Korea - Year-over-year growth (2023-2028) (%)
      • Data Table on South Korea - Year-over-year growth (2023-2028) (%)
    • 9.19 Canada - Market size and forecast (2023-2028)
      • Chart on Canada - Market size and forecast (2023-2028) ($ million)
      • Data Table on Canada - Market size and forecast (2023-2028) ($ million)
      • Chart on Canada - Year-over-year growth (2023-2028) (%)
      • Data Table on Canada - Year-over-year growth (2023-2028) (%)
    • 9.20 Brazil - Market size and forecast (2023-2028)
      • Chart on Brazil - Market size and forecast (2023-2028) ($ million)
      • Data Table on Brazil - Market size and forecast (2023-2028) ($ million)
      • Chart on Brazil - Year-over-year growth (2023-2028) (%)
      • Data Table on Brazil - Year-over-year growth (2023-2028) (%)
    • 9.21 Thailand - Market size and forecast (2023-2028)
      • Chart on Thailand - Market size and forecast (2023-2028) ($ million)
      • Data Table on Thailand - Market size and forecast (2023-2028) ($ million)
      • Chart on Thailand - Year-over-year growth (2023-2028) (%)
      • Data Table on Thailand - Year-over-year growth (2023-2028) (%)
    • 9.22 UAE - Market size and forecast (2023-2028)
      • Chart on UAE - Market size and forecast (2023-2028) ($ million)
      • Data Table on UAE - Market size and forecast (2023-2028) ($ million)
      • Chart on UAE - Year-over-year growth (2023-2028) (%)
      • Data Table on UAE - Year-over-year growth (2023-2028) (%)
    • 9.23 Mexico - Market size and forecast (2023-2028)
      • Chart on Mexico - Market size and forecast (2023-2028) ($ million)
      • Data Table on Mexico - Market size and forecast (2023-2028) ($ million)
      • Chart on Mexico - Year-over-year growth (2023-2028) (%)
      • Data Table on Mexico - Year-over-year growth (2023-2028) (%)
    • 9.24 Japan - Market size and forecast (2023-2028)
      • Chart on Japan - Market size and forecast (2023-2028) ($ million)
      • Data Table on Japan - Market size and forecast (2023-2028) ($ million)
      • Chart on Japan - Year-over-year growth (2023-2028) (%)
      • Data Table on Japan - Year-over-year growth (2023-2028) (%)
    • 9.25 India - Market size and forecast (2023-2028)
      • Chart on India - Market size and forecast (2023-2028) ($ million)
      • Data Table on India - Market size and forecast (2023-2028) ($ million)
      • Chart on India - Year-over-year growth (2023-2028) (%)
      • Data Table on India - Year-over-year growth (2023-2028) (%)
    • 9.26 Rest of World (ROW) - Market size and forecast (2023-2028)
      • Chart on Rest of World (ROW) - Market size and forecast (2023-2028) ($ million)
      • Data Table on Rest of World (ROW) - Market size and forecast (2023-2028) ($ million)
      • Chart on Rest of World (ROW) - Year-over-year growth (2023-2028) (%)
      • Data Table on Rest of World (ROW) - Year-over-year growth (2023-2028) (%)

    10 Drivers, Challenges, and Trends

    • 10.1 Market drivers
      • 10.2 Market challenges
        • 10.3 Impact of drivers and challenges
          • Exhibit 105: Impact of drivers and challenges in 2023 and 2028
        • 10.4 Market trends

          11 Vendor Landscape

          • 11.1 Overview
            • 11.2 Vendor landscape
              • Exhibit 106: Overview on Criticality of inputs and Factors of differentiation
            • 11.3 Landscape disruption
              • Exhibit 107: Overview on factors of disruption
            • 11.4 Industry risks
              • Exhibit 108: Impact of key risks on business

            12 Vendor Analysis

            • 12.1 Vendors covered
              • Exhibit 109: Vendors covered
            • 12.2 Market positioning of vendors
              • Exhibit 110: Matrix on vendor position and classification
            • 12.3 Aadvik Foods and Products Pvt. Ltd.
              • Exhibit 111: Aadvik Foods and Products Pvt. Ltd. - Overview
              • Exhibit 112: Aadvik Foods and Products Pvt. Ltd. - Product / Service
              • Exhibit 113: Aadvik Foods and Products Pvt. Ltd. - Key offerings
            • 12.4 Asinus Atlanticus SA
              • Exhibit 114: Asinus Atlanticus SA - Overview
              • Exhibit 115: Asinus Atlanticus SA - Product / Service
              • Exhibit 116: Asinus Atlanticus SA - Key offerings
            • 12.5 AZIENDA AGRICOLA MONTEBADUCCO
              • Exhibit 117: AZIENDA AGRICOLA MONTEBADUCCO - Overview
              • Exhibit 118: AZIENDA AGRICOLA MONTEBADUCCO - Product / Service
              • Exhibit 119: AZIENDA AGRICOLA MONTEBADUCCO - Key offerings
            • 12.6 Dolphin IBA Nutricosmetics and Cosmeceuticals Pvt Ltd.
              • Exhibit 120: Dolphin IBA Nutricosmetics and Cosmeceuticals Pvt Ltd. - Overview
              • Exhibit 121: Dolphin IBA Nutricosmetics and Cosmeceuticals Pvt Ltd. - Product / Service
              • Exhibit 122: Dolphin IBA Nutricosmetics and Cosmeceuticals Pvt Ltd. - Key offerings
            • 12.7 Donna Tina Co.
              • Exhibit 123: Donna Tina Co. - Overview
              • Exhibit 124: Donna Tina Co. - Product / Service
              • Exhibit 125: Donna Tina Co. - Key offerings
            • 12.8 Dulcededonke
              • Exhibit 126: Dulcededonke  - Overview
              • Exhibit 127: Dulcededonke  - Product / Service
              • Exhibit 128: Dulcededonke  - Key offerings
            • 12.9 Eurolactis Group SA
              • Exhibit 129: Eurolactis Group SA - Overview
              • Exhibit 130: Eurolactis Group SA - Product / Service
              • Exhibit 131: Eurolactis Group SA - Key offerings
            • 12.10 Golden Donkeys Farm
              • Exhibit 132: Golden Donkeys Farm - Overview
              • Exhibit 133: Golden Donkeys Farm - Product / Service
              • Exhibit 134: Golden Donkeys Farm - Key offerings
            • 12.11 J M JADEJA DONKEY FARM
              • Exhibit 135: J M JADEJA DONKEY FARM - Overview
              • Exhibit 136: J M JADEJA DONKEY FARM - Product / Service
              • Exhibit 137: J M JADEJA DONKEY FARM - Key offerings
            • 12.12 JSR Donkey Farm
              • Exhibit 138: JSR Donkey Farm - Overview
              • Exhibit 139: JSR Donkey Farm - Product / Service
              • Exhibit 140: JSR Donkey Farm - Key offerings
            • 12.13 Kalyani Farm House
              • Exhibit 141: Kalyani Farm House - Overview
              • Exhibit 142: Kalyani Farm House - Product / Service
              • Exhibit 143: Kalyani Farm House - Key offerings
            • 12.14 RJ Donkey Farm
              • Exhibit 144: RJ Donkey Farm - Overview
              • Exhibit 145: RJ Donkey Farm - Product / Service
              • Exhibit 146: RJ Donkey Farm - Key offerings
            • 12.15 Shri Aarogyam Donkey Milk
              • Exhibit 147: Shri Aarogyam Donkey Milk - Overview
              • Exhibit 148: Shri Aarogyam Donkey Milk - Product / Service
              • Exhibit 149: Shri Aarogyam Donkey Milk - Key offerings
            • 12.16 TDS Donkey Farm
              • Exhibit 150: TDS Donkey Farm - Overview
              • Exhibit 151: TDS Donkey Farm - Product / Service
              • Exhibit 152: TDS Donkey Farm - Key offerings
            • 12.17 The Donkey Dairy Pty Ltd.
              • Exhibit 153: The Donkey Dairy Pty Ltd. - Overview
              • Exhibit 154: The Donkey Dairy Pty Ltd. - Product / Service
              • Exhibit 155: The Donkey Dairy Pty Ltd. - Key offerings

            13 Appendix

            • 13.1 Scope of the report
              • 13.2 Inclusions and exclusions checklist
                • Exhibit 156: Inclusions checklist
                • Exhibit 157: Exclusions checklist
              • 13.3 Currency conversion rates for US$
                • Exhibit 158: Currency conversion rates for US$
              • 13.4 Research methodology
                • Exhibit 159: Research methodology
                • Exhibit 160: Validation techniques employed for market sizing
                • Exhibit 161: Information sources
              • 13.5 List of abbreviations
                • Exhibit 162: List of abbreviations

              Research Methodology

              Technavio presents a detailed picture of the market by way of study, synthesis, and summation of data from multiple sources. The analysts have presented the various facets of the market with a particular focus on identifying the key industry influencers. The data thus presented is comprehensive, reliable, and the result of extensive research, both primary and secondary.

              INFORMATION SOURCES

              Primary sources

              • Manufacturers and suppliers
              • Channel partners
              • Industry experts
              • Strategic decision makers

              Secondary sources

              • Industry journals and periodicals
              • Government data
              • Financial reports of key industry players
              • Historical data
              • Press releases

              DATA ANALYSIS

              Data Synthesis

              • Collation of data
              • Estimation of key figures
              • Analysis of derived insights

              Data Validation

              • Triangulation with data models
              • Reference against proprietary databases
              • Corroboration with industry experts

              REPORT WRITING

              Qualitative

              • Market drivers
              • Market challenges
              • Market trends
              • Five forces analysis

              Quantitative

              • Market size and forecast
              • Market segmentation
              • Geographical insights
              • Competitive landscape

              Interested in this report?

              Get your sample now to see our research methodology and insights!

              Download Now

              Frequently Asked Questions

              Donkey Milk market growth will increase by $ 20.16 mn during 2024-2028 .

              The Donkey Milk market is expected to grow at a CAGR of 9.64% during 2024-2028 .

              Donkey Milk market is segmented by Application( Cosmetics and personal care, Food and beverages, Food, beverages) Product Type( Powder, Liquid, APAC, Middle East and Africa, South America)

              Aadvik Foods and Products Pvt. Ltd., Asinus Atlanticus SA, AZIENDA AGRICOLA MONTEBADUCCO, Chowdeswari Dairy Farm, Dolphin IBA Nutricosmetics and Cosmeceuticals Pvt Ltd., Donna Tina Co., Dulcededonke , Eurolactis Group SA, Golden Donkeys Farm, J M JADEJA DONKEY FARM, JSR Donkey Farm, Kalyani Farm House, Mahadev Donkey Milk Dairy, RJ Donkey Farm, Shri Aarogyam Donkey Milk, SRI. SHANTHI TYRES, TDS Donkey Farm, The Donkey Dairy Pty Ltd., VedaOils, YESRAJ AGRO EXPORTS PVT. LTD are a few of the key vendors in the Donkey Milk market.

              Europe will register the highest growth rate of 39% among the other regions. Therefore, the Donkey Milk market in Europe is expected to garner significant business opportunities for the vendors during the forecast period.

              US, Malaysia, Indonesia, Germany, UK, South Korea, France, Canada, Brazil, Thailand, UAE, Mexico, China, Japan, India

              • Growing demand for sugar-free and organic donkey milk productsAt present is the driving factor this market.
              • obesity has become a common issue among the global population. A large portion of the population around the globe is overweight and obese. With the increasing obesity rates across the world is the driving factor this market.
              • most end-consumers are inclined toward buying sugar-free products. This presents an opportunity for donkey milk vendors to introduce sugar-free donkey milk products in their portfolio to increase their consumer base. Thus is the driving factor this market.
              • many vendors are currently offering sugar-free donkey milk products to meet the growing consumer demands. With the growing trend of sugar-free products and rising health consciousness among consumers is the driving factor this market.
              • many vendors are expected to develop sugar-free donkey milk products during the forecast period. With the growing awareness of the negative impacts of synthetic products on health and the environment is the driving factor this market.
              • most health-conscious and informed consumers have started using organic products. This also applies to donkey milk. Organic beverages are healthy and becoming popular in the market as consumers gradually show increased concern over the quality and origin of the ingredients used in their beverages. With the current changes in the preferences of end-consumers is the driving factor this market.
              • market vendors are coming up with more varieties of organic donkey milk to gain more health-conscious consumers. Small-scale organic donkey milk producers require considerable guidance to achieve organic certification. However is the driving factor this market.
              • they can gain additional income from the premium price of organic donkey milk. This is especially favorable if the organic donkey milk is exported to the markets in South America and MEA is the driving factor this market.
              • which do not have local brands offering donkey milk and largely rely on imports of these products. Such trends are likely to continue during the forecast period as consumers in these regions have become more informed and concerned about their food choices. Thus is the driving factor this market.
              • the growing consumer demand for sugar-free and organic donkey milk will propel the growth of the global donkey milk market during the forecast period. is the driving factor this market.

              The Donkey Milk market vendors should focus on grabbing business opportunities from the Cosmetics and personal care segment as it accounted for the largest market share in the base year.