
Drilling Data Management Systems Market Size 2025-2029
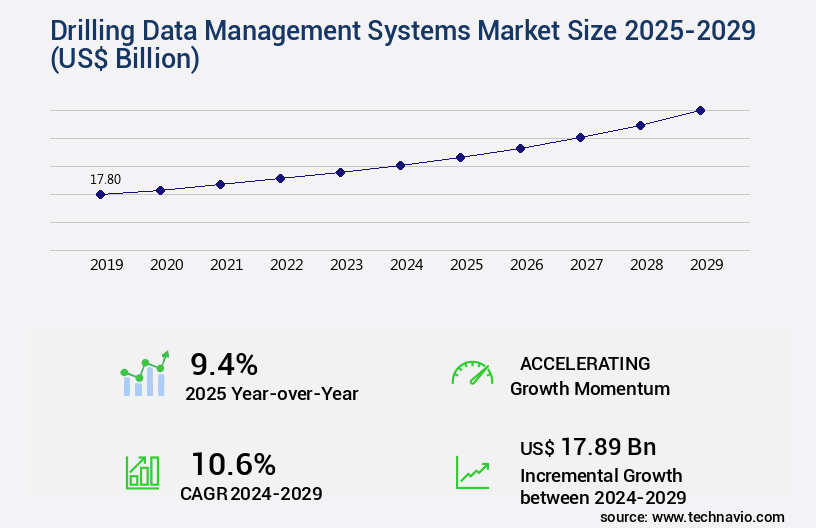
The drilling data management systems market size is valued to increase USD 17.89 billion, at a CAGR of 10.6% from 2024 to 2029. Drilling data management system to improve productivity and transparency will drive the drilling data management systems market.
Major Market Trends & Insights
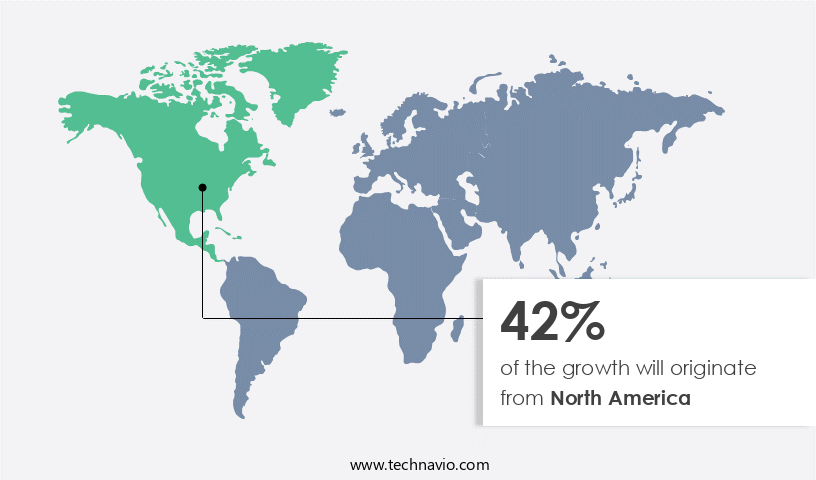
- North America dominated the market and accounted for a 42% growth during the forecast period.
- By Component - Services segment was valued at USD 9.65 billion in 2023
- By Application - Oil and gas segment accounted for the largest market revenue share in 2023
Market Size & Forecast
- Market Opportunities: USD 153.27 billion
- Market Future Opportunities: USD 17.89 billion
- CAGR from 2024 to 2029 : 10.6%
Market Summary
- Drilling data management systems have emerged as essential tools for oil and gas companies seeking to optimize productivity and ensure transparency in their operations. With the advent of big data analytics, these systems have gained increasing importance, enabling organizations to process vast amounts of data generated during drilling operations in real-time. The market is expected to reach significant value by 2025, driven by factors such as the growing demand for real-time data analysis, the increasing complexity of drilling operations, and the need to enhance operational efficiency. These systems facilitate seamless data collection, processing, and analysis, allowing companies to make informed decisions and respond promptly to changing drilling conditions.
- Fluctuations in crude oil prices have intensified the focus on optimizing drilling operations and reducing costs. Drilling data management systems help achieve this goal by providing real-time insights into drilling performance, enabling predictive maintenance, and reducing downtime. Additionally, they facilitate collaboration between teams and stakeholders, ensuring effective communication and coordination. The integration of advanced technologies such as IoT sensors, machine learning, and artificial intelligence further enhances the functionality of drilling data management systems. These technologies enable predictive analytics, automated decision-making, and real-time performance monitoring, contributing to improved operational efficiency and cost savings. Despite their numerous benefits, drilling data management systems face challenges such as data security and privacy concerns, complex integration with existing systems, and the need for standardization.
- Addressing these challenges will be crucial for the continued growth and adoption of drilling data management systems in the oil and gas industry.
What will be the Size of the Drilling Data Management Systems Market during the forecast period?
Get Key Insights on Market Forecast (PDF) Request Free Sample
How is the Drilling Data Management Systems Market Segmented ?
The drilling data management systems industry research report provides comprehensive data (region-wise segment analysis), with forecasts and estimates in "USD billion" for the period 2025-2029, as well as historical data from 2019-2023 for the following segments.
- Component
- Services
- Software
- Hardware
- Application
- Oil and gas
- Energy and power
- Type
- Onshore
- Offshore
- Geography
- North America
- US
- Canada
- Mexico
- Europe
- Norway
- Russia
- UK
- Middle East and Africa
- UAE
- APAC
- Australia
- South America
- Brazil
- Rest of World (ROW)
- North America
By Component Insights
The services segment is estimated to witness significant growth during the forecast period.
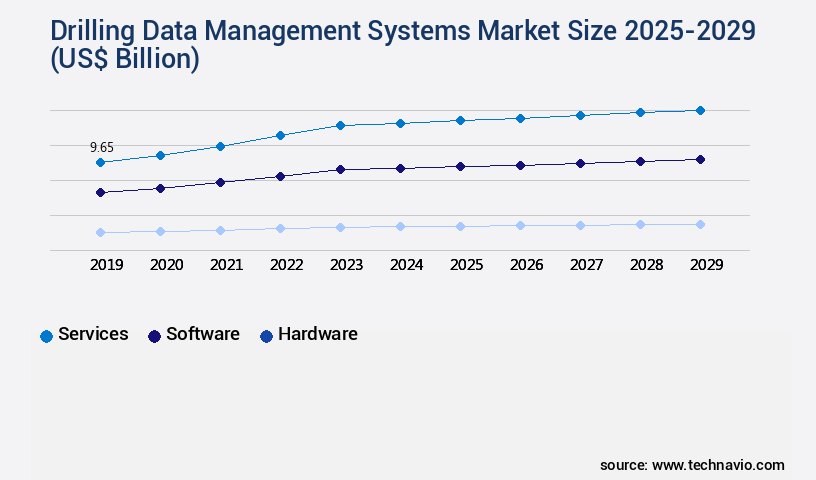
The market is experiencing dynamic growth, fueled by the escalating need for advanced data handling solutions across multiple industries. With the generation of massive data volumes, organizations demand efficient, adaptable, and scalable data management systems. The services sector within this market encompasses a spectrum of activities, including sensor installation, equipment maintenance, consultation, and data analytics, all integral to various drilling stages. The market's expansion is influenced by emerging technologies like vertical drilling and Enhanced Oil Recovery (EOR), which streamline drilling processes and optimize oil extraction. According to a recent study, the services segment is projected to account for over 50% of the market share by 2025.
Technological advancements in data integration software, geophysical data management, wellsite data transfer, software-defined networking, data analytics platforms, and data visualization tools are transforming drilling operations. Additionally, investments in data compression algorithms, mud logging data, predictive drilling models, wellbore surveying data, data security protocols, data error correction, petrophysical data analysis, remote data access, well trajectory tracking, automated reporting systems, cloud-based data storage, hydraulics optimization, data validation techniques, downhole sensor integration, data acquisition systems, edge computing technologies, directional drilling data, data quality control, real-time data processing, formation evaluation data, drilling parameters monitoring, drilling optimization algorithms, and data redundancy management are shaping the future of drilling data management systems.
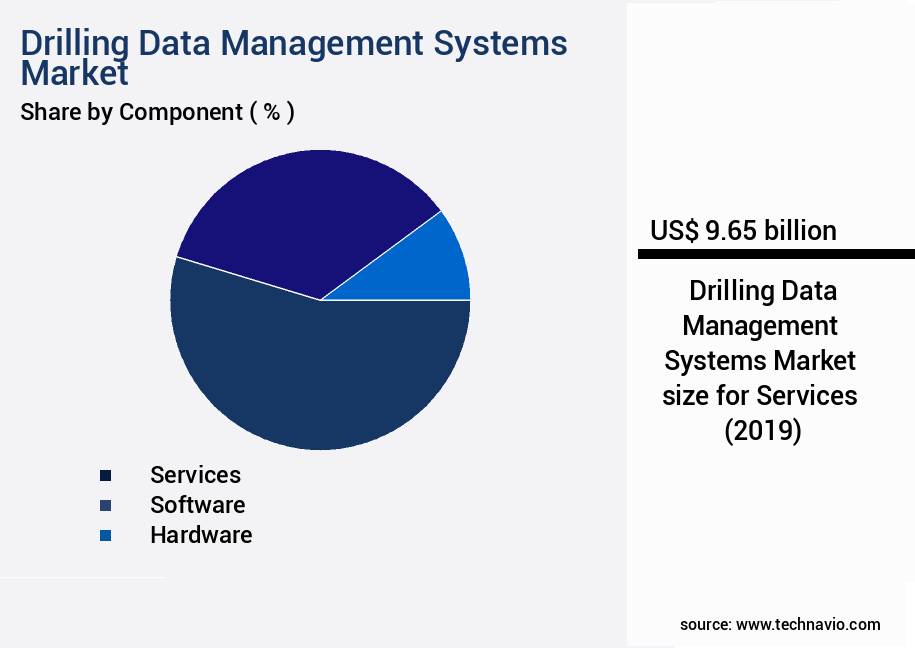
The Services segment was valued at USD 9.65 billion in 2019 and showed a gradual increase during the forecast period.
Regional Analysis
North America is estimated to contribute 42% to the growth of the global market during the forecast period.Technavio’s analysts have elaborately explained the regional trends and drivers that shape the market during the forecast period.
See How Drilling Data Management Systems Market Demand is Rising in North America Request Free Sample
The market in North America is primarily driven by the major revenue-contributing countries, the US and Canada. These countries are the top oil-producing nations in the region, with abundant oil resources. The shale revolution in the US has significantly impacted the oil production of the region, enabling oil companies to maintain profitability even with low oil prices. This revolution has had a substantial influence on the upstream oil and gas industry, leading to the commercialization of hydraulic fracturing technology and the entry of numerous small and independent energy players.
Consequently, drilling activities in the region have seen a considerable surge, propelling the growth of the market.
Market Dynamics
Our researchers analyzed the data with 2024 as the base year, along with the key drivers, trends, and challenges. A holistic analysis of drivers will help companies refine their marketing strategies to gain a competitive advantage.
The market is experiencing significant growth due to the increasing demand for automated data acquisition and real-time visualization of drilling parameters. These systems enable wellbore stability analysis, drilling optimization models, and reservoir characterization workflows by integrating data from various sources. Cloud-based storage solutions offer advantages such as data security, accessibility, and scalability, making them a popular choice for drilling companies. Predictive maintenance and performance monitoring of drilling equipment are crucial aspects of these systems. Real-time data transmission from sensor networks and downhole calibration procedures ensure data accuracy and reliability. Data compression techniques and data redundancy management with fault tolerance enhance data transfer and improve decision-making in high-speed drilling operations. Data security best practices implementation, including advanced data analytics and encryption, are essential to protect sensitive drilling information. Software-defined networking improves data connectivity, while data error correction techniques ensure accuracy and consistency. Automated reporting systems provide drilling performance metrics, enabling continuous optimization and improvement. Remote data access with secure protocols and data lifecycle management strategies are vital for efficient drilling operations. Regulatory compliance is ensured through these systems, ensuring adherence to industry standards and regulations. Overall, drilling data management systems offer significant benefits in terms of operational efficiency, equipment performance, and data security, making them an indispensable tool for drilling companies.
What are the key market drivers leading to the rise in the adoption of Drilling Data Management Systems Industry?
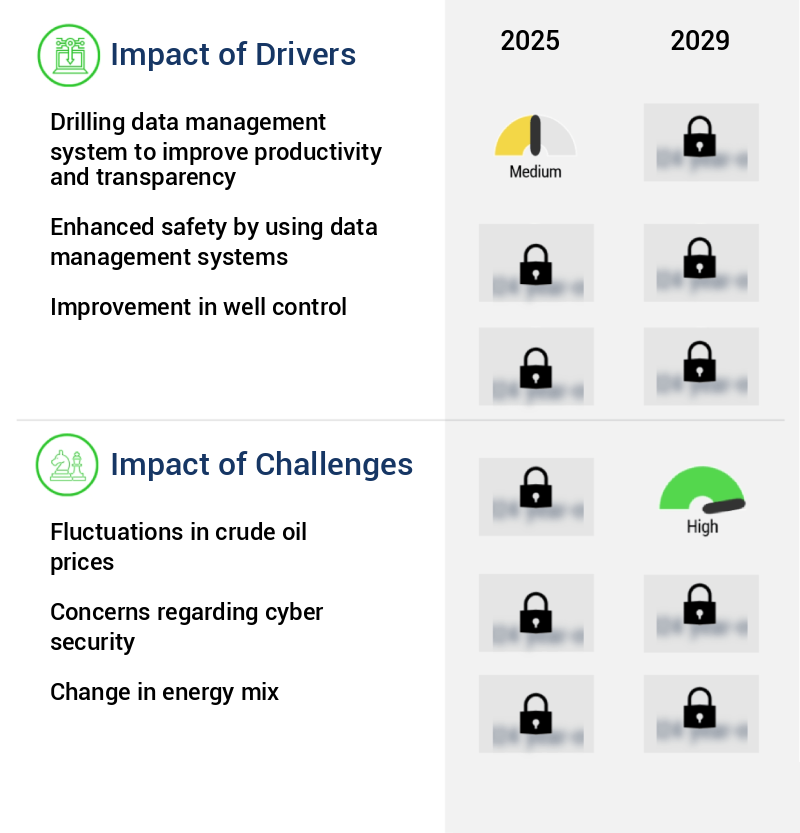
- The implementation of advanced drilling data management systems is a crucial factor in enhancing productivity and promoting transparency within the market, driving its growth.
- Drilling Data Management Systems (DDMS) have gained significant traction in the oil and gas industry due to their ability to enhance productivity and transparency in drilling operations. These systems enable companies to collect, manage, and analyze real-time data related to drilling processes. By utilizing DDMS, drilling firms can optimize their operations by identifying inefficiencies and reducing drilling time and costs. Additionally, DDMS offers transparency, granting stakeholders access to real-time information on drilling performance, parameters, and costs.
- The implementation of DDMS contributes to increased drilling efficiency and overall productivity in Exploration and Production (E and P) operations.
What are the market trends shaping the Drilling Data Management Systems Industry?
- The arrival of big data analytics is mandated as the upcoming market trend. Big data analytics is set to be the mandatory market trend.
- The drilling data management system market is experiencing significant growth in response to the challenges faced by the oil and gas industry. Issues such as the depletion of oil wells, the need for information on new drilling locations, and the requirement to minimize pollution and comply with regulations are driving the adoption of advanced technologies in drilling data management. As a result, an enormous volume of data is generated, presenting opportunities for transformation. Oil companies can leverage big data analytics to gain real-time insights and analyze historical data and trends to make informed decisions and forecast future predictions. According to recent estimates, the drilling data management market is projected to expand at a substantial rate, with the number of applications extending beyond the oil and gas sector to include mining, construction, and utilities.
- Effective utilization of drilling data can lead to improved operational efficiency, reduced costs, and enhanced safety measures.
What challenges does the Drilling Data Management Systems Industry face during its growth?
- The volatility of crude oil prices poses a significant challenge to the growth of the industry.
- The oil and gas industry faces a complex terrain influenced by geopolitical factors, economic shifts, and technological advancements. In 2024, the industry is projected to maintain a robust financial position, bolstered by high oil prices that foster investments and dividends. The global upstream sector is estimated to preserve its 2023 hydrocarbon investment level of approximately USD580 billion, generating over USD800 billion in free cash flow. Pivotal trends shaping the industry include capital allocation efficiency, clean energy policies, escalating geopolitical tensions, and investments in low-carbon technology projects. Crude oil price fluctuations significantly impact the global drilling data management system market.
- This market plays a crucial role in facilitating data-driven decision-making for oil and gas companies, enabling them to optimize operations, reduce costs, and enhance overall performance. The system's applications extend beyond the oil and gas sector, with industries like mining, power, and water utilities also reaping benefits from advanced data management solutions.
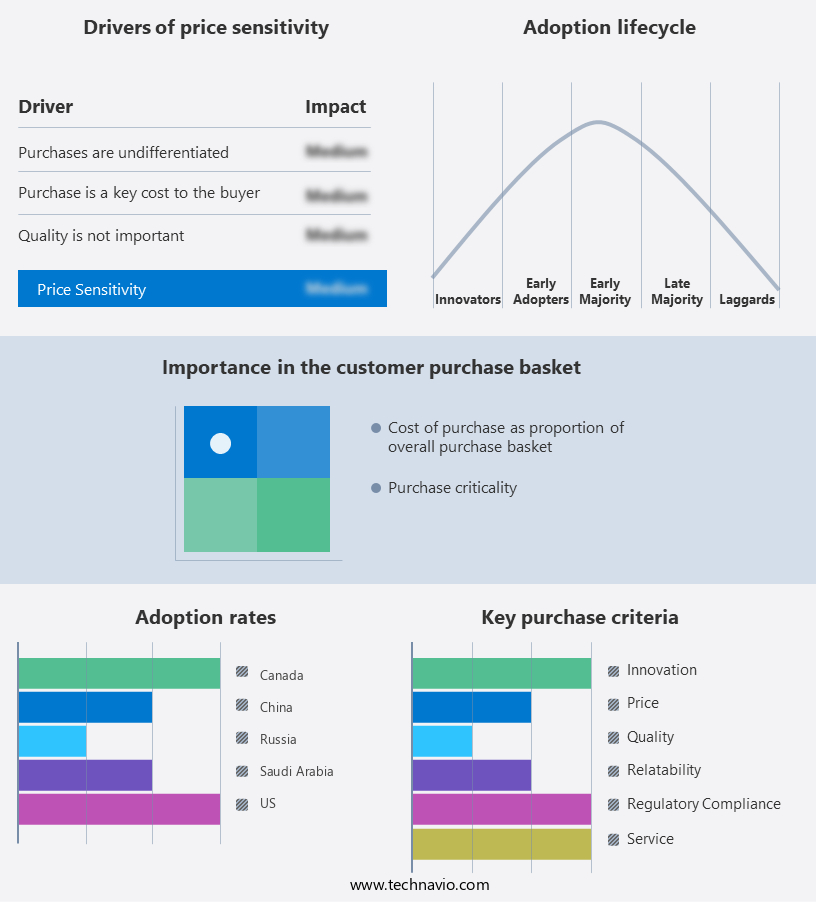
Exclusive Technavio Analysis on Customer Landscape
The drilling data management systems market forecasting report includes the adoption lifecycle of the market, covering from the innovator’s stage to the laggard’s stage. It focuses on adoption rates in different regions based on penetration. Furthermore, the drilling data management systems market report also includes key purchase criteria and drivers of price sensitivity to help companies evaluate and develop their market growth analysis strategies.
Customer Landscape of Drilling Data Management Systems Industry
Competitive Landscape
Companies are implementing various strategies, such as strategic alliances, drilling data management systems market forecast, partnerships, mergers and acquisitions, geographical expansion, and product/service launches, to enhance their presence in the industry.
Accenture PLC - Saipem, a global leader in oil and gas engineering and construction, utilizes the Company's Construction Data Management Solution. This innovative technology streamlines project management, enhancing efficiency and accuracy in the complex construction process. The solution's advanced features facilitate seamless data exchange, enabling real-time progress tracking and informed decision-making.
The industry research and growth report includes detailed analyses of the competitive landscape of the market and information about key companies, including:
- Accenture PLC
- Baker Hughes Co.
- Capgemini Services SAS
- Dell Technologies Inc.
- Halliburton Co.
- Honeywell International Inc.
- Infosys Ltd.
- International Business Machines Corp.
- NOV Inc.
- Oracle Corp.
- Pason Systems Inc.
- SAP SE
- SAS Institute Inc.
- Schlumberger Ltd.
- Tata Consultancy Services Ltd.
- Teradata Corp.
- Trackem
- Wipro Ltd.
Qualitative and quantitative analysis of companies has been conducted to help clients understand the wider business environment as well as the strengths and weaknesses of key industry players. Data is qualitatively analyzed to categorize companies as pure play, category-focused, industry-focused, and diversified; it is quantitatively analyzed to categorize companies as dominant, leading, strong, tentative, and weak.
Recent Development and News in Drilling Data Management Systems Market
- In January 2024, Schlumberger, a leading oilfield services company, launched its new Drilling Wise data management system, integrating artificial intelligence and machine learning capabilities to optimize drilling operations (Schlumberger press release). In March 2024, Halliburton and Baker Hughes, two major players in the drilling industry, announced a strategic collaboration to develop a joint drilling data management platform, aiming to enhance operational efficiency and reduce costs (Halliburton press release).
- In April 2025, Aker Solutions, a Norwegian engineering and technology company, acquired Drill-Quip's drilling systems business, strengthening its position in the drilling data management market and expanding its offering to include drilling equipment and services (Aker Solutions press release). In May 2025, the US Bureau of Safety and Environmental Enforcement (BSEE) introduced new regulations mandating the use of real-time drilling data reporting systems for offshore drilling operations, effective from 2026 (BSEE press release). These developments underscore the growing importance of advanced data management systems in the drilling industry, with significant investments in technology and strategic partnerships to meet evolving regulatory requirements.
Dive into Technavio’s robust research methodology, blending expert interviews, extensive data synthesis, and validated models for unparalleled Drilling Data Management Systems Market insights. See full methodology.
|
Market Scope |
|
|
Report Coverage |
Details |
|
Page number |
210 |
|
Base year |
2024 |
|
Historic period |
2019-2023 |
|
Forecast period |
2025-2029 |
|
Growth momentum & CAGR |
Accelerate at a CAGR of 10.6% |
|
Market growth 2025-2029 |
USD 17.89 billion |
|
Market structure |
Fragmented |
|
YoY growth 2024-2025(%) |
9.4 |
|
Key countries |
US, Canada, Norway, UK, Australia, Saudi Arabia, UAE, Mexico, Russia, and Brazil |
|
Competitive landscape |
Leading Companies, Market Positioning of Companies, Competitive Strategies, and Industry Risks |
Research Analyst Overview
- The market continues to evolve, driven by the increasing complexity of geophysical data and the need for real-time analysis and optimization in various sectors. Data integration software plays a crucial role in managing the influx of wellsite data, ensuring seamless transfer through software-defined networking. Geophysical data management systems employ data analytics platforms and reservoir simulation data to enhance exploration and production efficiency. Downhole sensor integration, mud logging data, and wellbore surveying data are essential components of drilling operations. Predictive drilling models and drilling parameters monitoring enable proactive decision-making, while data visualization tools facilitate effective communication among team members.
- Data compression algorithms and data validation techniques ensure data accuracy and security. Remote data access and real-time data processing are critical for efficient drilling operations. Cloud-based data storage and automated reporting systems streamline data management, allowing for quicker response times and improved decision-making. Hydraulics optimization and directional drilling data contribute to increased drilling efficiency and reduced costs. Industry growth in drilling data management systems is expected to reach 15% annually, driven by the increasing adoption of advanced technologies such as edge computing and data redundancy management. For instance, a leading oil and gas company reported a 20% increase in drilling efficiency by implementing real-time data processing and predictive drilling models.
- Data quality control and automated reporting systems further enhance operational efficiency and ensure regulatory compliance.
What are the Key Data Covered in this Drilling Data Management Systems Market Research and Growth Report?
-
What is the expected growth of the Drilling Data Management Systems Market between 2025 and 2029?
-
USD 17.89 billion, at a CAGR of 10.6%
-
-
What segmentation does the market report cover?
-
The report is segmented by Component (Services, Software, and Hardware), Application (Oil and gas and Energy and power), Geography (North America, Middle East and Africa, Europe, APAC, and South America), and Type (Onshore and Offshore)
-
-
Which regions are analyzed in the report?
-
North America, Middle East and Africa, Europe, APAC, and South America
-
-
What are the key growth drivers and market challenges?
-
Drilling data management system to improve productivity and transparency, Fluctuations in crude oil prices
-
-
Who are the major players in the Drilling Data Management Systems Market?
-
Accenture PLC, Baker Hughes Co., Capgemini Services SAS, Dell Technologies Inc., Halliburton Co., Honeywell International Inc., Infosys Ltd., International Business Machines Corp., NOV Inc., Oracle Corp., Pason Systems Inc., SAP SE, SAS Institute Inc., Schlumberger Ltd., Tata Consultancy Services Ltd., Teradata Corp., Trackem, and Wipro Ltd.
-
Market Research Insights
- The market for drilling data management systems is a continually evolving landscape, with ongoing advancements in technology driving innovation. Two key areas of focus include remote operations and production optimization. For instance, the integration of temperature sensors and real-time monitoring has led to significant improvements in drilling efficiency, resulting in a reported increase of up to 15% in well productivity. Furthermore, industry growth is anticipated to expand at a steady pace, with expectations of a 10% compound annual growth rate.
- These developments underscore the importance of robust data management systems, which enable the seamless organization and retrieval of critical drilling data, including pressure monitoring systems, sensor calibration methods, and mud flow monitoring data. Additionally, data lifecycle management, data version control, and data communication protocols are essential components of these systems, ensuring data consistency and accuracy throughout the drilling process.
We can help! Our analysts can customize this drilling data management systems market research report to meet your requirements.
 RIA -
RIA - 
