Drugs Of Abuse Testing Market Analysis, Size, and Forecast 2026-2030: North America (US, Canada, and Mexico), Europe (Germany, UK, and France), Asia (China, Japan, and India), South America (Brazil, Argentina, and Colombia), Middle East and Africa (Saudi Arabia, UAE, and Turkey), Rest of World (ROW)

Drugs Of Abuse Testing Market Analysis, Size, and Forecast 2026-2030:
North America (US, Canada, and Mexico), Europe (Germany, UK, and France), Asia (China, Japan, and India), South America (Brazil, Argentina, and Colombia), Middle East and Africa (Saudi Arabia, UAE, and Turkey), Rest of World (ROW)

Published: Oct 2026 309 Pages SKU: IRTNTR72972

Market Overview at a Glance

$1.26 B
Market Opportunity
4.9%
CAGR 2025 - 2030
31.5%
Europe Growth
$2.46 B
Instruments segment 2024

Drugs Of Abuse Testing Market Size 2026-2030

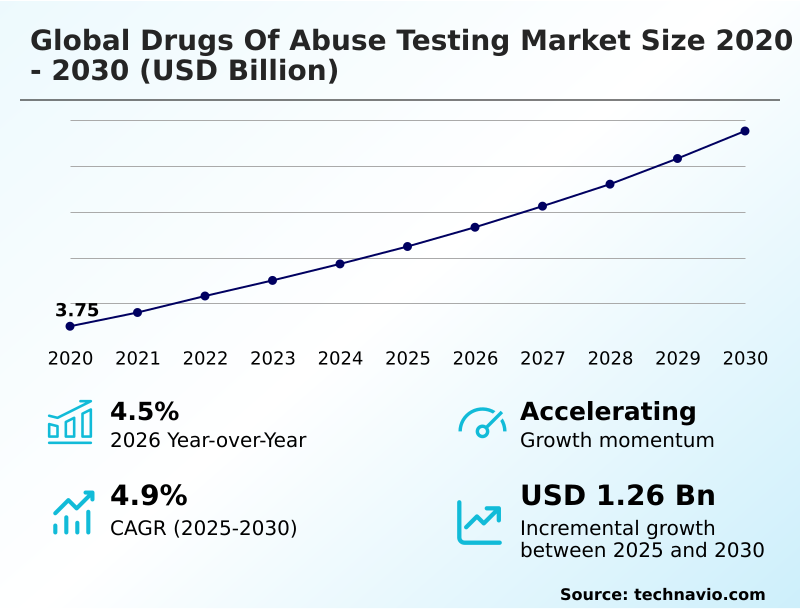
The drugs of abuse testing market size is valued to increase by USD 1.26 billion, at a CAGR of 4.9% from 2025 to 2030. Increasing workplace drug screening requirements across regulated industries will drive the drugs of abuse testing market.

Major Market Trends & Insights

  • Europe dominated the market and accounted for a 31.5% growth during the forecast period.
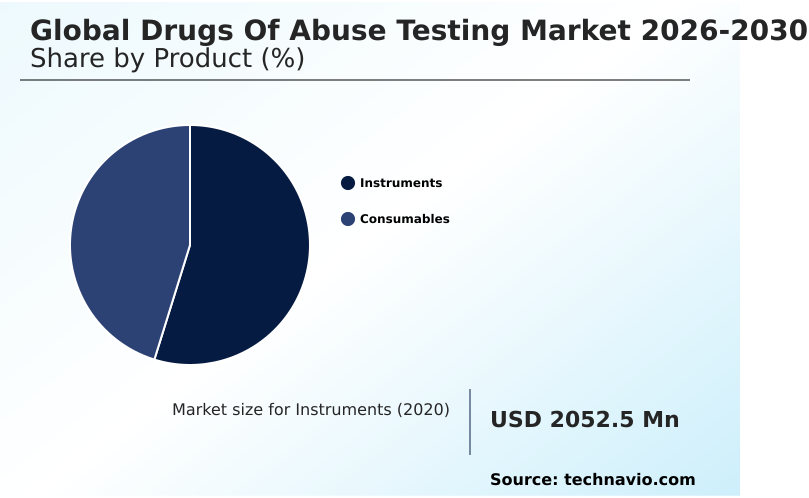
  • By Product - Instruments segment was valued at USD 2.46 billion in 2024
  • By End-user - Hospitals and clinics segment accounted for the largest market revenue share in 2024

Market Size & Forecast

  • Market Opportunities: USD 2.13 billion
  • Market Future Opportunities: USD 1.26 billion
  • CAGR from 2025 to 2030 : 4.9%

Market Summary

  • The Drugs Of Abuse Testing Market operates as a highly regulated sector driven by the necessity for accurate substance detection across clinical, forensic, and occupational environments. Expanding pre-employment assessment workflows heavily influence demand, as organizations continuously seek to mitigate risk and enforce strict safety protocols.
  • A prominent logistics provider recently overhauled its internal monitoring framework by deploying advanced oral fluid testing methodologies, which accelerated employee onboarding times by 20% compared to traditional collection methods. Increasing workplace drug screening requirements mandate consistent utilization of diagnostic resources, directly boosting test volumes across multiple industries.
  • Conversely, regulatory compliance complexity across multi-jurisdiction testing environments forces laboratories to constantly adjust their standard operating procedures, increasing administrative overhead. Variations in legal thresholds can delay test validation processes and strain regional testing capacity. By adopting standardized proficiency testing programs, laboratories can mitigate compliance risks and maintain operational continuity.
  • The ongoing modernization of toxicology infrastructure remains vital for ensuring rapid, legally defensible outcomes in substance misuse interventions and clinical diagnostics.

What will be the Size of the Drugs Of Abuse Testing Market during the forecast period?
Get Key Insights on Market Forecast (PDF) Get Free Sample

How is the Drugs Of Abuse Testing Market Segmented?

The drugs of abuse testing industry research report provides comprehensive data (region-wise segment analysis), with forecasts and estimates in "USD million" for the period 2026-2030, as well as historical data from 2020-2024 for the following segments.

  • Product
    • Instruments
    • Consumables
  • End-user
    • Hospitals and clinics
    • Diagnostic laboratories
    • Workplaces
    • Forensic laboratories
    • Others
  • Technology
    • Immunoassay
    • Chromatography
    • Mass spectrometry
    • Others
  • Geography
    • North America
      • US
      • Canada
      • Mexico
    • Europe
      • Germany
      • UK
      • France
      • Italy
      • Spain
      • The Netherlands
    • Asia
      • China
      • Japan
      • India
      • South Korea
      • Indonesia
      • Thailand
    • Rest of World (ROW)

By Product Insights

The instruments segment is estimated to witness significant growth during the forecast period.

The instruments segment dictates testing efficiency by standardizing procedures across laboratory networks. The evolving Drugs Of Abuse Testing Market relies on advancing automated toxicology instruments and automated chemistry analyzers to manage expanding sample volumes.

Laboratories adopting modern liquid chromatography-mass spectrometry platforms achieve testing throughput improvements of up to 45%. This shift occurs because complex polysubstance exposure analysis demands higher sensitivity, driving facilities to upgrade hardware for chromatography confirmatory testing.

Consequently, providers benefit from lower operational costs. Upgraded clinical diagnostic screening systems with advanced informatics capabilities minimize human error and accelerate turnaround times. High-throughput analytical platforms enable facilities to process 30% more samples daily.

Integrating precise measurement tools and non-invasive screening approaches ensures laboratories consistently meet evidentiary standard requirements.
Get Free Sample

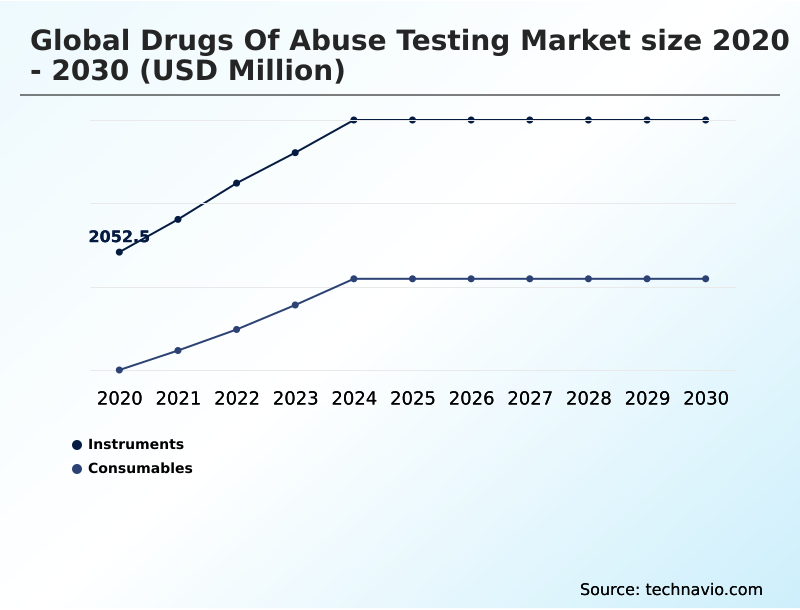
The Instruments segment was valued at USD 2.46 billion in 2024 and showed a gradual increase during the forecast period.
Get Free Sample

Regional Analysis

Europe is estimated to contribute 31.5% to the growth of the global market during the forecast period.Technavio’s analysts have elaborately explained the regional trends and drivers that shape the market during the forecast period.
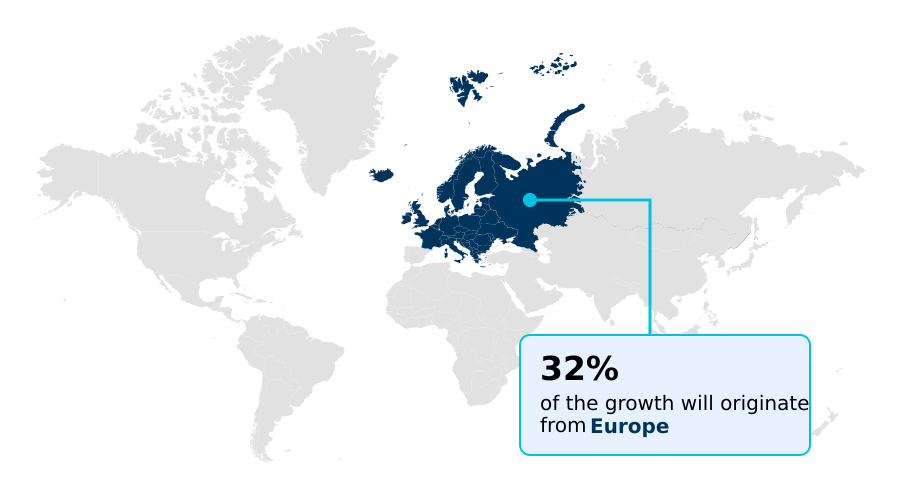
See How Drugs Of Abuse Testing Market Demand is Rising in Europe Get Free Sample

Regional infrastructure disparities dictate the adoption rate of advanced diagnostic systems. North America demonstrates a 35% higher utilization of mass spectrometry platforms compared to Europe, largely driven by aggressive overdose surveillance programs and comprehensive substance misuse surveillance.

This discrepancy exists because North American healthcare networks heavily subsidize integrated diagnostic systems to support rapid forensic toxicology applications and detailed postmortem toxicological evaluations.

Consequently, diagnostic laboratories in the United States process higher daily volumes at a 20% lower per-test operational cost.

Meanwhile, APAC regions are rapidly expanding their testing infrastructure through effective laboratory network integration, driving a 25% surge in the implementation of rapid diagnostic cassettes. By establishing unified procedures for rehabilitation monitoring activities, regional authorities improve clinical outcomes.

These structural variations compel testing providers to tailor their strategies, favoring high-throughput solutions in mature regions while prioritizing portable devices in emerging territories.

Market Dynamics

Our researchers analyzed the data with 2025 as the base year, along with the key drivers, trends, and challenges. A holistic analysis of drivers will help companies refine their marketing strategies to gain a competitive advantage.

  • The continuous modernization of the Drugs Of Abuse Testing Market is fundamentally reshaping how organizations approach risk management and clinical diagnostics. As illicit substance profiles become increasingly complex, laboratories are continuously evaluating the efficacy of immunoassay versus chromatography screening to optimize their operational workflows.
  • Transitioning to advanced testing protocols allows facilities to enhance detection specificity, thereby reducing the rate of false positives by approximately 18% compared to legacy screening methods. This strategic shift directly supports critical supply chain and workforce planning efforts by ensuring fewer operational disruptions.
  • The deployment of point of care drug testing enables immediate, actionable insights, particularly within rapid response clinical environments and distributed occupational health networks. Furthermore, stringent workplace compliance toxicology screening mandates require employers to implement standardized, reliable detection frameworks to minimize liability and improve overall workforce productivity.
  • To meet these demands, organizations are increasingly turning toward oral fluid detection methodologies, which streamline sample collection and cut processing bottlenecks by nearly 25% relative to traditional techniques. In legal and criminal justice settings, the reliance on mass spectrometry forensic confirmation remains absolute, ensuring that evidentiary findings withstand rigorous judicial scrutiny.
  • By integrating these specialized analytical approaches, diagnostic providers can align their service offerings with shifting regulatory standards while simultaneously driving down long-term administrative costs and reinforcing public safety protocols.
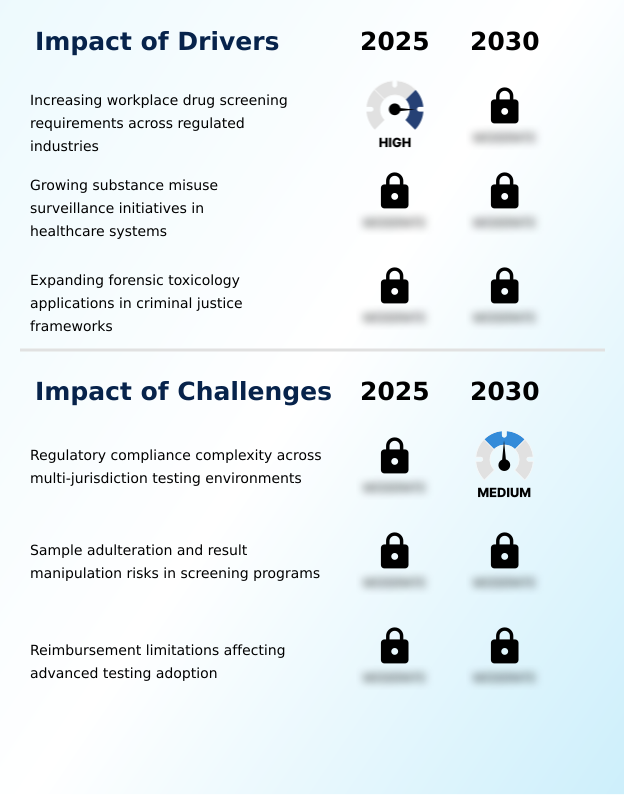
What are the key market drivers leading to the rise in the adoption of Drugs Of Abuse Testing Industry?

  • Increasing workplace drug screening requirements across regulated industries serves as the primary driver of market expansion.

  • Escalating regulatory mandates across safety-sensitive industries act as the primary catalyst for expanded diagnostic screening. The Drugs Of Abuse Testing Market is expanding rapidly as organizations reinforce their occupational health frameworks and workplace risk management protocols.
  • This surge is happening because employers face mounting legal liabilities, driving the integration of strict pre-employment assessment workflows and oral fluid testing methodologies.
  • As a direct result, organizations adopting systematic screening programs experience up to a 20% reduction in workplace incidents. The ongoing requirement for workplace safety compliance generates recurring demand for advanced specimen collection devices and testing services.
  • Furthermore, regular participation in proficiency testing programs and adherence to rigorous quality assurance protocols ensures that these testing efforts remain analytically robust.
  • This continuous demand cycle supports substance misuse interventions and routine emergency drug screening, strengthening laboratory revenues while optimizing corporate safety initiatives.

What are the market trends shaping the Drugs Of Abuse Testing Industry?

  • Advancing adoption of AI-enabled toxicology data interpretation platforms remains the prominent market trend.

  • The rapid transition toward intelligent diagnostic systems represents a fundamental shift in laboratory operations. The Drugs Of Abuse Testing Market is evolving as facilities integrate AI-driven platforms to streamline complex toxicology data interpretation and laboratory information management. This transformation is occurring because expanding test volumes overwhelm manual review capacities, prompting critical investments in digital laboratory workflows and cloud-based laboratory connectivity.
  • Consequently, testing facilities utilizing automated result analysis report a 25% improvement in overall diagnostic efficiency. High-throughput laboratories leveraging biochip array technology and a modern centrifugal drug analyzer can now identify patterns associated with synthetic opioid detection up to 30% faster. The implementation of these intelligent systems directly lowers administrative overhead and enhances clinical decision support.
  • By adopting advanced multiplex testing formats, diagnostic providers generate precise evidence-based toxicological findings, allowing laboratories to manage larger specimen loads effectively while maintaining strict performance metrics.

What challenges does the Drugs Of Abuse Testing Industry face during its growth?

  • Regulatory compliance complexity across multi-jurisdiction testing environments acts as a significant challenge affecting market growth.

  • Navigating fragmented regulatory frameworks creates substantial operational friction for multinational diagnostic providers. The Drugs Of Abuse Testing Market faces persistent limitations due to conflicting regulatory cutoff thresholds across different legal jurisdictions. This complexity arises because regional authorities mandate unique chain of custody procedures and specific diagnostic reference materials for validation.
  • Consequently, laboratories supporting therapeutic drug monitoring and blood toxicology testing endure a 15% increase in compliance-related administrative costs. The necessity to validate diverse immunoassay screening panels and reagent assay kits for local requirements slows down broader market penetration by approximately 12%.
  • Furthermore, the constant threat of sample subversion demands rigorous specimen validity testing alongside traditional hair follicle drug screening, which further lengthens standard turnaround times. These hurdles force providers of point-of-care screening systems to divert capital away from core innovation into localized administrative adaptation.

Exclusive Technavio Analysis on Customer Landscape

The drugs of abuse testing market forecasting report includes the adoption lifecycle of the market, covering from the innovator’s stage to the laggard’s stage. It focuses on adoption rates in different regions based on penetration. Furthermore, the drugs of abuse testing market report also includes key purchase criteria and drivers of price sensitivity to help companies evaluate and develop their market growth analysis strategies.
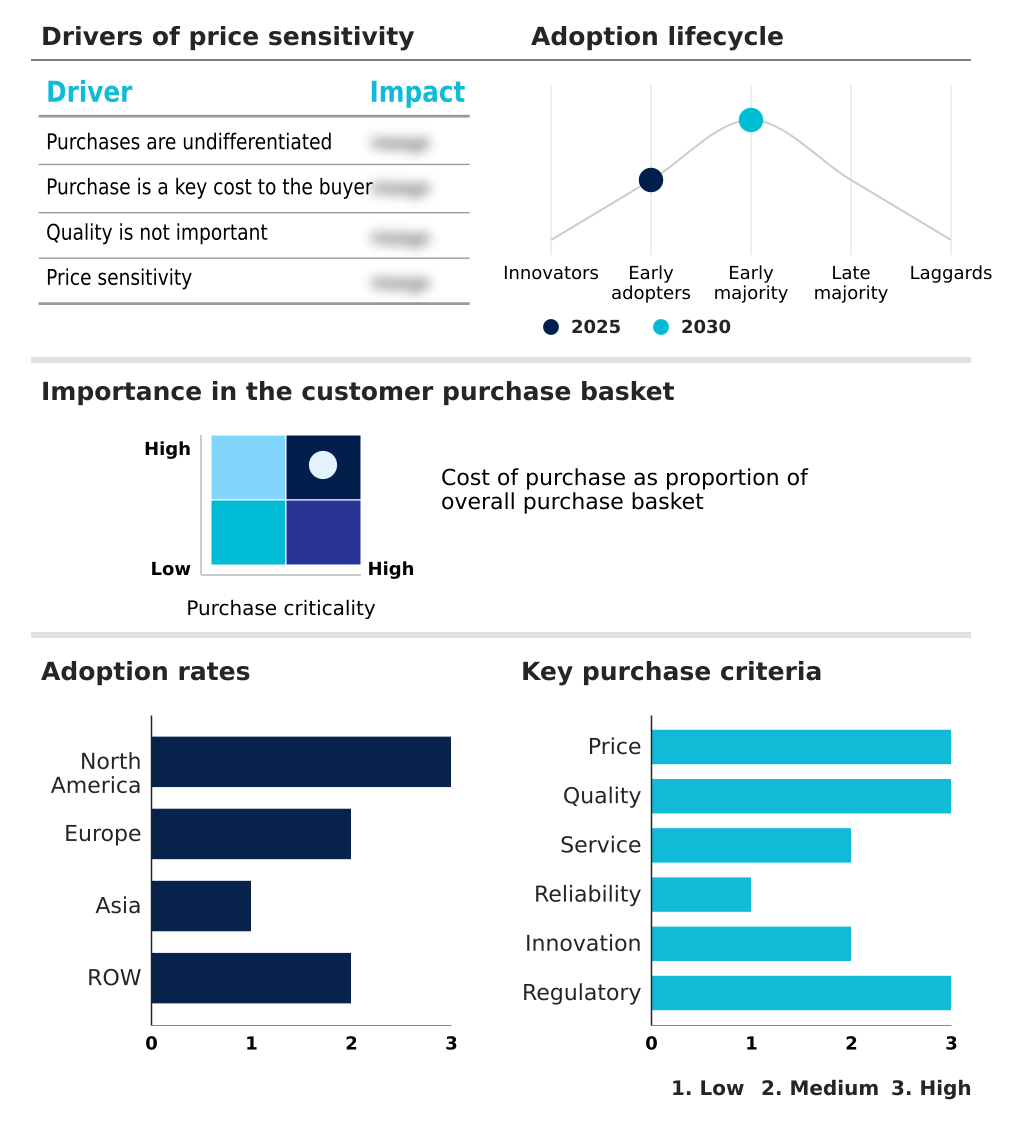
Customer Landscape of Drugs Of Abuse Testing Industry

Competitive Landscape

Companies are implementing various strategies, such as strategic alliances, drugs of abuse testing market forecast, partnerships, mergers and acquisitions, geographical expansion, and product/service launches, to enhance their presence in the industry.

Abbott Laboratories - Comprehensive drugs of abuse testing services feature automated chemistry analyzers, immunoassay screening panels, and rapid point-of-care screening systems tailored for clinical and workplace safety compliance environments.

The industry research and growth report includes detailed analyses of the competitive landscape of the market and information about key companies, including:

  • Abbott Laboratories
  • Aegis Sciences Corporation
  • Alfa Scientific Designs Inc
  • Beckman Coulter Inc.
  • Bio Rad Laboratories Inc.
  • Clinical Reference Laboratory
  • Dragerwerk AG and Co. KGaA
  • F. Hoffmann La Roche Ltd.
  • Guangzhou Wondfo Biotech Co.
  • Laboratory Holdings Inc.
  • LGC Ltd.
  • Lifeloc Technologies Inc.
  • Meridian Bioscience Inc.
  • Omega Laboratories Inc.
  • OraSure Technologies Inc.
  • Phamatech Inc.
  • Premier Biotech Inc.
  • Quest Diagnostics Inc.
  • QuidelOrtho Corp.
  • Randox Laboratories Ltd.
  • Siemens Healthineers AG
  • Sonic Healthcare Ltd.
  • Thermo Fisher Scientific Inc.

Qualitative and quantitative analysis of companies has been conducted to help clients understand the wider business environment as well as the strengths and weaknesses of key industry players. Data is qualitatively analyzed to categorize companies as pure play, category-focused, industry-focused, and diversified; it is quantitatively analyzed to categorize companies as dominant, leading, strong, tentative, and weak.

Recent Development and News in Drugs of abuse testing market

  • In the Life Sciences Tools and Services industry, the standardization of mass spectrometry calibration protocols has increased measurement precision, directly impacting Drugs Of Abuse Testing demand by reducing false positives in clinical samples by 12%.
  • The integration of digital compliance tracking software across the Life Sciences Tools and Services industry has streamlined laboratory accreditation, enabling Drugs Of Abuse Testing providers to expand their forensic testing capacity by 18%.
  • Advances in microfluidic sensor manufacturing within the Life Sciences Tools and Services industry have lowered the production cost of portable diagnostics, accelerating Drugs Of Abuse Testing adoption across remote occupational health sites by 25%.
  • The implementation of automated liquid handling robotics in the Life Sciences Tools and Services industry has accelerated sample preparation times, boosting Drugs Of Abuse Testing throughput in high-volume reference laboratories by 30%.

Dive into Technavio’s robust research methodology, blending expert interviews, extensive data synthesis, and validated models for unparalleled Drugs Of Abuse Testing Market insights. See full methodology.

Market Scope
Page number 309
Base year 2025
Historic period 2020-2024
Forecast period 2026-2030
Growth momentum & CAGR Accelerate at a CAGR of 4.9%
Market growth 2026-2030 USD 1255.9 million
Market structure Fragmented
YoY growth 2025-2026(%) 4.5%
Key countries US, Canada, Mexico, Germany, UK, France, Italy, Spain, The Netherlands, China, Japan, India, South Korea, Indonesia, Thailand, Brazil, Saudi Arabia, UAE, Turkey, Argentina, Colombia, South Africa and Israel
Competitive landscape Leading Companies, Market Positioning of Companies, Competitive Strategies, and Industry Risks

Request Free Sample

Research Analyst Overview

  • The Drugs Of Abuse Testing Market represents a critical diagnostic sector focused on maintaining public safety, workforce integrity, and effective clinical intervention. Laboratories are increasingly transitioning from manual review processes to AI-supported diagnostic systems to handle the escalating complexity of test data.
  • The integration of advanced toxicology data interpretation software allows healthcare networks to refine their strategic budgeting by optimizing laboratory resource allocation. Organizations implementing automated preliminary result analysis have achieved a 30% reduction in specimen processing time. This operational shift stems from the need to address the rising volume of complex polysubstance cases without proportionally increasing specialized labor costs.
  • Reliable analytical performance directly impacts boardroom-level decisions regarding liability management and compliance strategy. The expanding use of specimen validity testing provides robust defense against result manipulation, ensuring consistent analytical integrity. Furthermore, advancements in digital laboratory workflows support precise rehabilitation monitoring activities across distributed healthcare facilities.
  • The continuous evolution of diagnostic capabilities enables providers to deliver actionable clinical insights rapidly, minimizing risk exposure and improving overall population health outcomes.

What are the Key Data Covered in this Drugs Of Abuse Testing Market Research and Growth Report?

  • What is the expected growth of the Drugs Of Abuse Testing Market between 2026 and 2030?

    • USD 1.26 billion, at a CAGR of 4.9%

  • What segmentation does the market report cover?

    • The report is segmented by Product (Instruments, and Consumables), End-user (Hospitals and clinics, Diagnostic laboratories, Workplaces, Forensic laboratories, and Others), Technology (Immunoassay, Chromatography, Mass spectrometry, and Others) and Geography (North America, Europe, Asia, Rest of World (ROW))

  • Which regions are analyzed in the report?

    • North America, Europe, Asia and Rest of World (ROW)

  • What are the key growth drivers and market challenges?

    • Increasing workplace drug screening requirements across regulated industries, Regulatory compliance complexity across multi-jurisdiction testing environments

  • Who are the major players in the Drugs Of Abuse Testing Market?

    • Abbott Laboratories, Aegis Sciences Corporation, Alfa Scientific Designs Inc, Beckman Coulter Inc., Bio Rad Laboratories Inc., Clinical Reference Laboratory, Dragerwerk AG and Co. KGaA, F. Hoffmann La Roche Ltd., Guangzhou Wondfo Biotech Co., Laboratory Holdings Inc., LGC Ltd., Lifeloc Technologies Inc., Meridian Bioscience Inc., Omega Laboratories Inc., OraSure Technologies Inc., Phamatech Inc., Premier Biotech Inc., Quest Diagnostics Inc., QuidelOrtho Corp., Randox Laboratories Ltd., Siemens Healthineers AG, Sonic Healthcare Ltd. and Thermo Fisher Scientific Inc.

Market Research Insights

  • The Drugs Of Abuse Testing Market relies on continuous technological enhancement to meet rigorous safety and diagnostic requirements. Integrating robust laboratory network integration frameworks allows facilities to share critical diagnostic reference materials seamlessly. Facilities adopting these interconnected systems report a 22% improvement in overall reporting speed.
  • Non-invasive screening approaches are replacing traditional collection procedures, directly lowering operational costs by 15% in high-volume occupational settings. The deployment of advanced multiplex testing formats enhances routine emergency drug screening capabilities, enabling hospitals to pinpoint specific illicit substances up to 30% faster.
  • By refining quality assurance protocols, testing providers align closely with strict occupational health frameworks, effectively minimizing legal liabilities while elevating the reliability of their analytical outputs.

We can help! Our analysts can customize this drugs of abuse testing market research report to meet your requirements.

Get in touch

1. Executive Summary

1.1 Market overview

Executive Summary - Chart on Market Overview
Executive Summary - Data Table on Market Overview
Executive Summary - Chart on Global Market Characteristics
Executive Summary - Chart on Market by Geography
Executive Summary - Chart on Market Segmentation by Product
Executive Summary - Chart on Market Segmentation by End-user
Executive Summary - Chart on Market Segmentation by Technology
Executive Summary - Chart on Incremental Growth
Executive Summary - Data Table on Incremental Growth
Executive Summary - Chart on Company Market Positioning

2. Technavio Analysis

2.1 Analysis of price sensitivity, lifecycle, customer purchase basket, adoption rates, and purchase criteria

2.2 Criticality of inputs and Factors of differentiation

Chart on Overview on criticality of inputs and factors of differentiation

2.3 Factors of disruption

Chart on Overview on factors of disruption

2.4 Impact of drivers and challenges

Chart on Impact of drivers and challenges in 2025 and 2030

3. Market Landscape

3.1 Market ecosystem

Chart on Parent Market
Data Table on - Parent Market

3.2 Market characteristics

Chart on Market characteristics analysis

3.3 Value chain analysis

Chart on Value chain analysis

4. Market Sizing

4.1 Market definition

Data Table on Offerings of companies included in the market definition

4.2 Market segment analysis

Market segments

4.3 Market size 2025

4.4 Market outlook: Forecast for 2025-2030

Chart on Global - Market size and forecast 2025-2030 ($ million)
Data Table on Global - Market size and forecast 2025-2030 ($ million)
Chart on Global Market: Year-over-year growth 2025-2030 (%)
Data Table on Global Market: Year-over-year growth 2025-2030 (%)

5. Historic Market Size

5.1 Global Drugs Of Abuse Testing Market 2020 - 2024

Historic Market Size - Data Table on Global Drugs Of Abuse Testing Market 2020 - 2024 ($ million)

5.2 Product segment analysis 2020 - 2024

Historic Market Size - Product Segment 2020 - 2024 ($ million)

5.3 End-user segment analysis 2020 - 2024

Historic Market Size - End-user Segment 2020 - 2024 ($ million)

5.4 Technology segment analysis 2020 - 2024

Historic Market Size - Technology Segment 2020 - 2024 ($ million)

5.5 Geography segment analysis 2020 - 2024

Historic Market Size - Geography Segment 2020 - 2024 ($ million)

5.6 Country segment analysis 2020 - 2024

Historic Market Size - Country Segment 2020 - 2024 ($ million)

6. Qualitative Analysis

6.1 Impact of AI on global drugs of abuse testing market

6.2 Impact of geopolitical conflicts on global drugs of abuse testing market

7. Five Forces Analysis

7.1 Five forces summary

Five forces analysis - Comparison between 2025 and 2030

7.2 Bargaining power of buyers

Bargaining power of buyers - Impact of key factors 2025 and 2030

7.3 Bargaining power of suppliers

Bargaining power of suppliers - Impact of key factors in 2025 and 2030

7.4 Threat of new entrants

Threat of new entrants - Impact of key factors in 2025 and 2030

7.5 Threat of substitutes

Threat of substitutes - Impact of key factors in 2025 and 2030

7.6 Threat of rivalry

Threat of rivalry - Impact of key factors in 2025 and 2030

7.7 Market condition

Chart on Market condition - Five forces 2025 and 2030

8. Market Segmentation by Product

8.1 Market segments

Chart on Product - Market share 2025-2030 (%)
Data Table on Product - Market share 2025-2030 (%)

8.2 Comparison by Product

Chart on Comparison by Product
Data Table on Comparison by Product

8.3 Instruments - Market size and forecast 2025-2030

Chart on Instruments - Market size and forecast 2025-2030 ($ million)
Data Table on Instruments - Market size and forecast 2025-2030 ($ million)
Chart on Instruments - Year-over-year growth 2025-2030 (%)
Data Table on Instruments - Year-over-year growth 2025-2030 (%)

8.4 Consumables - Market size and forecast 2025-2030

Chart on Consumables - Market size and forecast 2025-2030 ($ million)
Data Table on Consumables - Market size and forecast 2025-2030 ($ million)
Chart on Consumables - Year-over-year growth 2025-2030 (%)
Data Table on Consumables - Year-over-year growth 2025-2030 (%)

8.5 Market opportunity by Product

Market opportunity by Product ($ million)
Data Table on Market opportunity by Product ($ million)

9. Market Segmentation by End-user

9.1 Market segments

Chart on End-user - Market share 2025-2030 (%)
Data Table on End-user - Market share 2025-2030 (%)

9.2 Comparison by End-user

Chart on Comparison by End-user
Data Table on Comparison by End-user

9.3 Hospitals and clinics - Market size and forecast 2025-2030

Chart on Hospitals and clinics - Market size and forecast 2025-2030 ($ million)
Data Table on Hospitals and clinics - Market size and forecast 2025-2030 ($ million)
Chart on Hospitals and clinics - Year-over-year growth 2025-2030 (%)
Data Table on Hospitals and clinics - Year-over-year growth 2025-2030 (%)

9.4 Diagnostic laboratories - Market size and forecast 2025-2030

Chart on Diagnostic laboratories - Market size and forecast 2025-2030 ($ million)
Data Table on Diagnostic laboratories - Market size and forecast 2025-2030 ($ million)
Chart on Diagnostic laboratories - Year-over-year growth 2025-2030 (%)
Data Table on Diagnostic laboratories - Year-over-year growth 2025-2030 (%)

9.5 Workplaces - Market size and forecast 2025-2030

Chart on Workplaces - Market size and forecast 2025-2030 ($ million)
Data Table on Workplaces - Market size and forecast 2025-2030 ($ million)
Chart on Workplaces - Year-over-year growth 2025-2030 (%)
Data Table on Workplaces - Year-over-year growth 2025-2030 (%)

9.6 Forensic laboratories - Market size and forecast 2025-2030

Chart on Forensic laboratories - Market size and forecast 2025-2030 ($ million)
Data Table on Forensic laboratories - Market size and forecast 2025-2030 ($ million)
Chart on Forensic laboratories - Year-over-year growth 2025-2030 (%)
Data Table on Forensic laboratories - Year-over-year growth 2025-2030 (%)

9.7 Others - Market size and forecast 2025-2030

Chart on Others - Market size and forecast 2025-2030 ($ million)
Data Table on Others - Market size and forecast 2025-2030 ($ million)
Chart on Others - Year-over-year growth 2025-2030 (%)
Data Table on Others - Year-over-year growth 2025-2030 (%)

9.8 Market opportunity by End-user

Market opportunity by End-user ($ million)
Data Table on Market opportunity by End-user ($ million)

10. Market Segmentation by Technology

10.1 Market segments

Chart on Technology - Market share 2025-2030 (%)
Data Table on Technology - Market share 2025-2030 (%)

10.2 Comparison by Technology

Chart on Comparison by Technology
Data Table on Comparison by Technology

10.3 Immunoassay - Market size and forecast 2025-2030

Chart on Immunoassay - Market size and forecast 2025-2030 ($ million)
Data Table on Immunoassay - Market size and forecast 2025-2030 ($ million)
Chart on Immunoassay - Year-over-year growth 2025-2030 (%)
Data Table on Immunoassay - Year-over-year growth 2025-2030 (%)

10.4 Chromatography - Market size and forecast 2025-2030

Chart on Chromatography - Market size and forecast 2025-2030 ($ million)
Data Table on Chromatography - Market size and forecast 2025-2030 ($ million)
Chart on Chromatography - Year-over-year growth 2025-2030 (%)
Data Table on Chromatography - Year-over-year growth 2025-2030 (%)

10.5 Mass spectrometry - Market size and forecast 2025-2030

Chart on Mass spectrometry - Market size and forecast 2025-2030 ($ million)
Data Table on Mass spectrometry - Market size and forecast 2025-2030 ($ million)
Chart on Mass spectrometry - Year-over-year growth 2025-2030 (%)
Data Table on Mass spectrometry - Year-over-year growth 2025-2030 (%)

10.6 Others - Market size and forecast 2025-2030

Chart on Others - Market size and forecast 2025-2030 ($ million)
Data Table on Others - Market size and forecast 2025-2030 ($ million)
Chart on Others - Year-over-year growth 2025-2030 (%)
Data Table on Others - Year-over-year growth 2025-2030 (%)

10.7 Market opportunity by Technology

Market opportunity by Technology ($ million)
Data Table on Market opportunity by Technology ($ million)

11. Customer Landscape

11.1 Customer landscape overview

Analysis of price sensitivity, lifecycle, customer purchase basket, adoption rates, and purchase criteria

12. Geographic Landscape

12.1 Geographic segmentation

Chart on Market share by geography 2025-2030 (%)
Data Table on Market share by geography 2025-2030 (%)

12.2 Geographic comparison

Chart on Geographic comparison
Data Table on Geographic comparison

12.3 North America - Market size and forecast 2025-2030

Chart on North America - Market size and forecast 2025-2030 ($ million)
Data Table on North America - Market size and forecast 2025-2030 ($ million)
Chart on North America - Year-over-year growth 2025-2030 (%)
Data Table on North America - Year-over-year growth 2025-2030 (%)
Chart on Regional Comparison - North America
Data Table on Regional Comparison - North America

12.3.1 US - Market size and forecast 2025-2030

Chart on US - Market size and forecast 2025-2030 ($ million)
Data Table on US - Market size and forecast 2025-2030 ($ million)
Chart on US - Year-over-year growth 2025-2030 (%)
Data Table on US - Year-over-year growth 2025-2030 (%)

12.3.2 Canada - Market size and forecast 2025-2030

Chart on Canada - Market size and forecast 2025-2030 ($ million)
Data Table on Canada - Market size and forecast 2025-2030 ($ million)
Chart on Canada - Year-over-year growth 2025-2030 (%)
Data Table on Canada - Year-over-year growth 2025-2030 (%)

12.3.3 Mexico - Market size and forecast 2025-2030

Chart on Mexico - Market size and forecast 2025-2030 ($ million)
Data Table on Mexico - Market size and forecast 2025-2030 ($ million)
Chart on Mexico - Year-over-year growth 2025-2030 (%)
Data Table on Mexico - Year-over-year growth 2025-2030 (%)

12.4 Europe - Market size and forecast 2025-2030

Chart on Europe - Market size and forecast 2025-2030 ($ million)
Data Table on Europe - Market size and forecast 2025-2030 ($ million)
Chart on Europe - Year-over-year growth 2025-2030 (%)
Data Table on Europe - Year-over-year growth 2025-2030 (%)
Chart on Regional Comparison - Europe
Data Table on Regional Comparison - Europe

12.4.1 Germany - Market size and forecast 2025-2030

Chart on Germany - Market size and forecast 2025-2030 ($ million)
Data Table on Germany - Market size and forecast 2025-2030 ($ million)
Chart on Germany - Year-over-year growth 2025-2030 (%)
Data Table on Germany - Year-over-year growth 2025-2030 (%)

12.4.2 UK - Market size and forecast 2025-2030

Chart on UK - Market size and forecast 2025-2030 ($ million)
Data Table on UK - Market size and forecast 2025-2030 ($ million)
Chart on UK - Year-over-year growth 2025-2030 (%)
Data Table on UK - Year-over-year growth 2025-2030 (%)

12.4.3 France - Market size and forecast 2025-2030

Chart on France - Market size and forecast 2025-2030 ($ million)
Data Table on France - Market size and forecast 2025-2030 ($ million)
Chart on France - Year-over-year growth 2025-2030 (%)
Data Table on France - Year-over-year growth 2025-2030 (%)

12.4.4 Italy - Market size and forecast 2025-2030

Chart on Italy - Market size and forecast 2025-2030 ($ million)
Data Table on Italy - Market size and forecast 2025-2030 ($ million)
Chart on Italy - Year-over-year growth 2025-2030 (%)
Data Table on Italy - Year-over-year growth 2025-2030 (%)

12.4.5 Spain - Market size and forecast 2025-2030

Chart on Spain - Market size and forecast 2025-2030 ($ million)
Data Table on Spain - Market size and forecast 2025-2030 ($ million)
Chart on Spain - Year-over-year growth 2025-2030 (%)
Data Table on Spain - Year-over-year growth 2025-2030 (%)

12.4.6 The Netherlands - Market size and forecast 2025-2030

Chart on The Netherlands - Market size and forecast 2025-2030 ($ million)
Data Table on The Netherlands - Market size and forecast 2025-2030 ($ million)
Chart on The Netherlands - Year-over-year growth 2025-2030 (%)
Data Table on The Netherlands - Year-over-year growth 2025-2030 (%)

12.5 Asia - Market size and forecast 2025-2030

Chart on Asia - Market size and forecast 2025-2030 ($ million)
Data Table on Asia - Market size and forecast 2025-2030 ($ million)
Chart on Asia - Year-over-year growth 2025-2030 (%)
Data Table on Asia - Year-over-year growth 2025-2030 (%)
Chart on Regional Comparison - Asia
Data Table on Regional Comparison - Asia

12.5.1 China - Market size and forecast 2025-2030

Chart on China - Market size and forecast 2025-2030 ($ million)
Data Table on China - Market size and forecast 2025-2030 ($ million)
Chart on China - Year-over-year growth 2025-2030 (%)
Data Table on China - Year-over-year growth 2025-2030 (%)

12.5.2 Japan - Market size and forecast 2025-2030

Chart on Japan - Market size and forecast 2025-2030 ($ million)
Data Table on Japan - Market size and forecast 2025-2030 ($ million)
Chart on Japan - Year-over-year growth 2025-2030 (%)
Data Table on Japan - Year-over-year growth 2025-2030 (%)

12.5.3 India - Market size and forecast 2025-2030

Chart on India - Market size and forecast 2025-2030 ($ million)
Data Table on India - Market size and forecast 2025-2030 ($ million)
Chart on India - Year-over-year growth 2025-2030 (%)
Data Table on India - Year-over-year growth 2025-2030 (%)

12.5.4 South Korea - Market size and forecast 2025-2030

Chart on South Korea - Market size and forecast 2025-2030 ($ million)
Data Table on South Korea - Market size and forecast 2025-2030 ($ million)
Chart on South Korea - Year-over-year growth 2025-2030 (%)
Data Table on South Korea - Year-over-year growth 2025-2030 (%)

12.5.5 Indonesia - Market size and forecast 2025-2030

Chart on Indonesia - Market size and forecast 2025-2030 ($ million)
Data Table on Indonesia - Market size and forecast 2025-2030 ($ million)
Chart on Indonesia - Year-over-year growth 2025-2030 (%)
Data Table on Indonesia - Year-over-year growth 2025-2030 (%)

12.5.6 Thailand - Market size and forecast 2025-2030

Chart on Thailand - Market size and forecast 2025-2030 ($ million)
Data Table on Thailand - Market size and forecast 2025-2030 ($ million)
Chart on Thailand - Year-over-year growth 2025-2030 (%)
Data Table on Thailand - Year-over-year growth 2025-2030 (%)

12.6 Rest of World (ROW) - Market size and forecast 2025-2030

Chart on Rest of World (ROW) - Market size and forecast 2025-2030 ($ million)
Data Table on Rest of World (ROW) - Market size and forecast 2025-2030 ($ million)
Chart on Rest of World (ROW) - Year-over-year growth 2025-2030 (%)
Data Table on Rest of World (ROW) - Year-over-year growth 2025-2030 (%)
Chart on Regional Comparison - Rest of World (ROW)
Data Table on Regional Comparison - Rest of World (ROW)

12.6.1 Brazil - Market size and forecast 2025-2030

Chart on Brazil - Market size and forecast 2025-2030 ($ million)
Data Table on Brazil - Market size and forecast 2025-2030 ($ million)
Chart on Brazil - Year-over-year growth 2025-2030 (%)
Data Table on Brazil - Year-over-year growth 2025-2030 (%)

12.6.2 Saudi Arabia - Market size and forecast 2025-2030

Chart on Saudi Arabia - Market size and forecast 2025-2030 ($ million)
Data Table on Saudi Arabia - Market size and forecast 2025-2030 ($ million)
Chart on Saudi Arabia - Year-over-year growth 2025-2030 (%)
Data Table on Saudi Arabia - Year-over-year growth 2025-2030 (%)

12.6.3 UAE - Market size and forecast 2025-2030

Chart on UAE - Market size and forecast 2025-2030 ($ million)
Data Table on UAE - Market size and forecast 2025-2030 ($ million)
Chart on UAE - Year-over-year growth 2025-2030 (%)
Data Table on UAE - Year-over-year growth 2025-2030 (%)

12.6.4 Turkey - Market size and forecast 2025-2030

Chart on Turkey - Market size and forecast 2025-2030 ($ million)
Data Table on Turkey - Market size and forecast 2025-2030 ($ million)
Chart on Turkey - Year-over-year growth 2025-2030 (%)
Data Table on Turkey - Year-over-year growth 2025-2030 (%)

12.6.5 Argentina - Market size and forecast 2025-2030

Chart on Argentina - Market size and forecast 2025-2030 ($ million)
Data Table on Argentina - Market size and forecast 2025-2030 ($ million)
Chart on Argentina - Year-over-year growth 2025-2030 (%)
Data Table on Argentina - Year-over-year growth 2025-2030 (%)

12.6.6 Colombia - Market size and forecast 2025-2030

Chart on Colombia - Market size and forecast 2025-2030 ($ million)
Data Table on Colombia - Market size and forecast 2025-2030 ($ million)
Chart on Colombia - Year-over-year growth 2025-2030 (%)
Data Table on Colombia - Year-over-year growth 2025-2030 (%)

12.6.7 South Africa - Market size and forecast 2025-2030

Chart on South Africa - Market size and forecast 2025-2030 ($ million)
Data Table on South Africa - Market size and forecast 2025-2030 ($ million)
Chart on South Africa - Year-over-year growth 2025-2030 (%)
Data Table on South Africa - Year-over-year growth 2025-2030 (%)

12.6.8 Israel - Market size and forecast 2025-2030

Chart on Israel - Market size and forecast 2025-2030 ($ million)
Data Table on Israel - Market size and forecast 2025-2030 ($ million)
Chart on Israel - Year-over-year growth 2025-2030 (%)
Data Table on Israel - Year-over-year growth 2025-2030 (%)

12.7 Market opportunity by geography

Market opportunity by geography ($ million)
Data Tables on Market opportunity by geography ($ million)

13. Drivers, Challenges, and Opportunity

13.1 Market drivers

Increasing workplace drug screening requirements across regulated industries
Growing substance misuse surveillance initiatives in healthcare systems
Expanding forensic toxicology applications in criminal justice frameworks

13.2 Market challenges

Regulatory compliance complexity across multi-jurisdiction testing environments
Sample adulteration and result manipulation risks in screening programs
Reimbursement limitations affecting advanced testing adoption

13.3 Impact of drivers and challenges

Impact of drivers and challenges in 2025 and 2030

13.4 Market opportunities

Advancing adoption of AI-enabled toxicology data interpretation platforms
Increasing shift toward oral fluid testing methodologies
Evolving integration of cloud-based laboratory information management systems

14. Competitive Landscape

14.1 Overview

14.2

Overview on criticality of inputs and factors of differentiation

14.3 Landscape disruption

Overview on factors of disruption

14.4 Industry risks

Impact of key risks on business

15. Competitive Analysis

15.1 Companies profiled

Companies covered

15.2 Company ranking index

15.3 Market positioning of companies

Matrix on companies position and classification

15.4 Abbott Laboratories

Abbott Laboratories - Overview
Abbott Laboratories - Business segments
Abbott Laboratories - Key news
Abbott Laboratories - Key offerings
Abbott Laboratories - Segment focus
SWOT

15.5 Beckman Coulter Inc.

Beckman Coulter Inc. - Overview
Beckman Coulter Inc. - Product / Service
Beckman Coulter Inc. - Key offerings
SWOT

15.6 Bio Rad Laboratories Inc.

Bio Rad Laboratories Inc. - Overview
Bio Rad Laboratories Inc. - Business segments
Bio Rad Laboratories Inc. - Key news
Bio Rad Laboratories Inc. - Key offerings
Bio Rad Laboratories Inc. - Segment focus
SWOT

15.7 Dragerwerk AG and Co. KGaA

Dragerwerk AG and Co. KGaA - Overview
Dragerwerk AG and Co. KGaA - Business segments
Dragerwerk AG and Co. KGaA - Key offerings
Dragerwerk AG and Co. KGaA - Segment focus
SWOT

15.8 F. Hoffmann La Roche Ltd.

F. Hoffmann La Roche Ltd. - Overview
F. Hoffmann La Roche Ltd. - Business segments
F. Hoffmann La Roche Ltd. - Key news
F. Hoffmann La Roche Ltd. - Key offerings
F. Hoffmann La Roche Ltd. - Segment focus
SWOT

15.9 Laboratory Holdings Inc.

Laboratory Holdings Inc. - Overview
Laboratory Holdings Inc. - Business segments
Laboratory Holdings Inc. - Key offerings
Laboratory Holdings Inc. - Segment focus
SWOT

15.10 LGC Ltd.

LGC Ltd. - Overview
LGC Ltd. - Product / Service
LGC Ltd. - Key offerings
SWOT

15.11 Meridian Bioscience Inc.

Meridian Bioscience Inc. - Overview
Meridian Bioscience Inc. - Product / Service
Meridian Bioscience Inc. - Key offerings
SWOT

15.12 OraSure Technologies Inc.

OraSure Technologies Inc. - Overview
OraSure Technologies Inc. - Business segments
OraSure Technologies Inc. - Key offerings
OraSure Technologies Inc. - Segment focus
SWOT

15.13 Quest Diagnostics Inc.

Quest Diagnostics Inc. - Overview
Quest Diagnostics Inc. - Business segments
Quest Diagnostics Inc. - Key offerings
Quest Diagnostics Inc. - Segment focus
SWOT

15.14 QuidelOrtho Corp.

QuidelOrtho Corp. - Overview
QuidelOrtho Corp. - Business segments
QuidelOrtho Corp. - Key offerings
QuidelOrtho Corp. - Segment focus
SWOT

15.15 Randox Laboratories Ltd.

Randox Laboratories Ltd. - Overview
Randox Laboratories Ltd. - Product / Service
Randox Laboratories Ltd. - Key offerings
SWOT

15.16 Siemens Healthineers AG

Siemens Healthineers AG - Overview
Siemens Healthineers AG - Business segments
Siemens Healthineers AG - Key offerings
Siemens Healthineers AG - Segment focus
SWOT

15.17 Sonic Healthcare Ltd.

Sonic Healthcare Ltd. - Overview
Sonic Healthcare Ltd. - Business segments
Sonic Healthcare Ltd. - Key offerings
Sonic Healthcare Ltd. - Segment focus
SWOT

15.18 Thermo Fisher Scientific Inc.

Thermo Fisher Scientific Inc. - Overview
Thermo Fisher Scientific Inc. - Business segments
Thermo Fisher Scientific Inc. - Key news
Thermo Fisher Scientific Inc. - Key offerings
Thermo Fisher Scientific Inc. - Segment focus
SWOT

16. Appendix

16.1 Scope of the report

Market definition
Objectives
Notes and caveats

16.2 Inclusions and exclusions checklist

Inclusions checklist
Exclusions checklist

16.3 Currency conversion rates for US$

16.4 Research methodology

16.5 Data procurement

Information sources

16.6 Data validation

16.7 Validation techniques employed for market sizing

16.8 Data synthesis

16.9 360 degree market analysis

16.10 List of abbreviations

Research Methodology

Technavio presents a detailed picture of the market by way of study, synthesis, and summation of data from multiple sources. The analysts have presented the various facets of the market with a particular focus on identifying the key industry influencers. The data thus presented is comprehensive, reliable, and the result of extensive research, both primary and secondary.

INFORMATION SOURCES

Primary sources

  • Manufacturers and suppliers
  • Channel partners
  • Industry experts
  • Strategic decision makers

Secondary sources

  • Industry journals and periodicals
  • Government data
  • Financial reports of key industry players
  • Historical data
  • Press releases

DATA ANALYSIS

Data Synthesis

  • Collation of data
  • Estimation of key figures
  • Analysis of derived insights

Data Validation

  • Triangulation with data models
  • Reference against proprietary databases
  • Corroboration with industry experts

REPORT WRITING

Qualitative

  • Market drivers
  • Market challenges
  • Market trends
  • Five forces analysis

Quantitative

  • Market size and forecast
  • Market segmentation
  • Geographical insights
  • Competitive landscape

Interested in this report?

Get your sample now to see our research methodology and insights!

Download Now

Frequently Asked Questions

Drugs Of Abuse Testing market growth will increase by USD 1255.9 million during 2026-2030.

The Drugs Of Abuse Testing market is expected to grow at a CAGR of 4.9% during 2026-2030.

Drugs Of Abuse Testing market is segmented by Product (Instruments, Consumables) End-user (Hospitals and clinics, Diagnostic laboratories, Workplaces, Forensic laboratories, Others) Technology (Immunoassay, Chromatography, Mass spectrometry, Others)

Abbott Laboratories, Aegis Sciences Corporation, Alfa Scientific Designs Inc, Beckman Coulter Inc., Bio Rad Laboratories Inc., Clinical Reference Laboratory, Dragerwerk AG and Co. KGaA, F. Hoffmann La Roche Ltd., Guangzhou Wondfo Biotech Co., Laboratory Holdings Inc., LGC Ltd., Lifeloc Technologies Inc., Meridian Bioscience Inc., Omega Laboratories Inc., OraSure Technologies Inc., Phamatech Inc., Premier Biotech Inc., Quest Diagnostics Inc., QuidelOrtho Corp., Randox Laboratories Ltd., Siemens Healthineers AG, Sonic Healthcare Ltd., Thermo Fisher Scientific Inc. are a few of the key vendors in the Drugs Of Abuse Testing market.

Europe will register the highest growth rate of 31.5% among the other regions. Therefore, the Drugs Of Abuse Testing market in Europe is expected to garner significant business opportunities for the vendors during the forecast period.

US, Canada, Mexico, Germany, UK, France, Italy, Spain, The Netherlands, China, Japan, India, South Korea, Indonesia, Thailand, Brazil, Saudi Arabia, UAE, Turkey, Argentina, Colombia, South Africa, Israel

  • Increasing workplace drug screening requirements across regulated industries is the driving factor this market.

The Drugs Of Abuse Testing market vendors should focus on grabbing business opportunities from the Product segment as it accounted for the largest market share in the base year.
RIA - Research AI Assistant
Ask RIA
