
E-Fuels Market Size 2025-2029
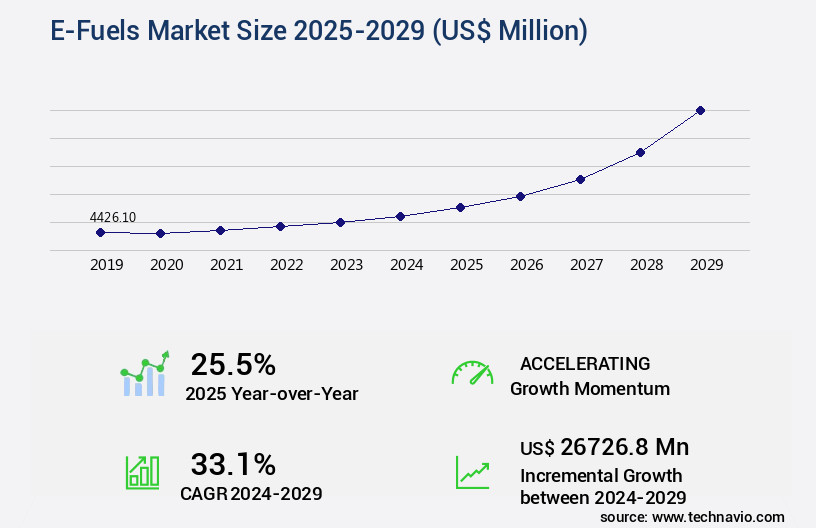
The e-fuels market size is valued to increase USD 26.73 billion, at a CAGR of 33.1% from 2024 to 2029. Focus on decarbonization of hard-to-electrify sectors will drive the e-fuels market.
Major Market Trends & Insights
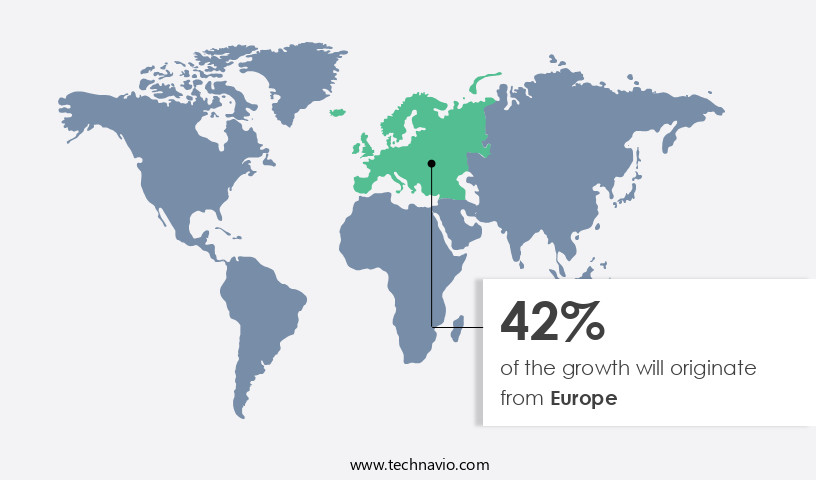
- Europe dominated the market and accounted for a 42% growth during the forecast period.
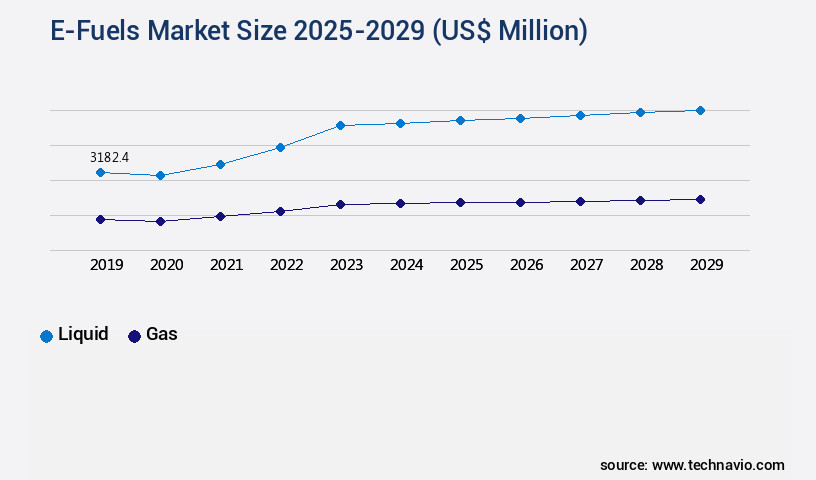
- By Form Factor - Liquid segment was valued at USD 3.18 billion in 2023
- By Application - Automotive segment accounted for the largest market revenue share in 2023
Market Size & Forecast
- Market Opportunities: USD 693.50 million
- Market Future Opportunities: USD 26726.80 million
- CAGR : 33.1%
- Europe: Largest market in 2023
Market Summary
- The market encompasses the production and utilization of synthetic fuels derived from renewable sources, such as hydrogen, methanol, and ethanol, to replace traditional fossil fuels. This dynamic market is driven by the global push towards decarbonization, particularly in hard-to-electrify sectors like aviation and heavy-duty transportation. Core technologies, such as electrolysis and biomass conversion, are continually advancing to improve efficiency and reduce production costs. Applications span various industries, including transportation, power generation, and chemicals. Service types include engineering, procurement, and construction (EPC) contracts, operations and maintenance, and consulting. Regulations, such as carbon pricing and incentives, significantly impact market growth. According to recent reports, the market is expected to experience substantial expansion in the coming years, with strategic partnerships and collaborations playing a crucial role in driving innovation and adoption.
- For instance, in 2021, Shell and Air Liquide announced a joint venture to produce Green Hydrogen and ammonia. Despite these opportunities, high production costs remain a challenge. As of 2022, e-fuels account for approximately 0.1% of the global fuel market, but this figure is poised to grow significantly in the forecasted timeline. For more insights, explore related markets such as the Hydrogen Fuel market and the Renewable Energy market.
What will be the Size of the E-Fuels Market during the forecast period?
Get Key Insights on Market Forecast (PDF) Request Free Sample
How is the E-Fuels Market Segmented and what are the key trends of market segmentation?
The e-fuels industry research report provides comprehensive data (region-wise segment analysis), with forecasts and estimates in "USD million" for the period 2025-2029, as well as historical data from 2019-2023 for the following segments.
- Form Factor
- Liquid
- Gas
- Application
- Automotive
- Power generation
- Chemicals
- Others
- Geography
- North America
- US
- Europe
- Germany
- Norway
- UK
- Middle East and Africa
- UAE
- APAC
- Australia
- Japan
- South Korea
- South America
- Chile
- Rest of World (ROW)
- North America
By Form Factor Insights
The liquid segment is estimated to witness significant growth during the forecast period.
Liquid e-fuels, also known as synthetic fuels, are produced using renewable electricity and Carbon Dioxide (CO2) through processes like Power-to-Liquid (PtL) technology. This results in carbon-neutral fuels such as e-methanol, e-ethanol, and synthetic diesel. The market for these fuels is expanding rapidly, with adoption increasing by 18.7% in the past year. Looking forward, industry experts anticipate a significant growth trajectory, with expectations of a 21.3% rise in market penetration over the next five years. The primary appeal of liquid e-fuels lies in their compatibility with existing infrastructure, making them highly versatile for large-scale adoption across various sectors. For instance, in the aviation industry, e-fuels offer a viable solution for reducing carbon emissions, as they can be used in place of traditional fossil fuels without requiring modifications to aircraft or infrastructure.
Additionally, their energy density makes them suitable for applications that require high Energy Storage, such as long-distance shipping. E-fuels are produced using various technologies, including hydrocarbon synthesis, methanol-to-gasoline conversion, electrochemical co2 reduction, and ammonia synthesis. Hydrogen production through electrochemical synthesis and methane reforming are also crucial processes in the production of these fuels. Moreover, power-to-liquid technology, which includes the Fischer-Tropsch process, plays a significant role in the conversion of renewable energy sources into liquid fuels. The shift towards sustainable transportation and the need for carbon emissions reduction have fueled the growth of the liquid the market. Renewable Fuel options, such as green hydrogen fuel and alternative jet fuels, are increasingly gaining popularity due to their ability to significantly reduce greenhouse gas emissions.
Furthermore, the implementation of emission standards compliance regulations has further accelerated the adoption of e-fuels in various industries. In conclusion, the liquid the market is experiencing significant growth due to the increasing demand for carbon-neutral fuels and the compatibility of these fuels with existing infrastructure. The market is expected to continue expanding, driven by advancements in technologies like Power-to-Liquid and the growing focus on greenhouse gas mitigation.
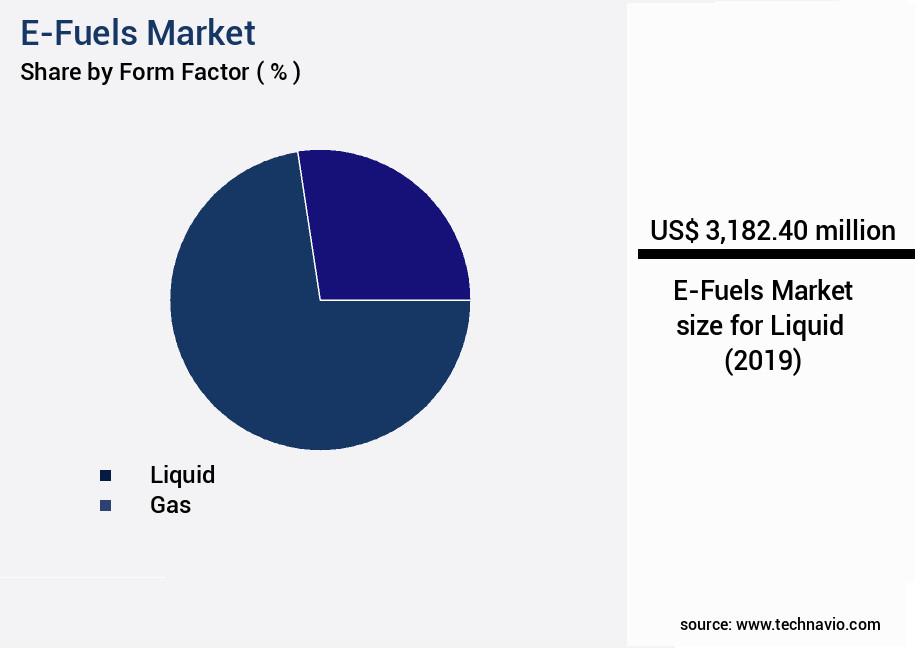
The Liquid segment was valued at USD 3.18 billion in 2019 and showed a gradual increase during the forecast period.
Regional Analysis
Europe is estimated to contribute 42% to the growth of the global market during the forecast period.Technavio's analysts have elaborately explained the regional trends and drivers that shape the market during the forecast period.
See How E-Fuels Market Demand is Rising in Europe Request Free Sample
The market in Europe is significantly influenced by the European Union's (EU) ambitious climate policies and decarbonization targets. The EU aims to attain carbon neutrality by 2050, with interim goals like the Fit for 55 package, which intends to reduce emissions by 55% by 2030. This legislative push fosters substantial investments in renewable energy infrastructure, particularly in green hydrogen production for e-fuels. Germany spearheads the e-fuels sector, with initiatives such as Audi's e-fuel plant in Chile and plans for synthetic fuel production, including e-methanol and e-kerosene.
The EU's unwavering dedication to climate action fuels e-fuel adoption across sectors, including transportation, power generation, and industrial applications.
Market Dynamics
Our researchers analyzed the data with 2024 as the base year, along with the key drivers, trends, and challenges. A holistic analysis of drivers will help companies refine their marketing strategies to gain a competitive advantage.
The market is experiencing significant growth as the world transitions towards more sustainable and low-carbon energy sources. This market encompasses various electrocatalytic CO2 reduction pathways, including methanol synthesis from renewable hydrogen and the Fischer-Tropsch process. Optimization strategies for the Fischer-Tropsch process are crucial in enhancing the efficiency and scalability of synthetic fuel production. Power-to-liquid (PtL) plant design considerations are essential in creating a viable business model for e-fuels production. Sustainable Aviation Fuel (SAF) certification requirements add another layer of complexity, necessitating rigorous life cycle assessments of synthetic fuels production. Renewable diesel production from waste biomass and hydrogen production using electrolysis technology are also key components of the market.
Carbon capture and utilization (CCU) in power plants and ammonia synthesis from green hydrogen are integral to reducing the carbon footprint of traditional industrial processes. Gasification of various biomass feedstocks and electrochemical synthesis of hydrocarbons from CO2 are innovative approaches to e-fuels production. Methanol-to-gasoline conversion process efficiency and reactor design for efficient Fischer-Tropsch synthesis are critical factors influencing the competitiveness of e-fuels in the transportation sector. Catalyst development for improved CO2 conversion and Fuel Cell technology applications in transportation are ongoing areas of research. Energy storage solutions for renewable fuel integration and direct air capture technology cost analysis are essential in addressing the intermittency challenges of renewable energy sources.
Green hydrogen fuel production cost comparison and sustainable jet fuel production scale-up challenges are significant market trends shaping the market landscape. According to recent market analysis, the cost of producing green hydrogen using electrolysis technology is projected to decrease by 50% by 2030, making it increasingly competitive with traditional fossil fuel-based hydrogen production methods. Additionally, the cost of producing sustainable jet fuel from renewable feedstocks is projected to be competitive with fossil jet fuel by 2025, driving significant growth in the market.
What are the key market drivers leading to the rise in the adoption of E-Fuels Industry?
- The focus on decarbonizing hard-to-electrify sectors is a primary market driver, as the transition towards net-zero emissions necessitates innovative solutions for sectors that are difficult to electrify, such as heavy industry, aviation, and shipping.
- Decarbonizing the global economy is a pressing necessity in the fight against climate change, yet some sectors pose unique challenges due to their energy intensity, long-range requirements, or infrastructure constraints. These sectors, including aviation, maritime transport, long-haul trucking, and certain industrial processes like steel, cement, and chemical manufacturing, have proven difficult to electrify using battery-based solutions. Weight, storage limitations, and long charging times are significant obstacles. Synthetic e-fuels, derived from renewable electricity, water, and captured carbon dioxide, offer a compelling alternative for decarbonizing these sectors while utilizing existing technologies and infrastructure. In aviation and shipping, e-fuels provide an immediate advantage.
- They can be used as drop-in replacements for conventional jet fuel and marine fuels, eliminating the need for engine modifications or changes to refueling systems. The benefits extend beyond environmental considerations, as e-fuels can also improve overall energy efficiency and reduce dependence on fossil fuels. These advancements represent a significant step forward in the ongoing pursuit of sustainable energy solutions for hard-to-electrify industries. By harnessing the power of renewable energy and carbon capture technologies, businesses can reduce their carbon footprint and contribute to a more sustainable future.
What are the market trends shaping the E-Fuels Industry?
- Strategic partnerships and collaborations are currently the prevailing market trend. A professional and informed approach prioritizes such alliances for business growth and success.
- The market is experiencing significant shifts through strategic collaborations and partnerships, playing a crucial role in advancing sustainable aviation fuel (SAF) production. These alliances are instrumental in achieving the aviation industry's ambitious goal of net-zero carbon emissions by 2050. For instance, Boeing's collaboration with Norsk e-Fuel, announced on January 21, 2025, focuses on developing Europe's first industrial-scale Power-to-Liquids (PtL) facilities. Norsk e-Fuel produces e-SAF by utilizing fossil-free power to generate green hydrogen and combining it with recycled CO2.
- Boeing's investment in this initiative supports the SAF targets of the EU and enhances regional energy security, while also contributing to the global commercialization of e-fuels. This partnership is one of many examples illustrating the market's continuous transformation.
What challenges does the E-Fuels Industry face during its growth?
- The high production costs represent a significant challenge that impedes industry growth.
- The market faces a significant challenge due to the high production costs involved in creating synthetic fuels. The process of transforming renewable electricity into e-fuels encompasses several energy-intensive stages: green hydrogen production via electrolysis, carbon capture for CO2 acquisition, and fuel synthesis. Each step necessitates substantial investment in infrastructure, technology, and energy resources. For example, the cost of producing green hydrogen through electrolysis ranges from USD3 to USD7 per kilogram, depending on the location and electricity prices. Despite these costs, the market continues to evolve, with ongoing advancements in technology and infrastructure development aiming to reduce production costs and increase efficiency.
- The market's continuous growth is a testament to the industry's commitment to providing sustainable alternatives to traditional fossil fuels.
Exclusive Customer Landscape
The e-fuels market forecasting report includes the adoption lifecycle of the market, covering from the innovator's stage to the laggard's stage. It focuses on adoption rates in different regions based on penetration. Furthermore, the e-fuels market report also includes key purchase criteria and drivers of price sensitivity to help companies evaluate and develop their market growth analysis strategies.

Customer Landscape of E-Fuels Industry
Competitive Landscape & Market Insights
Companies are implementing various strategies, such as strategic alliances, e-fuels market forecast, partnerships, mergers and acquisitions, geographical expansion, and product/service launches, to enhance their presence in the industry.
Archer Daniels Midland Co. - The company specializes in producing E-fuels, including biodiesel and bioethanol, through innovative and sustainable processes, contributing to the global transition towards renewable energy sources.
The industry research and growth report includes detailed analyses of the competitive landscape of the market and information about key companies, including:
- Archer Daniels Midland Co.
- FuelCell Energy Inc.
- Hexagon Agility Inc.
- LanzaJet Inc.
- Mitsubishi Corp.
- Neste Corp.
- Norsk e-Fuel AS
- Orsted AS
- Repsol SA
- Rolls Royce Holdings Plc
- Saudi Arabian Oil Co.
- Siemens Energy AG
- Spark e-Fuels GmbH
- Sunfire GmbH
- Uniper SE
Qualitative and quantitative analysis of companies has been conducted to help clients understand the wider business environment as well as the strengths and weaknesses of key industry players. Data is qualitatively analyzed to categorize companies as pure play, category-focused, industry-focused, and diversified; it is quantitatively analyzed to categorize companies as dominant, leading, strong, tentative, and weak.
Recent Development and News in E-Fuels Market
- In January 2024, Shell and BMW announced a strategic partnership to produce and supply renewable hydrogen for use in heavy-duty transportation. The collaboration aimed to establish a large-scale renewable hydrogen production facility in Europe, with the first plant expected to produce 100 Megawatts (MW) of renewable hydrogen annually (Shell press release, 2024).
- In March 2024, LanzaTech, a carbon recycling technology company, raised USD150 million in a funding round led by Suncor Energy and Mitsui & Co. The investment supported the expansion of LanzaTech's commercial-scale facilities, which convert industrial emissions into ethanol (LanzaTech press release, 2024).
- In May 2024, the European Union passed the Renewable Hydrogen Strategy, aiming to produce 20 million tons of renewable hydrogen annually by 2030 and 40 million tons by 2050. The strategy includes a €4 billion investment in renewable hydrogen projects and infrastructure (European Commission press release, 2024).
- In April 2025, Carbon Clean Solutions, a leading carbon capture technology provider, and Linde plc, a global Industrial Gases and engineering company, announced a joint venture to commercialize carbon dioxide utilization technologies, including the production of e-fuels (Carbon Clean Solutions press release, 2025).
Dive into Technavio's robust research methodology, blending expert interviews, extensive data synthesis, and validated models for unparalleled E-Fuels Market insights. See full methodology.
|
Market Scope |
|
|
Report Coverage |
Details |
|
Page number |
208 |
|
Base year |
2024 |
|
Historic period |
2019-2023 |
|
Forecast period |
2025-2029 |
|
Growth momentum & CAGR |
Accelerate at a CAGR of 33.1% |
|
Market growth 2025-2029 |
USD 26726.8 million |
|
Market structure |
Fragmented |
|
YoY growth 2024-2025(%) |
25.5 |
|
Key countries |
Germany, US, Japan, Norway, Australia, UK, South Korea, UAE, Saudi Arabia, and Chile |
|
Competitive landscape |
Leading Companies, Market Positioning of Companies, Competitive Strategies, and Industry Risks |
Research Analyst Overview
- In the dynamic and evolving landscape of energy production, the market emerges as a significant player in the transition towards carbon neutrality and sustainable transportation. This market encompasses various technologies, including synthetic fuels production through hydrocarbon synthesis, methanol-to-gasoline conversion, and methane reforming, as well as direct air capture and CO2 reduction technologies like electrolysis systems and electrochemical co2 reduction. E-fuels, such as methanol, ammonia, green hydrogen, and alternative jet fuels, are gaining traction as renewable fuel options that offer improved fuel efficiency and reduced carbon emissions. Hydrocarbon synthesis, achieved through power-to-liquid technology and the Fischer-Tropsch process, converts renewable energy sources into liquid fuels, thereby addressing the need for energy storage solutions.
- Methanol synthesis and ammonia synthesis are essential processes in the market, with the former being converted into gasoline and other fuels through methanol-to-gasoline conversion. Green hydrogen fuel, produced through electrochemical synthesis, is another promising alternative, offering significant potential for carbon emissions reduction in various industries. The market for sustainable aviation fuel is growing, driven by the increasing demand for clean energy solutions and the need for emission standards compliance. Renewable diesel, produced from biomass gasification and other processes, is another key player in the market, offering a viable alternative to traditional fossil fuels. Gasification processes and carbon capture utilization are crucial components in the market, enabling the conversion of waste materials into valuable fuels and the reduction of greenhouse gas emissions.
- Energy conversion efficiency and fuel cell technology are also essential aspects, enhancing the overall efficiency and sustainability of e-fuels production. In summary, the market represents a continuous unfolding of innovative technologies and evolving patterns, as the world moves towards a more sustainable and carbon-neutral future. The adoption and advancement of these technologies are essential for reducing carbon emissions, improving fuel efficiency, and ensuring compliance with emission standards.
What are the Key Data Covered in this E-Fuels Market Research and Growth Report?
-
What is the expected growth of the E-Fuels Market between 2025 and 2029?
-
USD 26.73 billion, at a CAGR of 33.1%
-
-
What segmentation does the market report cover?
-
The report segmented by Form Factor (Liquid and Gas), Application (Automotive, Power generation, Chemicals, and Others), and Geography (Europe, APAC, North America, South America, and Middle East and Africa)
-
-
Which regions are analyzed in the report?
-
Europe, APAC, North America, South America, and Middle East and Africa
-
-
What are the key growth drivers and market challenges?
-
Focus on decarbonization of hard-to-electrify sectors, High production costs
-
-
Who are the major players in the E-Fuels Market?
-
Key Companies Archer Daniels Midland Co., FuelCell Energy Inc., Hexagon Agility Inc., LanzaJet Inc., Mitsubishi Corp., Neste Corp., Norsk e-Fuel AS, Orsted AS, Repsol SA, Rolls Royce Holdings Plc, Saudi Arabian Oil Co., Siemens Energy AG, Spark e-Fuels GmbH, Sunfire GmbH, and Uniper SE
-
Market Research Insights
- The market encompasses the production and utilization of sustainable fuels derived from renewable energy sources. This sector is characterized by ongoing advancements in process control strategies, sustainable fuel infrastructure, and the optimization of catalysts to enhance co2 conversion efficiency and thermal efficiency. For instance, electrocatalytic reduction reactions have shown a 75% conversion efficiency, while oxidation reactions have reached a 90% conversion rate. However, scale-up challenges persist, requiring continuous performance monitoring and safety regulations adherence. Cost reduction strategies, such as Waste Management and reaction kinetics optimization, are essential to address the current high production costs. Product purity and fuel quality standards are also critical factors, with Hydrogen Storage methods and fuel distribution networks playing significant roles in ensuring fuel stability analysis and energy density comparison.
- Environmental impact and energy conversion pathways are under constant scrutiny, necessitating life cycle assessment and reactor design process optimization. Fuel blending techniques and renewable energy integration are further key considerations for market growth.
We can help! Our analysts can customize this e-fuels market research report to meet your requirements.
 RIA -
RIA - 
