
Edge AI Software Market Size 2026-2030
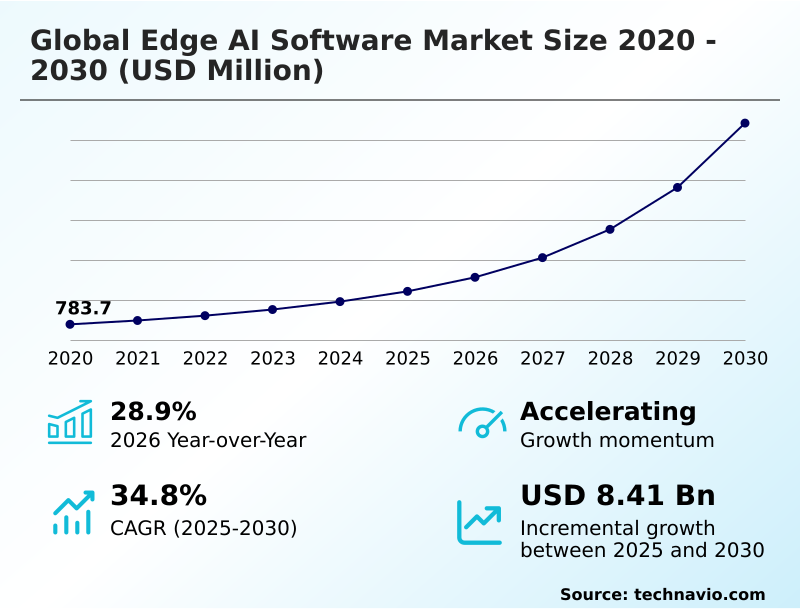
The edge ai software market size is valued to increase by USD 8.41 billion, at a CAGR of 34.8% from 2025 to 2030. Increasing demand for low-latency processing and real-time decision-making will drive the edge ai software market.
Major Market Trends & Insights
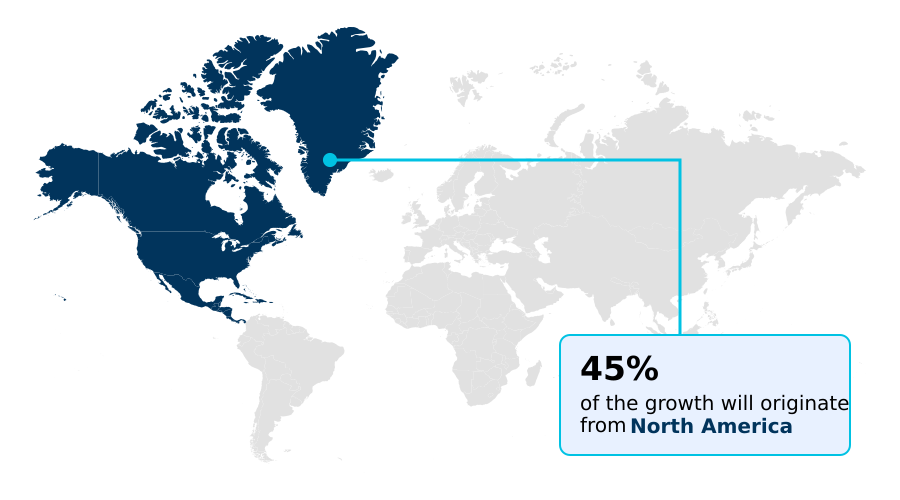
- North America dominated the market and accounted for a 44.9% growth during the forecast period.
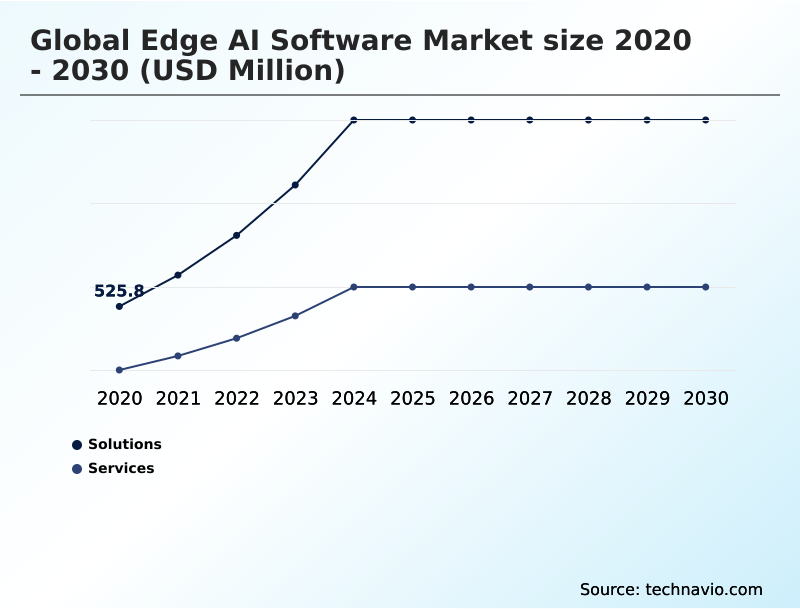
- By Component - Solutions segment was valued at USD 1.31 billion in 2024
- By Deployment - Cloud segment accounted for the largest market revenue share in 2024
Market Size & Forecast
- Market Opportunities: USD 10.06 billion
- Market Future Opportunities: USD 8.41 billion
- CAGR from 2025 to 2030 : 34.8%
Market Summary
- The edge AI software market is characterized by a fundamental shift toward decentralized computing, driven by the need for low-latency data processing and enhanced data privacy. This technology enables the deployment of optimized machine learning models directly onto peripheral hardware, facilitating real-time analytics at the source of data generation.
- Key applications include industrial automation, autonomous vehicles, and intelligent healthcare monitoring, where instantaneous decision-making is critical. For instance, in a smart manufacturing setting, computer vision sensing is used for on-device quality control, reducing defect rates and minimizing reliance on centralized cloud infrastructure.
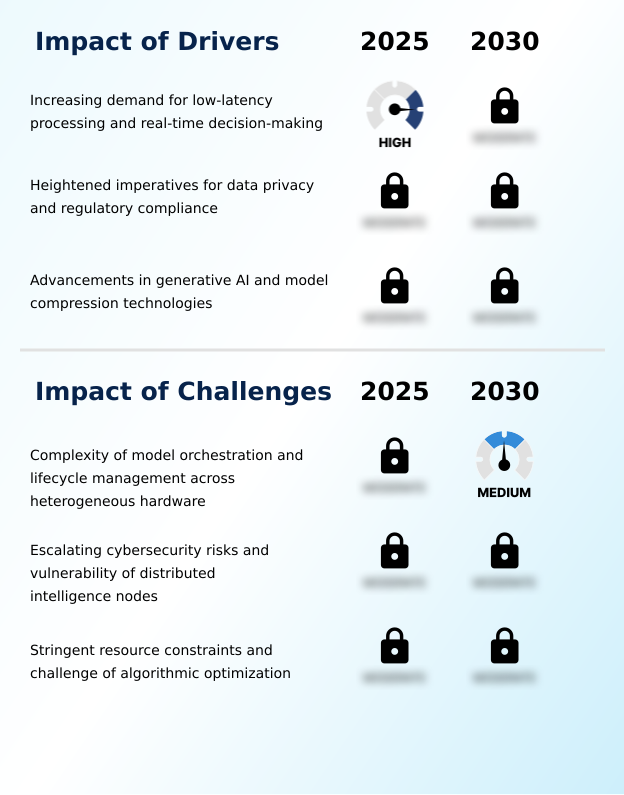
- The market's evolution is also shaped by advancements in model compression and the rise of small language models, which allow sophisticated AI to run on resource-constrained devices. However, challenges related to hardware fragmentation and cybersecurity for distributed intelligence nodes persist, requiring robust AI workload orchestration and security protocols.
- As enterprises scale their IoT deployments, the role of edge-native software in delivering efficient, secure, and responsive intelligence becomes increasingly indispensable for maintaining a competitive advantage.
What will be the Size of the Edge AI Software Market during the forecast period?
Get Key Insights on Market Forecast (PDF) Get Free Sample
How is the Edge AI Software Market Segmented?
The edge ai software industry research report provides comprehensive data (region-wise segment analysis), with forecasts and estimates in "USD million" for the period 2026-2030, as well as historical data from 2020-2024 for the following segments.
- Component
- Solutions
- Services
- Deployment
- Cloud
- On premises
- Hybrid
- Application
- Smart manufacturing
- Predictive maintenance
- Intelligent surveillance and monitoring
- Autonomous vehicles
- Others
- Geography
- North America
- US
- Canada
- Mexico
- Europe
- Germany
- UK
- France
- APAC
- China
- Japan
- India
- Middle East and Africa
- Saudi Arabia
- UAE
- South Africa
- South America
- Brazil
- Argentina
- Rest of World (ROW)
- North America
By Component Insights
The solutions segment is estimated to witness significant growth during the forecast period.
The solutions segment is central to the edge AI software market, providing the foundational frameworks for local machine learning inference. These offerings encompass everything from AI acceleration hardware and lightweight AI inference engines to comprehensive edge analytics solutions.
By enabling autonomous AI deployment, these platforms address the need for decentralized computing architectures, moving processing to the network periphery. Through advanced AI model optimization and predictive maintenance software, enterprises can achieve significant operational gains.
For instance, optimized AI inference has been shown to reduce decision latency by over 90% in manufacturing environments.
This segment delivers the compact neural networks and edge-native software necessary for running sophisticated algorithms on local devices, forming the core of modern intelligent systems.
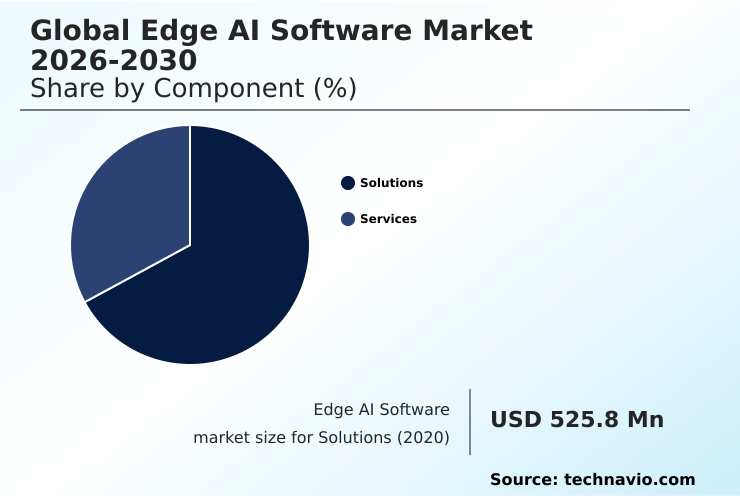
The Solutions segment was valued at USD 1.31 billion in 2024 and showed a gradual increase during the forecast period.
Regional Analysis
North America is estimated to contribute 44.9% to the growth of the global market during the forecast period.Technavio’s analysts have elaborately explained the regional trends and drivers that shape the market during the forecast period.
See How Edge AI Software Market Demand is Rising in North America Get Free Sample
The geographic landscape of the edge AI software market is led by North America, which accounts for over 36% of the market and is projected to contribute nearly 44.9% of the incremental growth.
This dominance is driven by advanced AI-powered video analytics and the development of neural processing units. Europe follows, with a strong focus on industrial applications and data sovereignty.
Meanwhile, the APAC region is the fastest-growing market, with significant adoption in smart cities and manufacturing, leveraging technologies like sensor fusion and path planning.
The development of sophisticated AI video surveillance software and on-device AI acceleration is particularly pronounced in this region.
The focus on end-to-end computer vision and specialized edge AI development platforms is a global phenomenon, with applications in retail AI analytics and edge AI in healthcare monitoring becoming key differentiators across all major geographies.
Market Dynamics
Our researchers analyzed the data with 2025 as the base year, along with the key drivers, trends, and challenges. A holistic analysis of drivers will help companies refine their marketing strategies to gain a competitive advantage.
- Strategic decision-making in the edge AI software market requires a nuanced understanding of the benefits of edge AI vs cloud AI, particularly regarding latency and data privacy. For stakeholders learning how to deploy AI models on edge devices, the primary focus is on optimizing neural networks for edge hardware, a process critical for enabling real-time video analytics using edge AI.
- However, this transition is not without its hurdles, as security challenges in edge AI deployments remain a significant concern, demanding robust solutions. The best platforms for edge AI development are those that simplify managing AI model lifecycle at the edge, addressing the challenges of heterogeneous hardware in edge AI.
- Practical applications are expanding rapidly; firms implementing predictive maintenance with edge AI report operational efficiency gains exceeding those of cloud-only models by over 25%. Use cases like edge AI software for manufacturing quality control and computer vision on low-power devices are becoming standard.
- Concurrently, the rise of agentic AI for industrial process automation and small language models for on-device applications highlights the technology's growing sophistication. The role of 5G in enabling edge AI is crucial, providing the connectivity needed for advanced systems in autonomous driving and edge AI software for remote patient monitoring.
- As the market matures, hardware accelerators for edge AI and solutions for deploying generative AI on IoT devices will become even more critical for delivering next-generation capabilities in smart retail stores and other connected environments.
What are the key market drivers leading to the rise in the adoption of Edge AI Software Industry?
- The primary market driver is the increasing demand for low-latency processing and real-time decision-making capabilities in mission-critical applications.
- The market is primarily driven by the critical need for real-time decision-making and low-latency processing, which traditional cloud architectures cannot guarantee. By enabling localized data processing, edge AI frameworks facilitate AI-driven automation and support the deployment of autonomous systems software.
- This push for decentralized intelligence is heavily influenced by data sovereignty requirements and the need for privacy-preserving AI, reducing the attack surface by keeping sensitive information off public networks.
- The adoption of generative AI on edge devices has unlocked new capabilities, with some implementations reducing data transmission costs by over 60%.
- This shift away from the cloud minimizes latency to mere milliseconds, a vital requirement for distributed intelligence nodes in mission-critical sectors and reinforces edge computing security.
What are the market trends shaping the Edge AI Software Industry?
- A defining market trend is the proliferation of agentic AI. This shift enables autonomous edge orchestration for independent reasoning and task execution at the network periphery.
- A defining trend is the maturation of agentic AI, which facilitates autonomous edge orchestration and complex agentic AI workflows. The development of small language models and advanced model compression techniques now enables sophisticated on-device generative AI, with some platforms achieving a tenfold increase in machine learning performance on resource-constrained AI hardware.
- This shift supports the deployment of intelligent surveillance systems and embedded AI systems capable of on-device natural language processing. Consequently, computer vision sensing is becoming more prevalent in AI for IoT devices, where hardware-agnostic runtime environments are critical for scalability.
- This evolution is pivotal as enterprises increasingly integrate AI into operational technology, with industry analyses indicating that over 40% of new applications will feature autonomous capabilities.
What challenges does the Edge AI Software Industry face during its growth?
- A key challenge affecting industry growth is the complexity of model orchestration and lifecycle management across diverse and heterogeneous hardware environments.
- A primary challenge is managing model lifecycle management and over-the-air updates across vast fleets of heterogeneous hardware. The complexity of AI workload orchestration for industrial IoT analytics is significant, with developers needing to ensure real-time AI inference on devices with varying resource constraints.
- This fragmentation makes scaling solutions for applications like autonomous mobile robots software and smart grid AI software difficult. The adoption of tiny machine learning (TinyML) helps, but the trade-off between model accuracy and resource usage remains. For instance, running advanced AI in autonomous vehicles can consume up to 30% of the vehicle's processing budget.
- This constraint hinders the widespread deployment of edge AI for industrial automation, where consistent performance is non-negotiable.
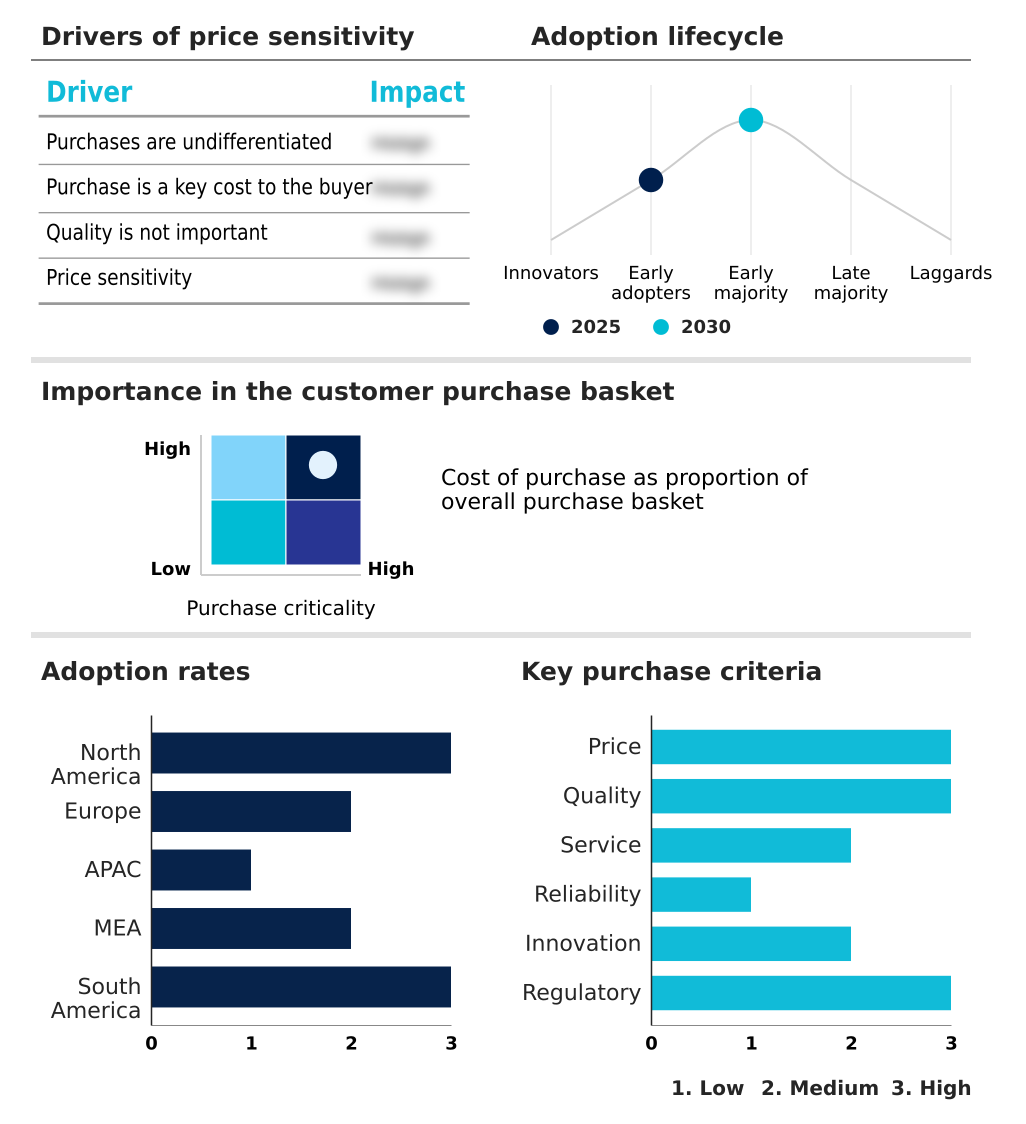
Exclusive Technavio Analysis on Customer Landscape
The edge ai software market forecasting report includes the adoption lifecycle of the market, covering from the innovator’s stage to the laggard’s stage. It focuses on adoption rates in different regions based on penetration. Furthermore, the edge ai software market report also includes key purchase criteria and drivers of price sensitivity to help companies evaluate and develop their market growth analysis strategies.
Customer Landscape of Edge AI Software Industry
Competitive Landscape
Companies are implementing various strategies, such as strategic alliances, edge ai software market forecast, partnerships, mergers and acquisitions, geographical expansion, and product/service launches, to enhance their presence in the industry.
Amazon Web Services Inc. - Key offerings include platforms for building and managing intelligent edge applications, facilitating real-time data analytics and decentralized AI model deployment at the network periphery.
The industry research and growth report includes detailed analyses of the competitive landscape of the market and information about key companies, including:
- Amazon Web Services Inc.
- Arm Ltd.
- Axelera AI
- Baidu Inc.
- Canonical Ltd.
- ClearBlade Inc.
- Edgeimpulse Inc.
- Google LLC
- Gorilla Technology Group Inc
- Hewlett Packard Enterprise Co.
- IBM Corp.
- Intel Corp.
- Latent AI Inc.
- Microsoft Corp.
- NVIDIA Corp.
- Oracle Corp.
- PTC Inc.
- Qualcomm Inc.
- Synaptics Inc.
- Viso AI AG
Qualitative and quantitative analysis of companies has been conducted to help clients understand the wider business environment as well as the strengths and weaknesses of key industry players. Data is qualitatively analyzed to categorize companies as pure play, category-focused, industry-focused, and diversified; it is quantitatively analyzed to categorize companies as dominant, leading, strong, tentative, and weak.
Recent Development and News in Edge ai software market
- In January, 2025, Qualcomm Technologies and Amazon collaborated to integrate the Snapdragon Cockpit Platform with sophisticated cloud and AI capabilities to enhance in-car experiences.
- In February, 2025, Arm launched its Armv9 Edge AI Platform, featuring the Cortex-A320 processor and Ethos-U85 neural processing unit (NPU), designed to deliver a tenfold increase in machine learning performance for Internet of Things applications.
- In March, 2025, Qualcomm announced that it had entered into an agreement to acquire Edge Impulse, an end-to-end edge AI development platform, to strengthen its capabilities in AI and IoT transformation.
- In March, 2025, Intel Corp accelerated AI at the edge through an open ecosystem by launching Intel AI Edge Systems, Edge AI Suites, and the Open Edge Platform software.
Dive into Technavio’s robust research methodology, blending expert interviews, extensive data synthesis, and validated models for unparalleled Edge AI Software Market insights. See full methodology.
| Market Scope | |
|---|---|
| Page number | 306 |
| Base year | 2025 |
| Historic period | 2020-2024 |
| Forecast period | 2026-2030 |
| Growth momentum & CAGR | Accelerate at a CAGR of 34.8% |
| Market growth 2026-2030 | USD 8412.6 million |
| Market structure | Fragmented |
| YoY growth 2025-2026(%) | 28.9% |
| Key countries | US, Canada, Mexico, Germany, UK, France, Italy, Spain, The Netherlands, China, Japan, India, South Korea, Australia, Indonesia, Saudi Arabia, UAE, South Africa, Israel, Turkey, Brazil, Argentina and Chile |
| Competitive landscape | Leading Companies, Market Positioning of Companies, Competitive Strategies, and Industry Risks |
Research Analyst Overview
- The edge AI software market is rapidly advancing beyond basic data filtering, driven by the integration of agentic AI and small language models into diverse operational environments. This evolution is predicated on hardware and software co-design, where optimized AI inference is tailored for specific neural processing units to enable sophisticated on-device generative AI.
- The deployment of predictive maintenance software and intelligent surveillance systems demonstrates the technology's practical value, with some industrial users reducing unplanned downtime by up to 40% through localized data processing. Key technologies such as model compression, quantization and pruning, and knowledge distillation are critical for fitting powerful autonomous systems software onto resource-constrained hardware.
- Applications are expanding from industrial IoT analytics to autonomous systems requiring complex sensor fusion and path planning. The management of this distributed intelligence relies on advanced AI workload orchestration and robust model lifecycle management to handle over-the-air updates across heterogeneous hardware.
- As on-device AI acceleration becomes standard, the focus shifts to ensuring real-time AI inference while upholding data sovereignty and managing cybersecurity risks across decentralized intelligence networks.
What are the Key Data Covered in this Edge AI Software Market Research and Growth Report?
-
What is the expected growth of the Edge AI Software Market between 2026 and 2030?
-
USD 8.41 billion, at a CAGR of 34.8%
-
-
What segmentation does the market report cover?
-
The report is segmented by Component (Solutions, and Services), Deployment (Cloud, On premises, and Hybrid), Application (Smart manufacturing, Predictive maintenance, Intelligent surveillance and monitoring, Autonomous vehicles, and Others) and Geography (North America, Europe, APAC, Middle East and Africa, South America)
-
-
Which regions are analyzed in the report?
-
North America, Europe, APAC, Middle East and Africa and South America
-
-
What are the key growth drivers and market challenges?
-
Increasing demand for low-latency processing and real-time decision-making, Complexity of model orchestration and lifecycle management across heterogeneous hardware
-
-
Who are the major players in the Edge AI Software Market?
-
Amazon Web Services Inc., Arm Ltd., Axelera AI, Baidu Inc., Canonical Ltd., ClearBlade Inc., Edgeimpulse Inc., Google LLC, Gorilla Technology Group Inc, Hewlett Packard Enterprise Co., IBM Corp., Intel Corp., Latent AI Inc., Microsoft Corp., NVIDIA Corp., Oracle Corp., PTC Inc., Qualcomm Inc., Synaptics Inc. and Viso AI AG
-
Market Research Insights
- Market dynamics are increasingly shaped by the move toward sophisticated on-device natural language processing and agentic AI workflows. The adoption of resource-constrained AI is accelerating, with embedded AI systems now capable of running complex tasks previously limited to the cloud. This evolution in edge AI frameworks supports AI-driven automation across sectors.
- For example, some industrial firms have achieved a 35% improvement in operational efficiency by deploying AI for IoT devices for predictive maintenance. The focus on privacy-preserving AI is also a significant factor, with enterprises prioritizing solutions that process data locally.
- As a result, the market for robotics AI platforms and AI-enhanced driver-assistance systems is expanding, supported by hardware-agnostic runtime environments that ensure broad compatibility and faster deployment cycles.
We can help! Our analysts can customize this edge ai software market research report to meet your requirements.
 RIA -
RIA - 
