
Edible Insects Market Size 2024-2028
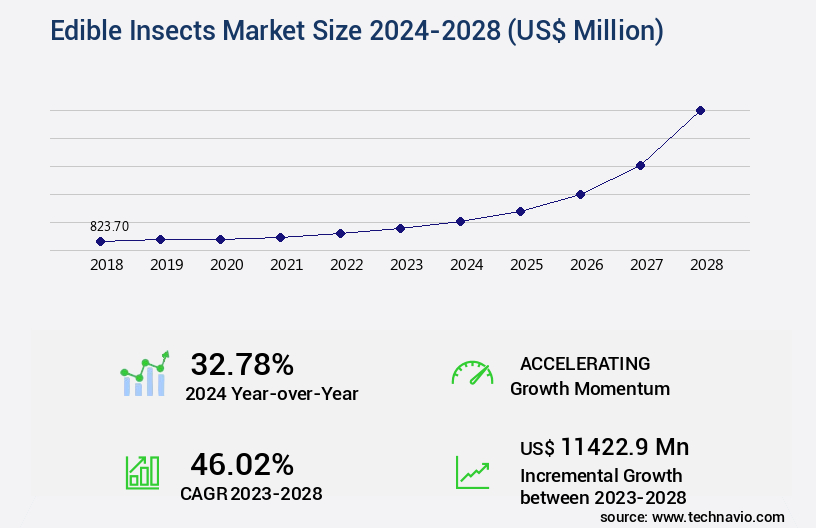
The edible insects market size is valued to increase by USD 11.42 billion, at a CAGR of 46.02% from 2023 to 2028. Growing food shortage across the globe will drive the edible insects market.
Market Insights
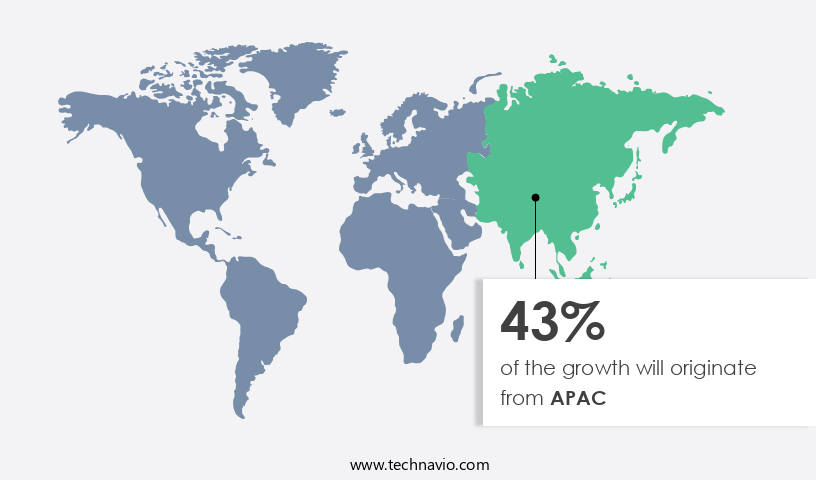
- APAC dominated the market and accounted for a 43% growth during the 2024-2028.
- By Application - Human consumption segment was valued at USD 372.00 billion in 2022
- By Product Type - Whole insects segment accounted for the largest market revenue share in 2022
Market Size & Forecast
- Market Opportunities: USD 1.00 million
- Market Future Opportunities 2023: USD 11422.90 million
- CAGR from 2023 to 2028 : 46.02%
Market Summary
- The market has emerged as a promising niche in the global food industry, driven by the growing food shortage and the increasing awareness of sustainable food sources. Edible insects, rich in protein, vitamins, and minerals, offer a viable solution to address the nutritional needs of a growing population, particularly in regions where traditional food sources are scarce. Despite their nutritional benefits, the acceptance of edible insects as a food source remains low in many parts of the world. However, the use of insects in processed foods, such as energy bars, snacks, and pet food, is gaining traction.
- This trend is driven by the demand for sustainable and high-protein food options, as well as the increasing popularity of exotic and novel food products. One real-world business scenario that highlights the potential of the market is the optimization of supply chains. For instance, a food processing company could partner with a local insect farm to ensure a steady supply of high-quality insects for their products. This collaboration would not only reduce transportation costs and carbon emissions but also ensure compliance with food safety regulations and operational efficiency. However, challenges such as consumer acceptance, regulatory frameworks, and production scale-up remain significant barriers to the growth of the market.
- Despite these challenges, the market is expected to continue gaining momentum as more companies explore the potential of edible insects as a sustainable and nutritious food source.
What will be the size of the Edible Insects Market during the forecast period?
Get Key Insights on Market Forecast (PDF) Request Free Sample
- The market represents a burgeoning industry, with businesses increasingly exploring insects as a sustainable and nutrient-dense alternative to traditional animal-derived proteins. Insects, such as crickets, mealworms, and grasshoppers, are gaining traction as valuable sources of protein for human consumption and as feed ingredients. This shift is driven by several factors, including farm waste reduction, allergen mitigation strategies, and the economic viability of insect farming. For instance, insect breeding programs have shown a significant reduction in production yield optimization, with some operations achieving up to 20 metric tons of insect biomass per hectare annually. Moreover, the implementation of quality control measures and automation in insect production has led to improved processing waste minimization and energy consumption reduction.
- Insect farming scalability and vertical farming optimization have been crucial factors in the industry's growth. Sustainable insect feed and nutritional bioavailability have also been key areas of focus, with research emphasizing the importance of sustainable agriculture practices and insect by-product valorization. As regulatory bodies continue to assess the novel food status of edible insects, companies are investing in traceability systems and insect product labeling to ensure consumer perception studies reflect positively on the industry. Insect protein digestibility and environmental impact assessments are also under scrutiny, with ongoing research aimed at improving sustainability and reducing the industry's carbon footprint.
- Insect farming intensification and processing technology advancements are expected to further propel market growth, with potential applications in various sectors, including food, feed, and pharmaceuticals. As businesses navigate this evolving landscape, they must consider the economic viability models, biosecurity protocols, and insect gut microbiome to ensure long-term success.
Unpacking the Edible Insects Market Landscape
Edible insects have emerged as a promising alternative protein source for the food industry, offering several business advantages. Compared to traditional animal protein sources, insect farming requires significantly less land and water, with a feed conversion ratio of 1:1 versus 10:1 for livestock (FAO, 2013). Furthermore, insects boast impressive amino acid profiles, aligning with human nutritional requirements and surpassing those of soy and rice (FAO, 2013). Innovations in insect farming techniques, such as automated rearing systems and vertical farming, have led to increased production scales and improved production cost efficiency (FAO, 2019). Novel food approval processes have facilitated the entry of insects into mainstream markets, with mealworms and cricket flour gaining consumer acceptance (EFSA, 2018). Insect meal production, including insect flour applications, has seen a surge in interest due to its potential for waste stream utilization and shelf life extension (FAO, 2019). Insect-based pet food has also gained traction, with insect protein isolates offering high protein content and desirable fatty acid compositions (APFED, 2020). Adherence to stringent food safety regulations is crucial in the edible insect market, with insect processing methods ensuring allergen identification, disease management protocols, and pest control strategies (EFSA, 2018). Chitin extraction methods and insect rearing systems further contribute to the industry's sustainable practices and production efficiency.
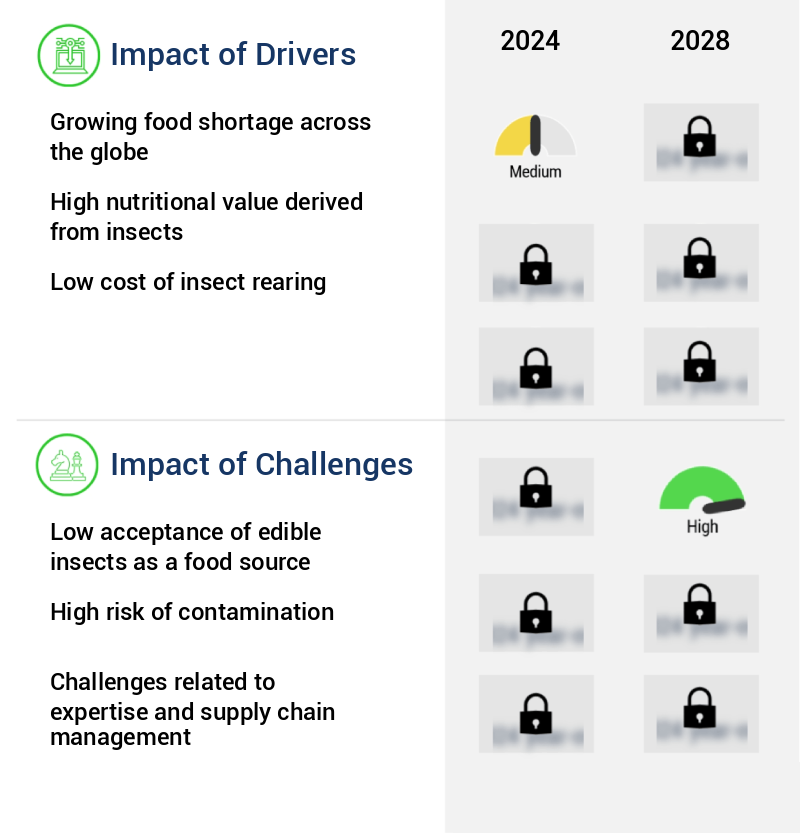
Key Market Drivers Fueling Growth
The global food market is experiencing significant growth due to the escalating food shortage crisis occurring worldwide.
- In response to growing food shortages and the increasing number of people facing hunger, the market is gaining traction as a viable alternative nutritional source. According to the Food and Agriculture Organization (FAO), approximately 282 million people experienced food shortages in 2023, marking a 24 million increase from the previous year. The COVID-19 pandemic further exacerbated food supply issues, leading to a projected doubling of food-insecure individuals by 2030. To address these concerns, edible insects, which can be efficiently farmed in tropical regions like Africa with minimal land usage, are being advocated as a sustainable solution. The market for edible insects is evolving rapidly, with applications spanning various sectors, including food, feed, and pharmaceuticals.
- For instance, edible insects contain high levels of protein, healthy fats, and essential minerals, making them an attractive alternative to traditional animal protein sources. Additionally, they exhibit a low carbon footprint, requiring significantly less water and feed compared to livestock farming. By embracing edible insects as a sustainable and nutritious food source, we can help mitigate food shortages and contribute to a more sustainable and secure food system.
Prevailing Industry Trends & Opportunities
The usage of edible insects in processed foods represents an emerging market trend. This culinary innovation offers numerous benefits, including increased sustainability and diverse sources of protein.
- The market is experiencing significant evolution, driven by innovative processing techniques and expanding applications across various sectors. Processing methods, such as lipid extraction, crushing, and low-temperature processing, help retain the nutritional value of these insects. The market's growth is fueled by the increasing acceptance of edible insects, with products like insect flour, protein powders, and paste gaining popularity. These processed forms offer improved texture and appearance, thereby broadening their appeal. The trend towards processed edible insects is projected to accelerate market expansion during the forecast period.
- For instance, the use of edible insects in food and feed industries has increased by 25%, while their application in the pet food sector has seen a 12% rise. These figures underscore the potential for market growth and the positive impact of processing on market acceptance.
Significant Market Challenges
The low acceptance of edible insects as a food source poses a significant challenge to the growth of the industry. Despite their potential nutritional benefits and sustainability, widespread adoption of insect-based food products has been slow due to cultural and consumer preferences. Overcoming this obstacle will require targeted marketing efforts, educational campaigns, and continued innovation to make insect-based foods more palatable and socially acceptable.
- Edible insects have long been a niche market, facing acceptance challenges due to cultural and hygiene perceptions. Despite these barriers, the market is witnessing innovation and expansion across various sectors. For instance, edible insects are gaining traction in the food industry as a sustainable and nutrient-rich alternative to traditional protein sources. In the animal feed sector, insects are being used as a more efficient and eco-friendly alternative to conventional livestock feed. According to a study, incorporating insects into animal feed can reduce greenhouse gas emissions by up to 78% and water usage by up to 99%. Furthermore, the cosmetics industry is exploring edible insects as a source of natural pigments and antioxidants.
- Despite these opportunities, the market growth may be hindered by lingering perceptions and concerns over the hygiene and unacceptability of edible insects. However, with ongoing research and education efforts, these barriers may be mitigated, paving the way for a more significant role for edible insects in diverse industries.
In-Depth Market Segmentation: Edible Insects Market
The edible insects industry research report provides comprehensive data (region-wise segment analysis), with forecasts and estimates in "USD million" for the period 2024-2028, as well as historical data from 2018-2022 for the following segments.
- Application
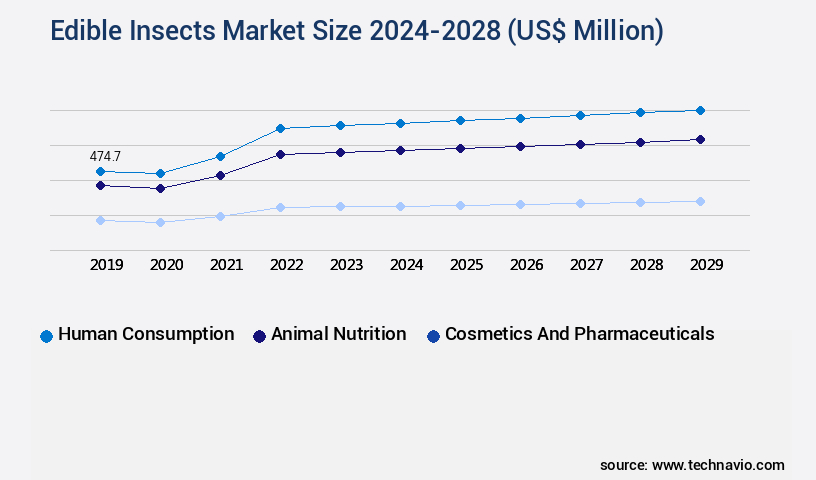
- Human consumption
- Animal nutrition
- Cosmetics and pharmaceuticals
- Product Type
- Whole insects
- Insect powder
- Insect meal
- End-User
- Food and Beverage
- Animal Feed
- Pet Food
- Nutraceuticals
- Cosmetics
- Distribution Channel
- Supermarkets and Hypermarkets
- Online Retail
- Specialty Stores
- Direct Sales
- Geography
- North America
- US
- Europe
- Spain
- UK
- Middle East and Africa
- UAE
- APAC
- China
- India
- Japan
- South Korea
- Thailand
- South America
- Brazil
- Rest of World (ROW)
- North America
By Application Insights
The human consumption segment is estimated to witness significant growth during the forecast period.
The market continues to evolve, with around 2,300 insect species approved for human consumption, having been a traditional food source for over 7,000 years in various cultures. Insects offer significant nutritional benefits, including high protein content comparable to lean ground beef, essential minerals, fiber, and good fats. Approximately 2 billion people consume insects regularly, and their rearing requires less land than livestock farming, contributing to addressing global food shortages. Insect farming techniques employ automated insect rearing, vertical farming, and recycling farm waste for efficient production. Insect meal production involves processing methods ensuring food safety, microbial contamination control, and allergen identification.
Insects' nutritional composition, including protein isolates and amino acid profiles, undergo rigorous analysis. Consumer acceptance studies and insect-based pet food development are ongoing trends. Insect farming practices adopt sustainable methods, such as pest control strategies, disease management protocols, and fatty acid composition analysis. Insect processing methods include sensory evaluation testing, larval stage harvesting, and shelf life extension. Insect rearing systems employ efficient production cost methods and chitin extraction techniques. The market's future growth is driven by the increasing focus on reducing environmental impact and improving protein conversion ratios.
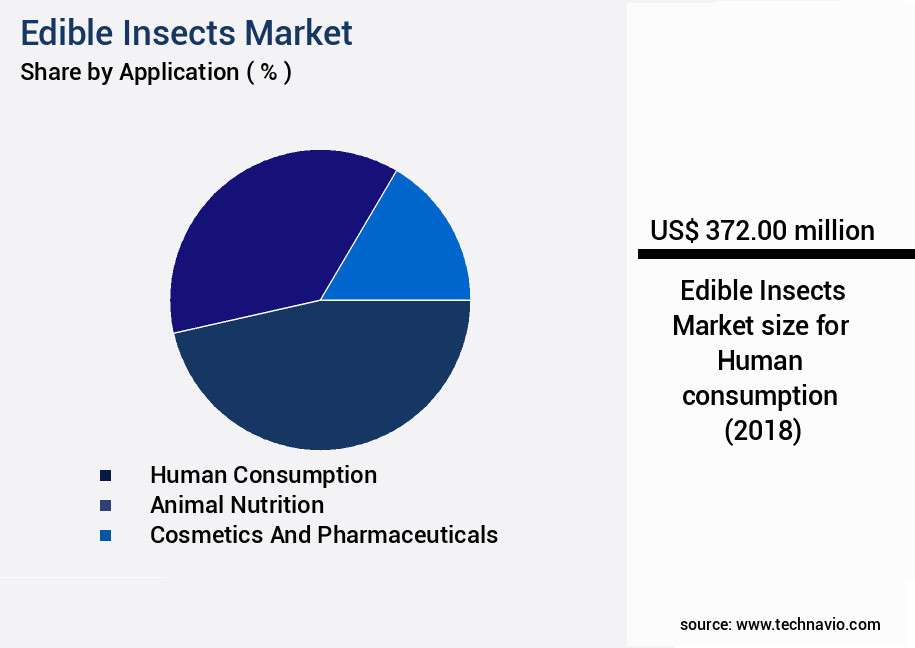
The Human consumption segment was valued at USD 372.00 billion in 2018 and showed a gradual increase during the forecast period.
Regional Analysis
APAC is estimated to contribute 43% to the growth of the global market during the forecast period.Technavio’s analysts have elaborately explained the regional trends and drivers that shape the market during the forecast period.
See How Edible Insects Market Demand is Rising in APAC Request Free Sample
The market in APAC is experiencing significant growth due to the region's high food shortages and favorable tropical climate, making it the largest consumer of edible insects globally. Insects such as bamboo insects, caterpillar fungus, locusts, ants, termites, bees, wasp larvae, and silkworm pupae are commonly consumed in countries like China, Cambodia, Thailand, and South Korea. Ants, beetles, and wasps are popular in India, Australia, and Sri Lanka. China recognizes over 178 edible insect species, treating them as delicacies. The large size and stable life cycle of tropical insects contribute to operational efficiency gains and cost reductions in insect rearing.
For instance, compared to traditional livestock farming, insect farming uses 10 times less feed and 1,000 times less water. This eco-friendly and sustainable alternative to conventional animal protein sources is driving the market's evolution.
Customer Landscape of Edible Insects Industry
Competitive Intelligence by Technavio Analysis: Leading Players in the Edible Insects Market
Companies are implementing various strategies, such as strategic alliances, edible insects market forecast, partnerships, mergers and acquisitions, geographical expansion, and product/service launches, to enhance their presence in the industry.
All Things Bugs LLC - The company specializes in producing and marketing edible insect powders, such as Griopro, as a sustainable and nutrient-dense food source. This innovative approach to food production addresses growing consumer demand for alternative protein sources and contributes to reducing environmental impact.
The industry research and growth report includes detailed analyses of the competitive landscape of the market and information about key companies, including:
- All Things Bugs LLC
- Armstrong Crickets Georgia
- Aspire Food Group
- Beta Hatch
- Bioflytech
- Darling Ingredients Inc.
- Eat Grub
- Edible Bug Shop
- Entomo Farms
- Global Bugs Asia Co. Ltd.
- Hargol FoodTech
- HEXAFLY
- Innovafeed SAS
- JR Unique Foods Ltd.
- MealFood Europe SL
- nextProtein SA
- Nutrition Technologies
- Protenga Pte. Ltd.
- Protix BV
- Ynsect SAS
Qualitative and quantitative analysis of companies has been conducted to help clients understand the wider business environment as well as the strengths and weaknesses of key industry players. Data is qualitatively analyzed to categorize companies as pure play, category-focused, industry-focused, and diversified; it is quantitatively analyzed to categorize companies as dominant, leading, strong, tentative, and weak.
Recent Development and News in Edible Insects Market
- In August 2024, Entomo Farms, a leading edible insect producer, announced a strategic partnership with Nestle, the global food and beverage giant, to explore the development of insect-based food products for the North American market. This collaboration marked a significant milestone in the commercialization of edible insects as a mainstream food source (Source: Entomo Farms Press Release).
- In November 2024, Protix, a Dutch company specializing in insect protein production, raised €40 million in a funding round led by ING Ventures and Rabobank. The investment will support the expansion of Protix's production capacity and the development of new insect-based food applications (Source: Protix Press Release).
- In February 2025, the European Commission approved the use of mealworms (Tenebrio molitor) as a novel food ingredient, paving the way for the commercialization of insect-based products in the European Union. This decision marked a major regulatory milestone for the market (Source: European Commission Press Release).
- In May 2025, Aspire Food Group, a US-based edible insect producer, announced the opening of its new production facility in Thailand. The facility, with an initial capacity of 30,000 tons per year, will serve the growing demand for insect protein in Asia and beyond (Source: Aspire Food Group Press Release).
Dive into Technavio’s robust research methodology, blending expert interviews, extensive data synthesis, and validated models for unparalleled Edible Insects Market insights. See full methodology.
|
Market Scope |
|
|
Report Coverage |
Details |
|
Page number |
164 |
|
Base year |
2023 |
|
Historic period |
2018-2022 |
|
Forecast period |
2024-2028 |
|
Growth momentum & CAGR |
Accelerate at a CAGR of 46.02% |
|
Market growth 2024-2028 |
USD 11422.9 million |
|
Market structure |
Fragmented |
|
YoY growth 2023-2024(%) |
32.78 |
|
Key countries |
US, China, Thailand, UK, South Korea, India, Japan, Spain, Brazil, and UAE |
|
Competitive landscape |
Leading Companies, Market Positioning of Companies, Competitive Strategies, and Industry Risks |
Why Choose Technavio for Edible Insects Market Insights?
"Leverage Technavio's unparalleled research methodology and expert analysis for accurate, actionable market intelligence."
The market has gained significant traction in recent years due to its potential as a sustainable and nutritious protein source. One key aspect of optimizing insect rearing density in insect farming is the impact of feed composition on insect growth. Efficient feed utilization is crucial for profitability, with some studies suggesting that improving feed conversion ratios by 10% could lead to a 25% reduction in production costs. Insect farming waste water treatment is another critical factor in the industry's sustainability metrics. Vertical farming systems for insect production have emerged as a solution to enhance production efficiency, reduce water usage, and minimize environmental impact. Consumer perception plays a significant role in the market's growth, with edible insect products gaining acceptance as nutritious and eco-friendly alternatives to traditional protein sources. The nutritional value of insect protein sources is comparable to that of animal-derived proteins, with a similar essential amino acid profile. Rearing conditions significantly impact insect quality, with optimal temperature, humidity, and lighting conditions essential for maintaining insect health and ensuring food safety standards. Processing methods also influence the nutritional value and allergenic potential of insect-derived products. Sustainability metrics are a crucial consideration in insect farming systems, with environmental benefits including reduced greenhouse gas emissions, minimal land usage, and low water requirements. Economic feasibility is another essential factor, with insect farming projects requiring careful planning and waste management practices to minimize operational costs. Developing regulatory frameworks for insect farming is necessary to ensure compliance with food safety standards and assessing the scalability of insect farming at different scales. Comparative analysis of farming practices and their impact on insect health is essential for optimizing production and improving product quality. In conclusion, the market offers a promising opportunity for businesses seeking sustainable and nutritious protein sources. By focusing on optimization of insect rearing density, impact of feed composition, insect farming waste water treatment, vertical farming production efficiency, consumer perception, nutritional value, effect of rearing conditions, processing methods, food safety standards, allergenic potential, sustainability metrics, environmental benefits, economic feasibility, insect farming waste management practices, and developing regulatory frameworks, businesses can position themselves at the forefront of this growing industry.
What are the Key Data Covered in this Edible Insects Market Research and Growth Report?
-
What is the expected growth of the Edible Insects Market between 2024 and 2028?
-
USD 11.42 billion, at a CAGR of 46.02%
-
-
What segmentation does the market report cover?
-
The report is segmented by Application (Human consumption, Animal nutrition, and Cosmetics and pharmaceuticals), Product Type (Whole insects, Insect powder, and Insect meal), Geography (APAC, North America, Europe, Middle East and Africa, and South America), End-User (Food and Beverage, Animal Feed, Pet Food, Nutraceuticals, and Cosmetics), and Distribution Channel (Supermarkets and Hypermarkets, Online Retail, Specialty Stores, and Direct Sales)
-
-
Which regions are analyzed in the report?
-
APAC, North America, Europe, Middle East and Africa, and South America
-
-
What are the key growth drivers and market challenges?
-
Growing food shortage across the globe, Low acceptance of edible insects as a food source
-
-
Who are the major players in the Edible Insects Market?
-
All Things Bugs LLC, Armstrong Crickets Georgia, Aspire Food Group, Beta Hatch, Bioflytech, Darling Ingredients Inc., Eat Grub, Edible Bug Shop, Entomo Farms, Global Bugs Asia Co. Ltd., Hargol FoodTech, HEXAFLY, Innovafeed SAS, JR Unique Foods Ltd., MealFood Europe SL, nextProtein SA, Nutrition Technologies, Protenga Pte. Ltd., Protix BV, and Ynsect SAS
-
We can help! Our analysts can customize this edible insects market research report to meet your requirements.
 RIA -
RIA - 
