Insect Protein Market Analysis, Size, and Forecast 2026-2030: Europe (Germany, UK, and France), North America (US, Canada, and Mexico), APAC (China, Japan, and India), Middle East and Africa (Saudi Arabia, UAE, and South Africa), South America (Brazil, Argentina, and Colombia), and Rest of World (ROW)

Insect Protein Market Analysis, Size, and Forecast 2026-2030:
Europe (Germany, UK, and France), North America (US, Canada, and Mexico), APAC (China, Japan, and India), Middle East and Africa (Saudi Arabia, UAE, and South Africa), South America (Brazil, Argentina, and Colombia), and Rest of World (ROW)

Published: Mar 2026 292 Pages SKU: IRTNTR75300

Market Overview at a Glance

$3.60 B
Market Opportunity
38.6%
CAGR 2025 - 2030
35%
Europe Growth
$495.8 Mn
Animal feed segment 2024

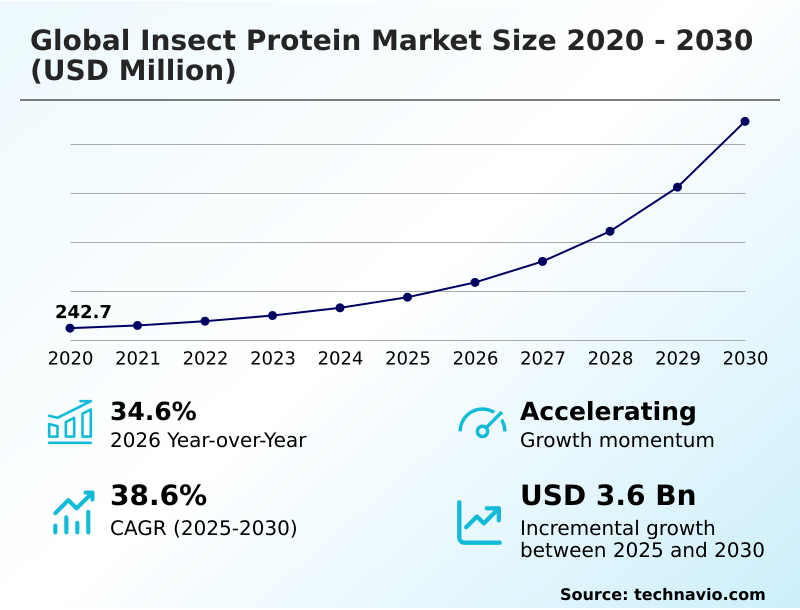
Insect Protein Market Size 2026-2030

The insect protein market size is valued to increase by USD 3.60 billion, at a CAGR of 38.6% from 2025 to 2030. Increasing demand for sustainable protein sources will drive the insect protein market.

Major Market Trends & Insights

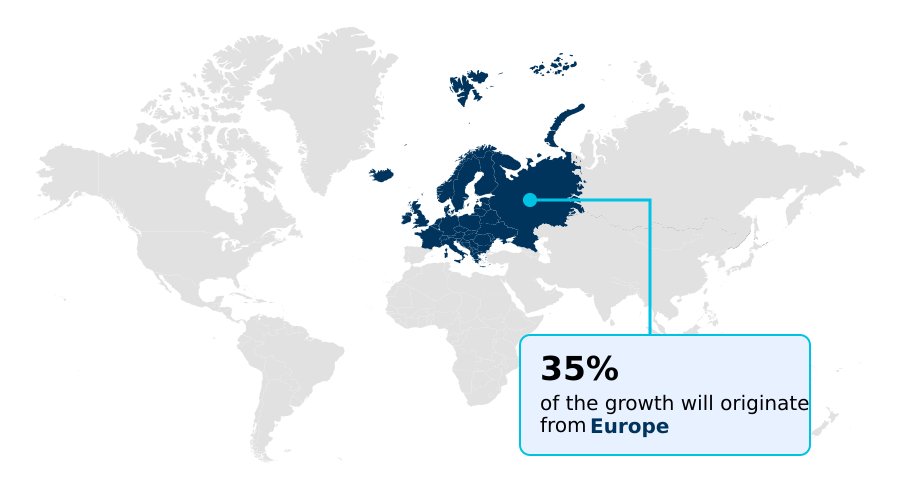
  • Europe dominated the market and accounted for a 35% growth during the forecast period.
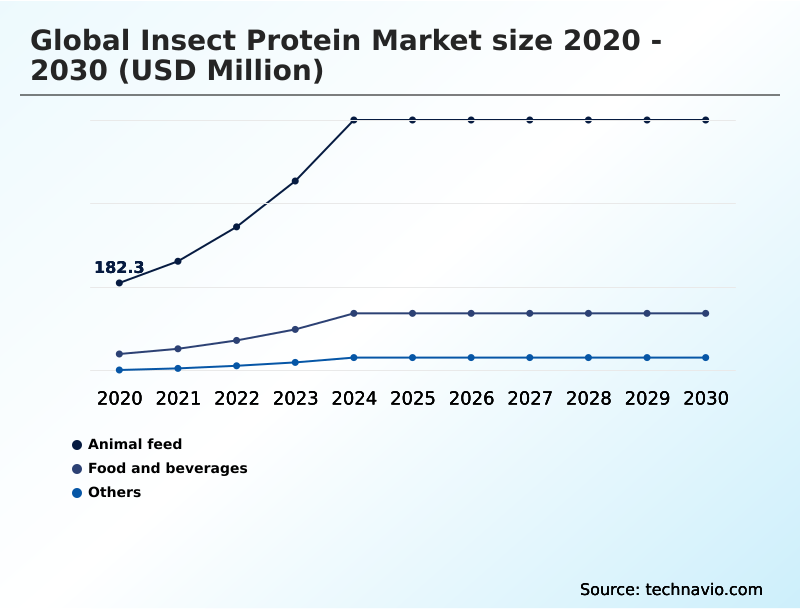
  • By Application - Animal feed segment was valued at USD 495.8 million in 2024
  • By Product - Coleoptera segment accounted for the largest market revenue share in 2024

Market Size & Forecast

  • Market Opportunities: USD 4.23 billion
  • Market Future Opportunities: USD 3.60 billion
  • CAGR from 2025 to 2030 : 38.6%

Market Summary

  • The insect protein market is rapidly advancing beyond niche applications, becoming integral to global food sustainability strategies. This market revolves around the industrial-scale rearing of insects to produce high-value proteins for both human food and animal feed. A key driver is the superior resource efficiency of insect farming compared to traditional livestock, which addresses pressing environmental concerns.
  • Innovations in processing are transforming raw insects into palatable and functional ingredients, such as fine powders and oils, effectively mitigating consumer reluctance. These ingredients are being incorporated into a wide array of products, from sports nutrition supplements to pet food.
  • For instance, in the animal feed sector, a supply chain manager can leverage insect protein to formulate rations that not only reduce dependency on volatile commodities like fishmeal but also improve animal health outcomes due to the protein's high digestibility and unique nutrient profile.
  • This shift is creating a more resilient and circular food system where organic waste streams are upcycled into essential nutrients, demonstrating a practical and scalable solution to future food security challenges.

What will be the Size of the Insect Protein Market during the forecast period?

Get Key Insights on Market Forecast (PDF) Request Free Sample

How is the Insect Protein Market Segmented?

The insect protein industry research report provides comprehensive data (region-wise segment analysis), with forecasts and estimates in "USD million" for the period 2026-2030, as well as historical data from 2020-2024 for the following segments.

  • Application
    • Animal feed
    • Food and beverages
    • Others
  • Product
    • Coleoptera
    • Lepidoptera
    • Hymenoptera
    • Others
  • Distribution channel
    • Offline
    • Online
  • Geography
    • Europe
      • Germany
      • UK
      • France
    • North America
      • US
      • Canada
      • Mexico
    • APAC
      • China
      • Japan
      • India
    • Middle East and Africa
      • Saudi Arabia
      • UAE
      • South Africa
    • South America
      • Brazil
      • Argentina
      • Colombia
    • Rest of World (ROW)

By Application Insights

The animal feed segment is estimated to witness significant growth during the forecast period.

The animal feed segment is the primary force in the insect protein market, addressing the critical need for sustainable inputs in livestock and aquaculture.

The use of black soldier fly larvae is central to this shift, offering superior insect protein digestibility compared to conventional sources.

Advanced insect meal processing and feed formulation optimization are enabling feed manufacturers to integrate these novel ingredients, with some aquaculture operations reporting improvements in feed conversion efficiency of up to 25%.

This insect-based bioconversion of organic waste into high-value protein provides robust animal nutrition solutions.

As the industry focuses on scaling insect production, these proteins are becoming vital for sustainable aquaculture feed and insect feed for poultry, challenging the dominance of traditional ingredients in a direct insect meal vs fishmeal comparison.

Request Free Sample

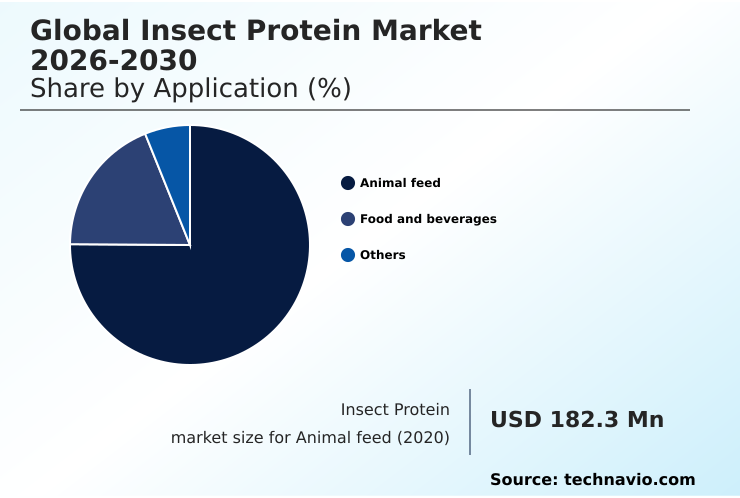
The Animal feed segment was valued at USD 495.8 million in 2024 and showed a gradual increase during the forecast period.

Request Free Sample

Regional Analysis

Europe is estimated to contribute 35% to the growth of the global market during the forecast period.Technavio’s analysts have elaborately explained the regional trends and drivers that shape the market during the forecast period.

See How Insect Protein Market Demand is Rising in Europe Request Free Sample

Europe leads the market, commanding over 35% of the landscape, driven by advanced vertical farming systems and clear regulatory frameworks that boost consumer acceptance of edible insects.

Insect protein startups in the region leverage advanced insect biotechnology for applications like chitin extraction for bioplastics and extracting antimicrobial peptides. Meanwhile, APAC is the fastest-growing region, with its expansion outpacing other regions by nearly 2%.

This growth is fueled by traditional practices like edible grasshopper farming and modern insect biotechnology applications.

North America is also a key market, with a strong focus on investment in insect protein companies developing functional beef-alternative products and perfecting lauric acid extraction from insect oils.

Market Dynamics

Our researchers analyzed the data with 2025 as the base year, along with the key drivers, trends, and challenges. A holistic analysis of drivers will help companies refine their marketing strategies to gain a competitive advantage.

  • Understanding the nuances of the insect protein market requires a deep dive into specific applications and economic considerations. The cost of insect protein production remains a central theme, with ongoing innovations in automating cricket farming systems aiming to achieve price parity with conventional proteins.
  • For instance, a detailed analysis of black soldier fly larvae nutrition reveals its suitability for aquaculture, where its use in insect protein for salmon feed can improve growth rates more effectively than some plant-based alternatives. On the human nutrition side, the nutritional profile of grasshoppers and cricket powder benefits for athletes are driving demand in the wellness sector.
  • A mealworm protein vs whey protein comparison often highlights insects' superior sustainability metrics and complete amino acid profile. Key challenges in scaling insect farming include securing consistent feedstock and navigating the complex landscape of regulatory approval for insect feed.
  • Consequently, investment in insect protein companies is often directed toward those with robust solutions for black soldier fly waste conversion and advanced insect protein extraction techniques. The development of sustainable insect farming practices is paramount for long-term consumer trust and market growth.

What are the key market drivers leading to the rise in the adoption of Insect Protein Industry?

  • The increasing demand for sustainable protein sources, driven by environmental and nutritional concerns, is a primary driver of market growth.

  • The drive for environmental sustainability is a core market catalyst, promoting circular food systems and circular economy food production.
  • The high feed conversion efficiency of insects—achieving a ratio up to 12 times more efficient than traditional livestock—is a compelling economic driver.
  • The process of organic waste bioconversion facilitates nutrient upcycling and food waste valorization, turning low-value streams into high-quality protein.
  • This model of food waste to protein has been shown to reduce land use by over 90% compared to soy cultivation for feed.
  • Furthermore, the high insect protein nutritional value, including prebiotic chitin fiber, positions it as a superior alternative protein source, appealing to health-conscious consumers and driving the adoption of sustainable pet food ingredients.

What are the market trends shaping the Insect Protein Industry?

  • The market is characterized by a significant trend toward product diversification and innovation, expanding the applications and consumer appeal of insect-based ingredients.

  • Product innovation is reshaping the edible insects market, moving beyond basic edible insect powders to sophisticated functional food ingredients. Companies are developing high-purity protein isolates and textured insect protein that mimic traditional meat, improving consumer acceptance. The development of insect-based functional foods has led to a 30% increase in protein content for some snack products.
  • This trend also extends to hypoallergenic pet nutrition, where specialized diets using novel proteins have been shown to reduce common allergenicity triggers by over 40%. The focus is on making insect protein for human consumption more mainstream, with cricket protein powder integrated into familiar items. This strategic diversification highlights the growing benefits of entomophagy.

What challenges does the Insect Protein Industry face during its growth?

  • Inconsistency in government regulations related to the use of insect proteins poses a significant challenge, affecting industry growth and international trade.

  • Navigating fragmented novel food regulations and inconsistent insect farming regulations remains a significant barrier, in some cases adding 18-24 months to market entry timelines for new products. Concurrently, operational hurdles related to the insect protein supply chain and scaling insect production challenge profitability.
  • The high capital expenditure for automated insect rearing and insect farming automation is substantial, although it can reduce labor costs by up to 60% once implemented. Further investment is required in insect protein processing technology, including larvae harvesting technology and dry extrusion processing, to achieve cost-parity with conventional proteins.
  • Perfecting insect meal stabilization and insect protein extraction methods at an industrial scale is critical for market expansion.

Exclusive Technavio Analysis on Customer Landscape

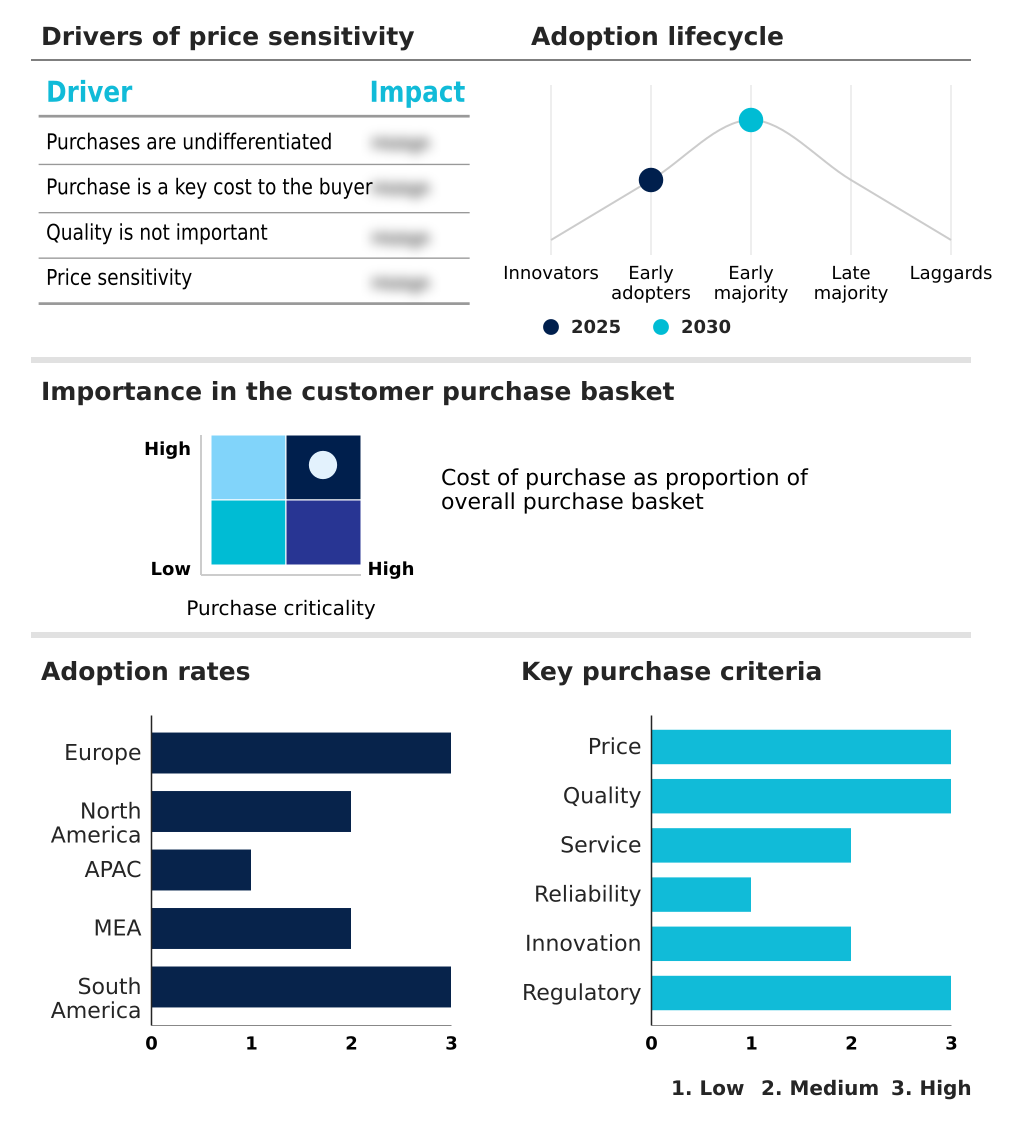
The insect protein market forecasting report includes the adoption lifecycle of the market, covering from the innovator’s stage to the laggard’s stage. It focuses on adoption rates in different regions based on penetration. Furthermore, the insect protein market report also includes key purchase criteria and drivers of price sensitivity to help companies evaluate and develop their market growth analysis strategies.

Customer Landscape of Insect Protein Industry

Competitive Landscape

Companies are implementing various strategies, such as strategic alliances, insect protein market forecast, partnerships, mergers and acquisitions, geographical expansion, and product/service launches, to enhance their presence in the industry.

Agence Scratch - Offers high-quality meal and oil from black soldier fly larvae, providing sustainable, nutrient-rich protein solutions for the global aquaculture industry.

The industry research and growth report includes detailed analyses of the competitive landscape of the market and information about key companies, including:

  • Agence Scratch
  • Agronutris
  • All Things Bugs LLC
  • Aspire Food Group
  • Bugsolutely Ltd.
  • Chapul Farms
  • Darling Ingredients Inc.
  • Divaks Food UAB
  • Entomo Farms
  • Flying spark
  • Hargol FoodTech
  • HEXAFLY
  • HiProMine S.A.
  • Innovafeed SAS
  • MealFood Europe SL
  • Protenga Pvt. Ltd.
  • Protix BV
  • Sentara Group
  • Ynsect SAS

Qualitative and quantitative analysis of companies has been conducted to help clients understand the wider business environment as well as the strengths and weaknesses of key industry players. Data is qualitatively analyzed to categorize companies as pure play, category-focused, industry-focused, and diversified; it is quantitatively analyzed to categorize companies as dominant, leading, strong, tentative, and weak.

Recent Development and News in Insect protein market

  • In February 2025, Insectika Biotech launched new insect protein-based fish feeds, Yum Pro and YuM ToM, developed from black soldier fly larvae for aquaculture applications.
  • In May 2025, Aspire Food Group was placed into receivership by the Superior Court of Ontario, highlighting operational and financial challenges in scaling up large-scale cricket protein production.
  • In July 2025, a Polish biotech firm secured a $10.55 million grant from the European Innovation Council to build an autonomous manufacturing facility for producing insect protein for the premium pet food segment.
  • In September 2025, Innovafeed SAS, BioMar, and Auchan announced a partnership to commercialize insect meal in shrimp feed at scale in Ecuador, integrating it into mainstream supply chains.

Dive into Technavio’s robust research methodology, blending expert interviews, extensive data synthesis, and validated models for unparalleled Insect Protein Market insights. See full methodology.

Market Scope
Page number 292
Base year 2025
Historic period 2020-2024
Forecast period 2026-2030
Growth momentum & CAGR Accelerate at a CAGR of 38.6%
Market growth 2026-2030 USD 3596.7 million
Market structure Fragmented
YoY growth 2025-2026(%) 34.6%
Key countries Germany, UK, France, Italy, Spain, The Netherlands, US, Canada, Mexico, China, Japan, India, South Korea, Australia, Indonesia, Saudi Arabia, UAE, South Africa, Israel, Turkey, Brazil, Argentina and Colombia
Competitive landscape Leading Companies, Market Positioning of Companies, Competitive Strategies, and Industry Risks

Request Free Sample

Research Analyst Overview

  • The insect protein market is defined by its rapid technological evolution and its critical role in building circular food systems. The industrialization of automated insect rearing and insect farming automation is pivotal, with vertical farming systems becoming the standard for efficient, large-scale production.
  • Advances in insect biotechnology are unlocking new value streams, such as chitin extraction and the isolation of antimicrobial peptides, which have applications beyond food and feed. A key trend influencing boardroom decisions is food waste valorization through organic waste bioconversion, which aligns with corporate sustainability mandates and can reduce raw material costs by up to 20%.
  • Companies are focusing on perfecting insect meal processing and larvae harvesting technology to improve insect protein digestibility and ensure consistent quality. This pursuit of efficiency is also seen in the development of textured insect protein and high-purity protein isolates for diverse functional food ingredients, driving the future of entomophagy and sustainable nutrition.

What are the Key Data Covered in this Insect Protein Market Research and Growth Report?

  • What is the expected growth of the Insect Protein Market between 2026 and 2030?

    • USD 3.60 billion, at a CAGR of 38.6%

  • What segmentation does the market report cover?

    • The report is segmented by Application (Animal feed, Food and beverages, and Others), Product (Coleoptera, Lepidoptera, Hymenoptera, and Others), Distribution Channel (Offline, and Online) and Geography (Europe, North America, APAC, Middle East and Africa, South America)

  • Which regions are analyzed in the report?

    • Europe, North America, APAC, Middle East and Africa and South America

  • What are the key growth drivers and market challenges?

    • Increasing demand for sustainable protein sources, Inconsistency in government regulations related to insect proteins

  • Who are the major players in the Insect Protein Market?

    • Agence Scratch, Agronutris, All Things Bugs LLC, Aspire Food Group, Bugsolutely Ltd., Chapul Farms, Darling Ingredients Inc., Divaks Food UAB, Entomo Farms, Flying spark, Hargol FoodTech, HEXAFLY, HiProMine S.A., Innovafeed SAS, MealFood Europe SL, Protenga Pvt. Ltd., Protix BV, Sentara Group and Ynsect SAS

Market Research Insights

  • Market dynamics are increasingly shaped by the dual pursuit of nutritional value and sustainability. The growing adoption of insect-based animal nutrition has resulted in feed conversion efficiency gains of over 15% in some poultry operations compared to soy-based diets.
  • As companies explore insect protein processing technology, they are creating a wider array of sustainable pet food ingredients that cater to rising consumer demand for eco-friendly products. This has led to a 25% reduction in ingredient-related allergen issues in certain hypoallergenic pet food lines.
  • The expansion of the edible insects market is supported by strategic investments in insect protein startups, which focus on scaling production and optimizing the insect protein supply chain. This strategic focus is essential for meeting the demands of both human consumption and large-scale feed applications.

We can help! Our analysts can customize this insect protein market research report to meet your requirements.

Get in touch

1. Executive Summary

1.1 Market overview

Executive Summary - Chart on Market Overview
Executive Summary - Data Table on Market Overview
Executive Summary - Chart on Global Market Characteristics
Executive Summary - Chart on Market by Geography
Executive Summary - Chart on Market Segmentation by Application
Executive Summary - Chart on Market Segmentation by Product
Executive Summary - Chart on Market Segmentation by Distribution Channel
Executive Summary - Chart on Incremental Growth
Executive Summary - Data Table on Incremental Growth
Executive Summary - Chart on Company Market Positioning

2. Technavio Analysis

2.1 Analysis of price sensitivity, lifecycle, customer purchase basket, adoption rates, and purchase criteria

2.2 Criticality of inputs and Factors of differentiation

Chart on Overview on criticality of inputs and factors of differentiation

2.3 Factors of disruption

Chart on Overview on factors of disruption

2.4 Impact of drivers and challenges

Chart on Impact of drivers and challenges in 2025 and 2030

3. Market Landscape

3.1 Market ecosystem

Chart on Parent Market
Data Table on - Parent Market

3.2 Market characteristics

Chart on Market characteristics analysis

3.3 Value chain analysis

Chart on Value chain analysis

4. Market Sizing

4.1 Market definition

Data Table on Offerings of companies included in the market definition

4.2 Market segment analysis

Market segments

4.3 Market size 2025

4.4 Market outlook: Forecast for 2025-2030

Chart on Global - Market size and forecast 2025-2030 ($ million)
Data Table on Global - Market size and forecast 2025-2030 ($ million)
Chart on Global Market: Year-over-year growth 2025-2030 (%)
Data Table on Global Market: Year-over-year growth 2025-2030 (%)

5. Historic Market Size

5.1 Global Insect Protein Market 2020 - 2024

Historic Market Size - Data Table on Global Insect Protein Market 2020 - 2024 ($ million)

5.2 Application segment analysis 2020 - 2024

Historic Market Size - Application Segment 2020 - 2024 ($ million)

5.3 Product segment analysis 2020 - 2024

Historic Market Size - Product Segment 2020 - 2024 ($ million)

5.4 Distribution Channel segment analysis 2020 - 2024

Historic Market Size - Distribution Channel Segment 2020 - 2024 ($ million)

5.5 Geography segment analysis 2020 - 2024

Historic Market Size - Geography Segment 2020 - 2024 ($ million)

5.6 Country segment analysis 2020 - 2024

Historic Market Size - Country Segment 2020 - 2024 ($ million)

6. Qualitative Analysis

6.1 AI Impact on Global Insect Protein Market

7. Five Forces Analysis

7.1 Five forces summary

Five forces analysis - Comparison between 2025 and 2030

7.2 Bargaining power of buyers

Bargaining power of buyers - Impact of key factors 2025 and 2030

7.3 Bargaining power of suppliers

Bargaining power of suppliers - Impact of key factors in 2025 and 2030

7.4 Threat of new entrants

Threat of new entrants - Impact of key factors in 2025 and 2030

7.5 Threat of substitutes

Threat of substitutes - Impact of key factors in 2025 and 2030

7.6 Threat of rivalry

Threat of rivalry - Impact of key factors in 2025 and 2030

7.7 Market condition

Chart on Market condition - Five forces 2025 and 2030

8. Market Segmentation by Application

8.1 Market segments

Chart on Application - Market share 2025-2030 (%)
Data Table on Application - Market share 2025-2030 (%)

8.2 Comparison by Application

Chart on Comparison by Application
Data Table on Comparison by Application

8.3 Animal feed - Market size and forecast 2025-2030

Chart on Animal feed - Market size and forecast 2025-2030 ($ million)
Data Table on Animal feed - Market size and forecast 2025-2030 ($ million)
Chart on Animal feed - Year-over-year growth 2025-2030 (%)
Data Table on Animal feed - Year-over-year growth 2025-2030 (%)

8.4 Food and beverages - Market size and forecast 2025-2030

Chart on Food and beverages - Market size and forecast 2025-2030 ($ million)
Data Table on Food and beverages - Market size and forecast 2025-2030 ($ million)
Chart on Food and beverages - Year-over-year growth 2025-2030 (%)
Data Table on Food and beverages - Year-over-year growth 2025-2030 (%)

8.5 Others - Market size and forecast 2025-2030

Chart on Others - Market size and forecast 2025-2030 ($ million)
Data Table on Others - Market size and forecast 2025-2030 ($ million)
Chart on Others - Year-over-year growth 2025-2030 (%)
Data Table on Others - Year-over-year growth 2025-2030 (%)

8.6 Market opportunity by Application

Market opportunity by Application ($ million)
Data Table on Market opportunity by Application ($ million)

9. Market Segmentation by Product

9.1 Market segments

Chart on Product - Market share 2025-2030 (%)
Data Table on Product - Market share 2025-2030 (%)

9.2 Comparison by Product

Chart on Comparison by Product
Data Table on Comparison by Product

9.3 Coleoptera - Market size and forecast 2025-2030

Chart on Coleoptera - Market size and forecast 2025-2030 ($ million)
Data Table on Coleoptera - Market size and forecast 2025-2030 ($ million)
Chart on Coleoptera - Year-over-year growth 2025-2030 (%)
Data Table on Coleoptera - Year-over-year growth 2025-2030 (%)

9.4 Lepidoptera - Market size and forecast 2025-2030

Chart on Lepidoptera - Market size and forecast 2025-2030 ($ million)
Data Table on Lepidoptera - Market size and forecast 2025-2030 ($ million)
Chart on Lepidoptera - Year-over-year growth 2025-2030 (%)
Data Table on Lepidoptera - Year-over-year growth 2025-2030 (%)

9.5 Hymenoptera - Market size and forecast 2025-2030

Chart on Hymenoptera - Market size and forecast 2025-2030 ($ million)
Data Table on Hymenoptera - Market size and forecast 2025-2030 ($ million)
Chart on Hymenoptera - Year-over-year growth 2025-2030 (%)
Data Table on Hymenoptera - Year-over-year growth 2025-2030 (%)

9.6 Others - Market size and forecast 2025-2030

Chart on Others - Market size and forecast 2025-2030 ($ million)
Data Table on Others - Market size and forecast 2025-2030 ($ million)
Chart on Others - Year-over-year growth 2025-2030 (%)
Data Table on Others - Year-over-year growth 2025-2030 (%)

9.7 Market opportunity by Product

Market opportunity by Product ($ million)
Data Table on Market opportunity by Product ($ million)

10. Market Segmentation by Distribution Channel

10.1 Market segments

Chart on Distribution Channel - Market share 2025-2030 (%)
Data Table on Distribution Channel - Market share 2025-2030 (%)

10.2 Comparison by Distribution Channel

Chart on Comparison by Distribution Channel
Data Table on Comparison by Distribution Channel

10.3 Offline - Market size and forecast 2025-2030

Chart on Offline - Market size and forecast 2025-2030 ($ million)
Data Table on Offline - Market size and forecast 2025-2030 ($ million)
Chart on Offline - Year-over-year growth 2025-2030 (%)
Data Table on Offline - Year-over-year growth 2025-2030 (%)

10.4 Online - Market size and forecast 2025-2030

Chart on Online - Market size and forecast 2025-2030 ($ million)
Data Table on Online - Market size and forecast 2025-2030 ($ million)
Chart on Online - Year-over-year growth 2025-2030 (%)
Data Table on Online - Year-over-year growth 2025-2030 (%)

10.5 Market opportunity by Distribution Channel

Market opportunity by Distribution Channel ($ million)
Data Table on Market opportunity by Distribution Channel ($ million)

11. Customer Landscape

11.1 Customer landscape overview

Analysis of price sensitivity, lifecycle, customer purchase basket, adoption rates, and purchase criteria

12. Geographic Landscape

12.1 Geographic segmentation

Chart on Market share by geography 2025-2030 (%)
Data Table on Market share by geography 2025-2030 (%)

12.2 Geographic comparison

Chart on Geographic comparison
Data Table on Geographic comparison

12.3 Europe - Market size and forecast 2025-2030

Chart on Europe - Market size and forecast 2025-2030 ($ million)
Data Table on Europe - Market size and forecast 2025-2030 ($ million)
Chart on Europe - Year-over-year growth 2025-2030 (%)
Data Table on Europe - Year-over-year growth 2025-2030 (%)
Chart on Regional Comparison - Europe
Data Table on Regional Comparison - Europe

12.3.1 Germany - Market size and forecast 2025-2030

Chart on Germany - Market size and forecast 2025-2030 ($ million)
Data Table on Germany - Market size and forecast 2025-2030 ($ million)
Chart on Germany - Year-over-year growth 2025-2030 (%)
Data Table on Germany - Year-over-year growth 2025-2030 (%)

12.3.2 UK - Market size and forecast 2025-2030

Chart on UK - Market size and forecast 2025-2030 ($ million)
Data Table on UK - Market size and forecast 2025-2030 ($ million)
Chart on UK - Year-over-year growth 2025-2030 (%)
Data Table on UK - Year-over-year growth 2025-2030 (%)

12.3.3 France - Market size and forecast 2025-2030

Chart on France - Market size and forecast 2025-2030 ($ million)
Data Table on France - Market size and forecast 2025-2030 ($ million)
Chart on France - Year-over-year growth 2025-2030 (%)
Data Table on France - Year-over-year growth 2025-2030 (%)

12.3.4 Italy - Market size and forecast 2025-2030

Chart on Italy - Market size and forecast 2025-2030 ($ million)
Data Table on Italy - Market size and forecast 2025-2030 ($ million)
Chart on Italy - Year-over-year growth 2025-2030 (%)
Data Table on Italy - Year-over-year growth 2025-2030 (%)

12.3.5 Spain - Market size and forecast 2025-2030

Chart on Spain - Market size and forecast 2025-2030 ($ million)
Data Table on Spain - Market size and forecast 2025-2030 ($ million)
Chart on Spain - Year-over-year growth 2025-2030 (%)
Data Table on Spain - Year-over-year growth 2025-2030 (%)

12.3.6 The Netherlands - Market size and forecast 2025-2030

Chart on The Netherlands - Market size and forecast 2025-2030 ($ million)
Data Table on The Netherlands - Market size and forecast 2025-2030 ($ million)
Chart on The Netherlands - Year-over-year growth 2025-2030 (%)
Data Table on The Netherlands - Year-over-year growth 2025-2030 (%)

12.4 North America - Market size and forecast 2025-2030

Chart on North America - Market size and forecast 2025-2030 ($ million)
Data Table on North America - Market size and forecast 2025-2030 ($ million)
Chart on North America - Year-over-year growth 2025-2030 (%)
Data Table on North America - Year-over-year growth 2025-2030 (%)
Chart on Regional Comparison - North America
Data Table on Regional Comparison - North America

12.4.1 US - Market size and forecast 2025-2030

Chart on US - Market size and forecast 2025-2030 ($ million)
Data Table on US - Market size and forecast 2025-2030 ($ million)
Chart on US - Year-over-year growth 2025-2030 (%)
Data Table on US - Year-over-year growth 2025-2030 (%)

12.4.2 Canada - Market size and forecast 2025-2030

Chart on Canada - Market size and forecast 2025-2030 ($ million)
Data Table on Canada - Market size and forecast 2025-2030 ($ million)
Chart on Canada - Year-over-year growth 2025-2030 (%)
Data Table on Canada - Year-over-year growth 2025-2030 (%)

12.4.3 Mexico - Market size and forecast 2025-2030

Chart on Mexico - Market size and forecast 2025-2030 ($ million)
Data Table on Mexico - Market size and forecast 2025-2030 ($ million)
Chart on Mexico - Year-over-year growth 2025-2030 (%)
Data Table on Mexico - Year-over-year growth 2025-2030 (%)

12.5 APAC - Market size and forecast 2025-2030

Chart on APAC - Market size and forecast 2025-2030 ($ million)
Data Table on APAC - Market size and forecast 2025-2030 ($ million)
Chart on APAC - Year-over-year growth 2025-2030 (%)
Data Table on APAC - Year-over-year growth 2025-2030 (%)
Chart on Regional Comparison - APAC
Data Table on Regional Comparison - APAC

12.5.1 China - Market size and forecast 2025-2030

Chart on China - Market size and forecast 2025-2030 ($ million)
Data Table on China - Market size and forecast 2025-2030 ($ million)
Chart on China - Year-over-year growth 2025-2030 (%)
Data Table on China - Year-over-year growth 2025-2030 (%)

12.5.2 Japan - Market size and forecast 2025-2030

Chart on Japan - Market size and forecast 2025-2030 ($ million)
Data Table on Japan - Market size and forecast 2025-2030 ($ million)
Chart on Japan - Year-over-year growth 2025-2030 (%)
Data Table on Japan - Year-over-year growth 2025-2030 (%)

12.5.3 India - Market size and forecast 2025-2030

Chart on India - Market size and forecast 2025-2030 ($ million)
Data Table on India - Market size and forecast 2025-2030 ($ million)
Chart on India - Year-over-year growth 2025-2030 (%)
Data Table on India - Year-over-year growth 2025-2030 (%)

12.5.4 South Korea - Market size and forecast 2025-2030

Chart on South Korea - Market size and forecast 2025-2030 ($ million)
Data Table on South Korea - Market size and forecast 2025-2030 ($ million)
Chart on South Korea - Year-over-year growth 2025-2030 (%)
Data Table on South Korea - Year-over-year growth 2025-2030 (%)

12.5.5 Australia - Market size and forecast 2025-2030

Chart on Australia - Market size and forecast 2025-2030 ($ million)
Data Table on Australia - Market size and forecast 2025-2030 ($ million)
Chart on Australia - Year-over-year growth 2025-2030 (%)
Data Table on Australia - Year-over-year growth 2025-2030 (%)

12.5.6 Indonesia - Market size and forecast 2025-2030

Chart on Indonesia - Market size and forecast 2025-2030 ($ million)
Data Table on Indonesia - Market size and forecast 2025-2030 ($ million)
Chart on Indonesia - Year-over-year growth 2025-2030 (%)
Data Table on Indonesia - Year-over-year growth 2025-2030 (%)

12.6 Middle East and Africa - Market size and forecast 2025-2030

Chart on Middle East and Africa - Market size and forecast 2025-2030 ($ million)
Data Table on Middle East and Africa - Market size and forecast 2025-2030 ($ million)
Chart on Middle East and Africa - Year-over-year growth 2025-2030 (%)
Data Table on Middle East and Africa - Year-over-year growth 2025-2030 (%)
Chart on Regional Comparison - Middle East and Africa
Data Table on Regional Comparison - Middle East and Africa

12.6.1 Saudi Arabia - Market size and forecast 2025-2030

Chart on Saudi Arabia - Market size and forecast 2025-2030 ($ million)
Data Table on Saudi Arabia - Market size and forecast 2025-2030 ($ million)
Chart on Saudi Arabia - Year-over-year growth 2025-2030 (%)
Data Table on Saudi Arabia - Year-over-year growth 2025-2030 (%)

12.6.2 UAE - Market size and forecast 2025-2030

Chart on UAE - Market size and forecast 2025-2030 ($ million)
Data Table on UAE - Market size and forecast 2025-2030 ($ million)
Chart on UAE - Year-over-year growth 2025-2030 (%)
Data Table on UAE - Year-over-year growth 2025-2030 (%)

12.6.3 South Africa - Market size and forecast 2025-2030

Chart on South Africa - Market size and forecast 2025-2030 ($ million)
Data Table on South Africa - Market size and forecast 2025-2030 ($ million)
Chart on South Africa - Year-over-year growth 2025-2030 (%)
Data Table on South Africa - Year-over-year growth 2025-2030 (%)

12.6.4 Israel - Market size and forecast 2025-2030

Chart on Israel - Market size and forecast 2025-2030 ($ million)
Data Table on Israel - Market size and forecast 2025-2030 ($ million)
Chart on Israel - Year-over-year growth 2025-2030 (%)
Data Table on Israel - Year-over-year growth 2025-2030 (%)

12.6.5 Turkey - Market size and forecast 2025-2030

Chart on Turkey - Market size and forecast 2025-2030 ($ million)
Data Table on Turkey - Market size and forecast 2025-2030 ($ million)
Chart on Turkey - Year-over-year growth 2025-2030 (%)
Data Table on Turkey - Year-over-year growth 2025-2030 (%)

12.7 South America - Market size and forecast 2025-2030

Chart on South America - Market size and forecast 2025-2030 ($ million)
Data Table on South America - Market size and forecast 2025-2030 ($ million)
Chart on South America - Year-over-year growth 2025-2030 (%)
Data Table on South America - Year-over-year growth 2025-2030 (%)
Chart on Regional Comparison - South America
Data Table on Regional Comparison - South America

12.7.1 Brazil - Market size and forecast 2025-2030

Chart on Brazil - Market size and forecast 2025-2030 ($ million)
Data Table on Brazil - Market size and forecast 2025-2030 ($ million)
Chart on Brazil - Year-over-year growth 2025-2030 (%)
Data Table on Brazil - Year-over-year growth 2025-2030 (%)

12.7.2 Argentina - Market size and forecast 2025-2030

Chart on Argentina - Market size and forecast 2025-2030 ($ million)
Data Table on Argentina - Market size and forecast 2025-2030 ($ million)
Chart on Argentina - Year-over-year growth 2025-2030 (%)
Data Table on Argentina - Year-over-year growth 2025-2030 (%)

12.7.3 Colombia - Market size and forecast 2025-2030

Chart on Colombia - Market size and forecast 2025-2030 ($ million)
Data Table on Colombia - Market size and forecast 2025-2030 ($ million)
Chart on Colombia - Year-over-year growth 2025-2030 (%)
Data Table on Colombia - Year-over-year growth 2025-2030 (%)

12.8 Market opportunity by geography

Market opportunity by geography ($ million)
Data Tables on Market opportunity by geography ($ million)

13. Drivers, Challenges, and Opportunity

13.1 Market drivers

Increasing demand for sustainable protein sources
Rising interest in healthy and nutritious food options
Growing adoption of insect-based animal feed

13.2 Market challenges

Inconsistency in government regulations related to insect proteins
Limited awareness of insect proteins
Supply chain and scalability challenges

13.3 Impact of drivers and challenges

Impact of drivers and challenges in 2025 and 2030

13.4 Market opportunities

Rising product diversification and innovation
Collaborations and partnerships between companies
Growing sustainable farming practices related to insect proteins

14. Competitive Landscape

14.1 Overview

14.2

Overview on criticality of inputs and factors of differentiation

14.3 Landscape disruption

Overview on factors of disruption

14.4 Industry risks

Impact of key risks on business

15. Competitive Analysis

15.1 Companies profiled

Companies covered

15.2 Company ranking index

15.3 Market positioning of companies

Matrix on companies position and classification

15.4 Agence Scratch

Agence Scratch - Overview
Agence Scratch - Product / Service
Agence Scratch - Key offerings
SWOT

15.5 Agronutris

Agronutris - Overview
Agronutris - Product / Service
Agronutris - Key offerings
SWOT

15.6 Aspire Food Group

Aspire Food Group - Overview
Aspire Food Group - Product / Service
Aspire Food Group - Key offerings
SWOT

15.7 Chapul Farms

Chapul Farms - Overview
Chapul Farms - Product / Service
Chapul Farms - Key offerings
SWOT

15.8 Darling Ingredients Inc.

Darling Ingredients Inc. - Overview
Darling Ingredients Inc. - Business segments
Darling Ingredients Inc. - Key news
Darling Ingredients Inc. - Key offerings
Darling Ingredients Inc. - Segment focus
SWOT

15.9 Entomo Farms

Entomo Farms - Overview
Entomo Farms - Product / Service
Entomo Farms - Key offerings
SWOT

15.10 Hargol FoodTech

Hargol FoodTech - Overview
Hargol FoodTech - Product / Service
Hargol FoodTech - Key offerings
SWOT

15.11 HEXAFLY

HEXAFLY - Overview
HEXAFLY - Product / Service
HEXAFLY - Key offerings
SWOT

15.12 HiProMine S.A.

HiProMine S.A. - Overview
HiProMine S.A. - Product / Service
HiProMine S.A. - Key offerings
SWOT

15.13 Innovafeed SAS

Innovafeed SAS - Overview
Innovafeed SAS - Product / Service
Innovafeed SAS - Key offerings
SWOT

15.14 MealFood Europe SL

MealFood Europe SL - Overview
MealFood Europe SL - Product / Service
MealFood Europe SL - Key offerings
SWOT

15.15 Protenga Pvt. Ltd.

Protenga Pvt. Ltd. - Overview
Protenga Pvt. Ltd. - Product / Service
Protenga Pvt. Ltd. - Key offerings
SWOT

15.16 Protix BV

Protix BV - Overview
Protix BV - Product / Service
Protix BV - Key offerings
SWOT

15.17 Sentara Group

Sentara Group - Overview
Sentara Group - Product / Service
Sentara Group - Key offerings
SWOT

15.18 Ynsect SAS

Ynsect SAS - Overview
Ynsect SAS - Product / Service
Ynsect SAS - Key offerings
SWOT

16. Appendix

16.1 Scope of the report

Market definition
Objectives
Notes and caveats

16.2 Inclusions and exclusions checklist

Inclusions checklist
Exclusions checklist

16.3 Currency conversion rates for US$

16.4 Research methodology

16.5 Data procurement

Information sources

16.6 Data validation

16.7 Validation techniques employed for market sizing

16.8 Data synthesis

16.9 360 degree market analysis

16.10 List of abbreviations

Research Methodology

Technavio presents a detailed picture of the market by way of study, synthesis, and summation of data from multiple sources. The analysts have presented the various facets of the market with a particular focus on identifying the key industry influencers. The data thus presented is comprehensive, reliable, and the result of extensive research, both primary and secondary.

INFORMATION SOURCES

Primary sources

  • Manufacturers and suppliers
  • Channel partners
  • Industry experts
  • Strategic decision makers

Secondary sources

  • Industry journals and periodicals
  • Government data
  • Financial reports of key industry players
  • Historical data
  • Press releases

DATA ANALYSIS

Data Synthesis

  • Collation of data
  • Estimation of key figures
  • Analysis of derived insights

Data Validation

  • Triangulation with data models
  • Reference against proprietary databases
  • Corroboration with industry experts

REPORT WRITING

Qualitative

  • Market drivers
  • Market challenges
  • Market trends
  • Five forces analysis

Quantitative

  • Market size and forecast
  • Market segmentation
  • Geographical insights
  • Competitive landscape

Interested in this report?

Get your sample now to see our research methodology and insights!

Download Now

Frequently Asked Questions

Insect Protein market growth will increase by USD 3596.7 million during 2026-2030.

The Insect Protein market is expected to grow at a CAGR of 38.6% during 2026-2030.

Insect Protein market is segmented by Application (Animal feed, Food and beverages, Others) Product (Coleoptera, Lepidoptera, Hymenoptera, Others) Distribution channel (Offline, Online)

Agence Scratch, Agronutris, All Things Bugs LLC, Aspire Food Group, Bugsolutely Ltd., Chapul Farms, Darling Ingredients Inc., Divaks Food UAB, Entomo Farms, Flying spark, Hargol FoodTech, HEXAFLY, HiProMine S.A., Innovafeed SAS, MealFood Europe SL, Protenga Pvt. Ltd., Protix BV, Sentara Group, Ynsect SAS are a few of the key vendors in the Insect Protein market.

Europe will register the highest growth rate of 35% among the other regions. Therefore, the Insect Protein market in Europe is expected to garner significant business opportunities for the vendors during the forecast period.

Germany, UK, France, Italy, Spain, The Netherlands, US, Canada, Mexico, China, Japan, India, South Korea, Australia, Indonesia, Saudi Arabia, UAE, South Africa, Israel, Turkey, Brazil, Argentina, Colombia

  • Increasing demand for sustainable protein sources is the driving factor this market.

The Insect Protein market vendors should focus on grabbing business opportunities from the Application segment as it accounted for the largest market share in the base year.
RIA - Research AI Assistant
Ask RIA