Education Personal Computer (PC) And Tablet Market Analysis, Size, and Forecast 2026-2030: North America (US, Canada, and Mexico), Europe (Germany, UK, and France), APAC (China, India, and Japan), South America (Brazil and Argentina), Middle East and Africa (Saudi Arabia, UAE, and South Africa), and Rest of World (ROW)

Education Personal Computer (PC) And Tablet Market Analysis, Size, and Forecast 2026-2030:
North America (US, Canada, and Mexico), Europe (Germany, UK, and France), APAC (China, India, and Japan), South America (Brazil and Argentina), Middle East and Africa (Saudi Arabia, UAE, and South Africa), and Rest of World (ROW)

Published: May 2026 288 Pages SKU: IRTNTR75983

Market Overview at a Glance

$39.20 B
Market Opportunity
12.8%
CAGR 2025 - 2030
29.1%
Europe Growth
$26.46 B
K-12 segment 2024

Education Personal Computer (PC) And Tablet Market Size 2026-2030

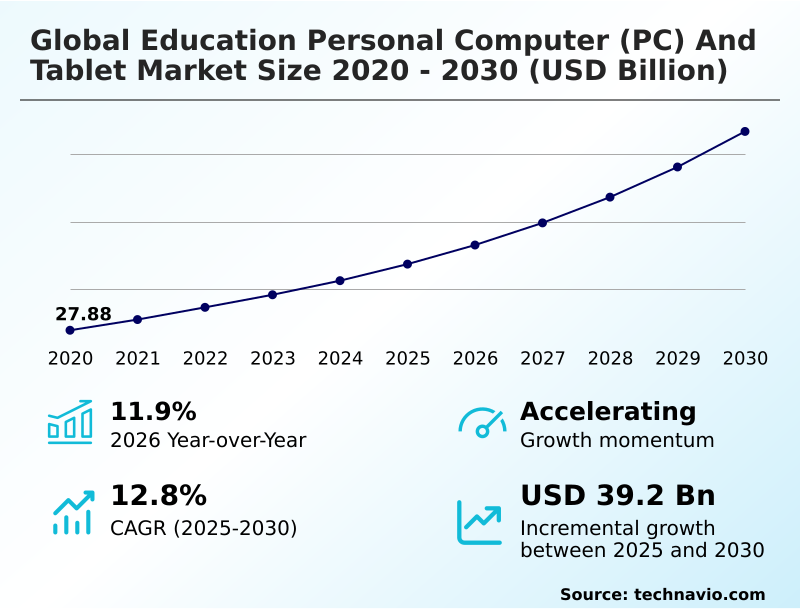
The Education Personal Computer (PC) And Tablet Market size was valued at USD 47.42 billion in 2025, growing at a CAGR of 12.8% during the forecast period 2026-2030.

Major Market Trends & Insights

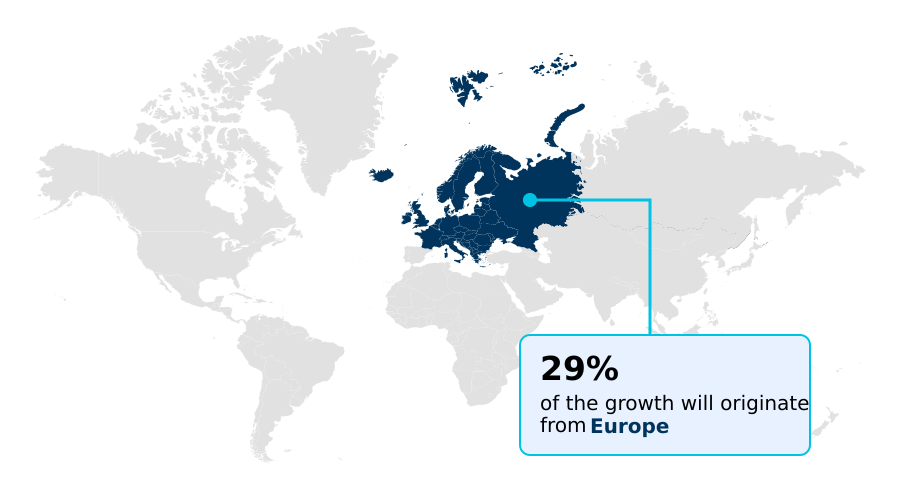
  • Europe dominated the market and accounted for a 29.1% growth during the forecast period.
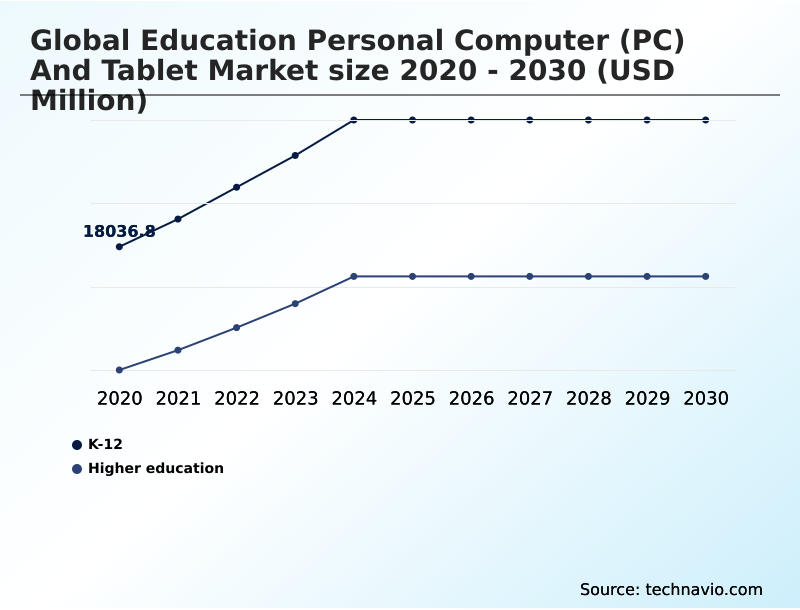
  • By End-user - K-12 segment was valued at USD 26.46 billion in 2024
  • By Product - Laptop segment accounted for the largest market revenue share in 2024

Market Size & Forecast

  • Historic Market Opportunities 2020-2024: USD 58.74 billion
  • Market Future Opportunities 2025-2030: USD 39.20 billion
  • CAGR from 2025 to 2030 : 12.8%

Market Summary

  • The education personal computer (pc) and tablet market is undergoing a significant transition, with over 70% of new procurement decisions now prioritizing devices with AI-integrated hardware. This premiumization is driven by the need to support adaptive learning technologies, where devices with neural processing units can improve personalized learning pathway adjustments by up to 40% compared to older hardware.
  • A key driver is the normalization of hybrid learning environments, which demands robust, cloud-connected devices for seamless synchronous instruction. For example, a school district's supply chain strategy must now balance the acquisition of high-end workstations for specialized programs against cost-effective, ruggedized hardware for widespread K-12 deployment.
  • However, this is challenged by escalating hardware procurement costs and semiconductor scarcity, which can delay one-to-one computing initiatives and widen the digital divide. This dynamic forces a strategic re-evaluation of device-as-a-service models versus capital expenditure to ensure sustainable technology access.

What will be the Size of the Education Personal Computer (PC) And Tablet Market during the forecast period?

Get Key Insights on Market Forecast (PDF) Request Free Sample

How is the Education Personal Computer (PC) And Tablet Market Segmented?

The education personal computer (pc) and tablet industry research report provides comprehensive data (region-wise segment analysis), with forecasts and analysis for the period 2026-2030, as well as historical data from 2020-2024 for the following segments.

  • End-user
    • K-12
    • Higher education
  • Product
    • Laptop
    • Tablet
    • Desktop
  • Os
    • Android
    • iOS
    • Windows
  • Geography
    • North America
      • US
      • Canada
      • Mexico
    • Europe
      • Germany
      • UK
      • France
    • APAC
      • China
      • India
      • Japan
    • South America
      • Brazil
      • Argentina
    • Middle East and Africa
      • Saudi Arabia
      • UAE
      • South Africa
    • Rest of World (ROW)

How is the Education Personal Computer (PC) And Tablet Market Segmented by End-user?

The k-12 segment is estimated to witness significant growth during the forecast period.

The K-12 segment, representing over 60% of device deployments, drives demand for ruggedized hardware design and centralized cloud management. Durability is a key purchasing factor, with devices expected to withstand a 30% higher drop-test rating compared to consumer models.

Procurement focuses on one-to-one device ratios, necessitating cost-effective yet resilient hardware like reinforced tablets and ruggedized chromebooks. This is fueled by digital equity initiatives and the need for seamless integration with classroom orchestration software.

The pedagogical shift towards personalized learning pathways and interactive touchscreens further shapes hardware specifications, prioritizing long-term hardware durability and student data privacy through robust, manageable operating systems.

Request Free Sample

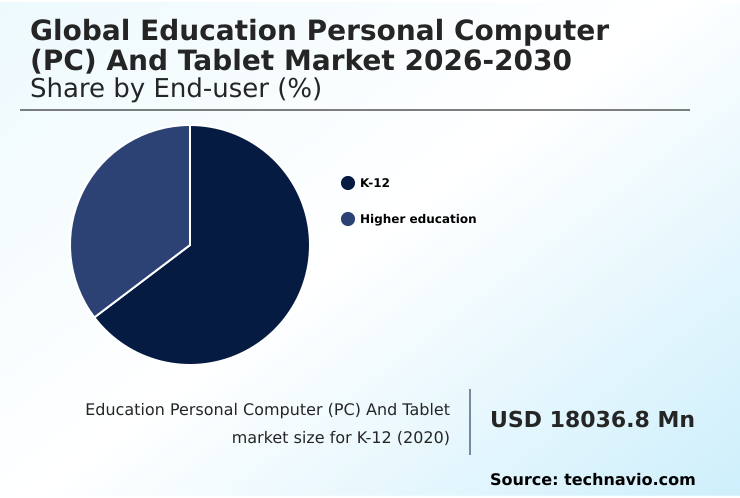
The K-12 segment was valued at USD 26.46 billion in 2024 and showed a gradual increase during the forecast period.

Request Free Sample

How demand for the Education Personal Computer (PC) And Tablet market is rising in the leading region?

Europe is estimated to contribute 29.1% to the growth of the global market during the forecast period.Technavio’s analysts have elaborately explained the regional trends and drivers that shape the market during the forecast period.

See How Education Personal Computer (PC) And Tablet Market demand is rising in Europe Request Free Sample

Regional dynamics in the education personal computer (pc) and tablet market are shaped by digital maturity and procurement models, with North America accounting for 28.46% of the market, which is 3.29% more than APAC.

This dominance is driven by large-scale digital equity initiatives and one-to-one device ratios in countries like the US, where procurement focuses on high-performance computing and silicon-level security.

In contrast, APAC, with a projected growth of 14.4%, sees higher demand for cost-effective, ruggedized hardware to support rapid digitalization.

European markets, which account for 29.11% of the market share, prioritize sustainable procurement and data sovereignty, favoring vendors that offer modular repair programs and robust student data privacy.

This regional divergence requires adaptable supply chain strategies, balancing the production of premium AI-integrated hardware for mature markets with durable, entry-level ruggedized devices for emerging economies.

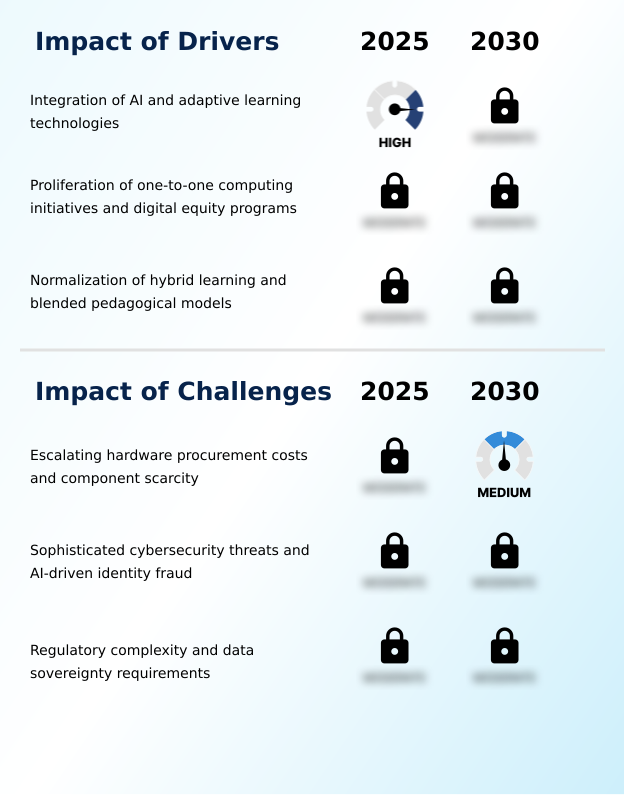
What are the key Drivers, Trends, and Challenges in the Education Personal Computer (PC) And Tablet Market?

Our researchers analyzed the data with 2025 as the base year, along with the key drivers, trends, and challenges. A holistic analysis of drivers will help companies refine their marketing strategies to gain a competitive advantage.

  • Navigating the procurement landscape requires a nuanced understanding of specific use cases, from identifying the best education pc for ai development in university labs to selecting a durable, ruggedized tablet for k-12 classrooms. Institutions are discovering that device-as-a-service, or DaaS models for school districts, can reduce upfront capital outlay by over 30% compared to direct purchasing, easing budget pressures.
  • A key operational consideration is managing hybrid learning device fleets, where centralized cloud management tools are crucial for deploying updates and enforcing security policies efficiently. For instance, institutions using integrated platforms report a 25% reduction in IT support tickets related to device management.
  • Furthermore, the demand for a versatile convertible laptop for higher education continues to grow, as these devices serve multiple functions from note-taking to complex software simulations. Across all hardware choices, implementing robust education device security protocols is non-negotiable to protect student data and ensure compliance, forming the foundation of any modern digital learning infrastructure.
  • This strategic approach ensures that technology investments are both pedagogically effective and financially sustainable.

What are the key market drivers leading to the rise in the adoption of Education Personal Computer (PC) And Tablet Industry?

  • The integration of AI with adaptive learning technologies is a primary driver, compelling educational institutions to upgrade hardware for personalized learning.

  • The rapid integration of AI and adaptive learning technologies is the primary market driver, compelling institutions to upgrade device fleets to support next-generation pedagogical software.
  • AI-enabled hardware, particularly devices with specialized neural processing units, facilitates personalized learning pathways by analyzing student performance data in real-time, a process that can increase student engagement by up to 25%.
  • This technological shift encourages procurement of AI-integrated hardware capable of handling complex on-device cognitive tasks.
  • Furthermore, the normalization of hybrid learning environments, now utilized by over 60% of educational institutions, solidifies the demand for high-performance, mobile-first devices that ensure equitable access to digital resources, driving consistent investment in the sector.

What are the market trends shaping the Education Personal Computer (PC) And Tablet Industry?

  • The adoption of on-device artificial intelligence and integrated neural processing is a definitive trend. This shift is reshaping hardware requirements and enabling new pedagogical applications.

  • A definitive trend is the market's shift toward on-device AI processing, with new device specifications showing a 50% increase in demand for integrated neural processing units. This transition enables real-time, personalized learning pathways without continuous cloud dependency, significantly improving latency and strengthening student data privacy.
  • As a result, hardware with high-performance computing capabilities is becoming the new standard for future-proof educational infrastructure, moving beyond basic connectivity. The proliferation of modular designs is also gaining traction, as it can extend hardware lifecycle management by up to two years, addressing sustainability and total cost of ownership concerns.
  • This focus on local AI processing and sustainable hardware reflects a broader industry movement toward creating a more secure, efficient, and adaptable digital learning infrastructure.

What challenges does the Education Personal Computer (PC) And Tablet Industry face during its growth?

  • Escalating hardware procurement costs, compounded by critical component scarcity, present a significant challenge to market growth and digital equity initiatives.

  • Escalating hardware procurement costs, with some critical components seeing price increases of over 20%, pose a primary challenge to the market. This surge, driven by component scarcity and supply chain shifts prioritizing high-margin sectors, directly impedes digital equity initiatives, as institutional budgets can no longer acquire the same volume of devices.
  • Consequently, hardware replacement cycles are lengthening, risking a scenario where over 35% of students may be left with obsolete technology unable to support modern pedagogical software. This environment is forcing a re-evaluation of funding models and device-as-a-service options to ensure digital learning remains accessible, challenging the traditional reliance on low-margin, high-volume hardware procurement.

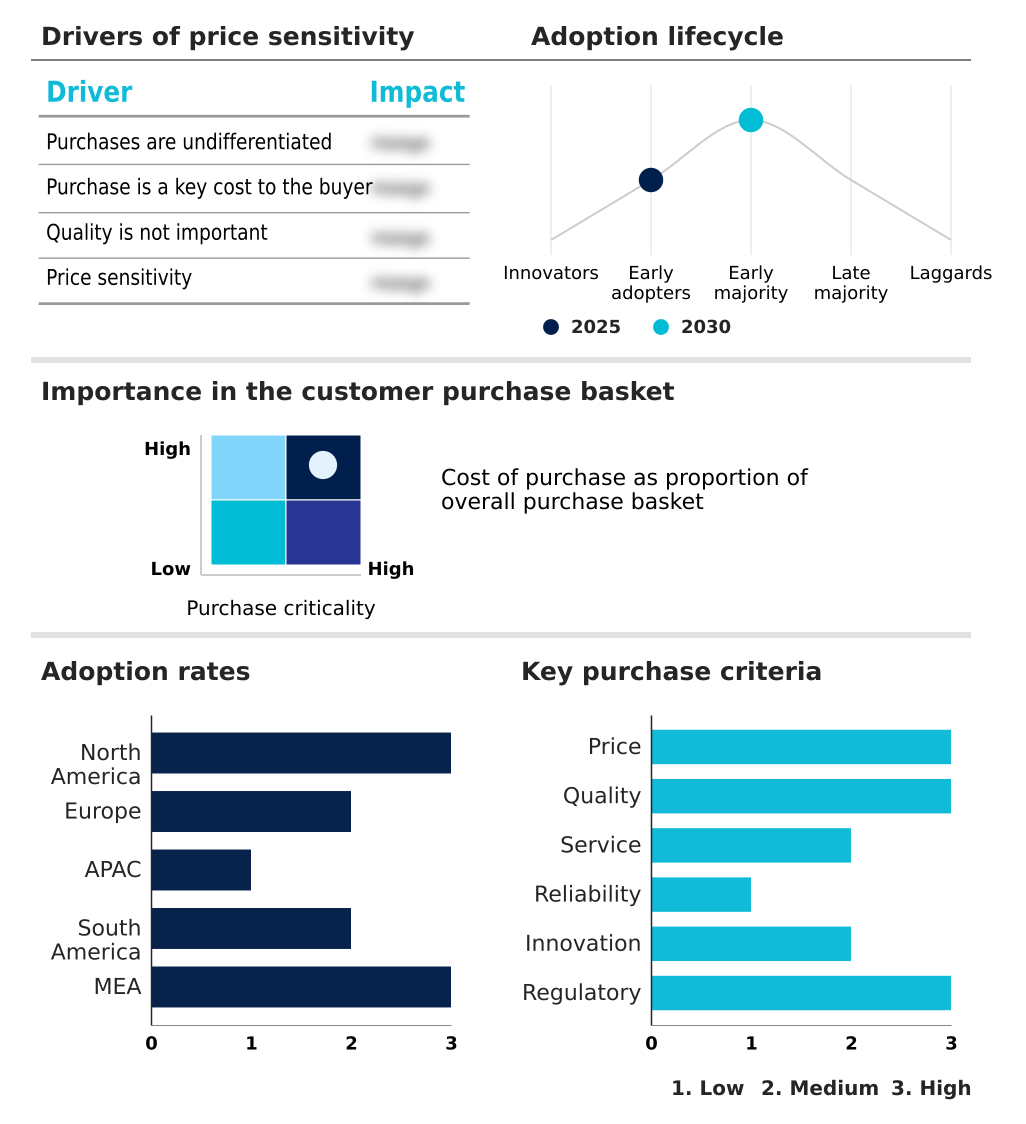
Exclusive Technavio Analysis on Customer Landscape

The education personal computer (pc) and tablet market forecasting report includes the adoption lifecycle of the market, covering from the innovator’s stage to the laggard’s stage. It focuses on adoption rates in different regions based on penetration. Furthermore, the education personal computer (pc) and tablet market report also includes key purchase criteria and drivers of price sensitivity to help companies evaluate and develop their market growth analysis strategies.

Customer Landscape of Education Personal Computer (PC) And Tablet Industry

Competitive Landscape

Companies are implementing various strategies, such as strategic alliances, education personal computer (pc) and tablet market forecast, partnerships, mergers and acquisitions, geographical expansion, and product/service launches, to enhance their presence in the industry.

Acer Inc. - Offerings include specialized personal computers and tablets, such as Chromebooks and laptops, engineered for diverse educational environments and learning requirements.

The industry research and growth report includes detailed analyses of the competitive landscape of the market and information about key companies, including:

  • Acer Inc.
  • Apple Inc.
  • ASUSTeK Computer Inc.
  • Chuwi Innovation Ltd.
  • Dell Technologies Inc.
  • Dynabook Singapore Pte. Ltd.
  • Elitegroup Computer Systems Co.
  • Google LLC
  • Guangzhou Shangke Info. Co.
  • HMD Global Oy
  • Honor Device Co. Ltd.
  • HP Inc.
  • Huawei Technologies Co. Ltd.
  • Lenovo Group Ltd.
  • Microsoft Corp.
  • Nexstgo Co. Ltd.
  • OnePlus Technology Co. Ltd.
  • Samsung Electronics Co. Ltd.
  • Xiaomi Corp.

Qualitative and quantitative analysis of companies has been conducted to help clients understand the wider business environment as well as the strengths and weaknesses of key industry players. Data is qualitatively analyzed to categorize companies as pure play, category-focused, industry-focused, and diversified; it is quantitatively analyzed to categorize companies as dominant, leading, strong, tentative, and weak.

Market Intelligence Radar: High-Impact Developments & Growth Signals

  • In the Technology Hardware, Storage and Peripherals industry, the accelerated development of on-device AI processing and specialized neural processing units has created a new premium tier for educational devices. This shift directly impacts the education personal computer (pc) and tablet market by driving demand for high-performance computing hardware capable of local AI processing, moving beyond cloud-dependent models.
  • Escalating data privacy regulations, mirroring GDPR's principles in new jurisdictions, have forced hardware manufacturers to prioritize silicon-level security and hardware-level encryption. This directly influences the education personal computer (pc) and tablet market, as institutional buyers now mandate advanced security protocols to ensure student data privacy.
  • A growing emphasis on circular economy principles and sustainable procurement within the broader electronics sector is promoting modular repair programs and hardware lifecycle management. For the education personal computer (pc) and tablet market, this translates into a preference for devices with higher repairability scores and longer support cycles, impacting total cost of ownership calculations.
  • The normalization of hybrid work models in the corporate world has directly influenced pedagogical approaches, increasing demand for blended pedagogical models in education. This shift drives the need for high-definition audiovisual components and collaborative learning platforms in the education personal computer (pc) and tablet market, ensuring seamless synchronous instruction.

Dive into Technavio’s robust research methodology, blending expert interviews, extensive data synthesis, and validated models for unparalleled Education Personal Computer (PC) And Tablet Market insights. See full methodology.

Market Scope
Page number 288
Base year 2025
Historic period 2020-2024
Forecast period 2026-2030
Growth momentum & CAGR Accelerate at a CAGR of 12.8%
Market growth 2026-2030 USD 39202.9 million
Market structure Fragmented
YoY growth 2025-2026(%) 11.9%
Key countries US, Canada, Mexico, Germany, UK, France, Italy, Spain, Russia, China, India, Japan, South Korea, Australia, Indonesia, Brazil, Argentina, Chile, Saudi Arabia, UAE, South Africa, Turkey and Israel
Competitive landscape Leading Companies, Market Positioning of Companies, Competitive Strategies, and Industry Risks

Request Free Sample

Research Analyst Overview

  • The education personal computer (pc) and tablet market ecosystem is a complex interplay of stakeholders, with semiconductor suppliers of components like neural processing units directly influencing the capabilities of final products. This upstream segment's innovation pipeline dictates the pace at which features like on-device AI processing become standard.
  • Original equipment manufacturers (OEMs), accounting for over 85% of device production, integrate these components into hardware tailored for specific educational segments, from K-12 to higher education. Their strategies are heavily shaped by large-scale procurement contracts from government bodies and school districts, which often mandate specific durability standards and adherence to student data privacy laws.
  • These contracts can represent up to 40% of a vendor's regional education sales. Distribution channels then deliver these devices, while software providers create the integrated software ecosystems that are crucial for classroom orchestration and curriculum delivery, ultimately defining the end-user experience.

What are the Key Data Covered in this Education Personal Computer (PC) And Tablet Market Research and Growth Report?

  • What is the expected growth of the Education Personal Computer (PC) And Tablet Market between 2026 and 2030?

    • The Education Personal Computer (PC) And Tablet Market is expected to grow by USD 39.20 billion during 2026-2030, registering a CAGR of 12.8%. Year-over-year growth in 2026 is estimated at 11.9%%. This acceleration is shaped by integration of ai and adaptive learning technologies, which is intensifying demand across multiple end-use verticals covered in the report.

  • What segmentation does the market report cover?

    • The report is segmented by End-user (K-12, and Higher education), Product (Laptop, Tablet, and Desktop), OS (Android, iOS, and Windows) and Geography (North America, Europe, APAC, South America, Middle East and Africa). Among these, the K-12 segment is estimated to witness significant growth during the forecast period, driven by rising adoption across key application areas. Each segment includes detailed qualitative and quantitative analysis, along with historical data from 2020-2024 and forecasts through 2030 with year-over-year growth rates.

  • Which regions are analyzed in the report?

    • The report covers North America, Europe, APAC, South America and Middle East and Africa. Europe is estimated to contribute 29.1% to market growth during the forecast period. Country-level analysis includes US, Canada, Mexico, Germany, UK, France, Italy, Spain, Russia, China, India, Japan, South Korea, Australia, Indonesia, Brazil, Argentina, Chile, Saudi Arabia, UAE, South Africa, Turkey and Israel, with dedicated market size tables and year-over-year growth for each.

  • What are the key growth drivers and market challenges?

    • The primary driver is integration of ai and adaptive learning technologies, which is accelerating investment and industry demand. The main challenge is escalating hardware procurement costs and component scarcity, creating operational barriers for key market participants. The report quantifies the impact of each driver and challenge across 2026 and 2030 with comparative analysis.

  • Who are the major players in the Education Personal Computer (PC) And Tablet Market?

    • Key vendors include Acer Inc., Apple Inc., ASUSTeK Computer Inc., Chuwi Innovation Ltd., Dell Technologies Inc., Dynabook Singapore Pte. Ltd., Elitegroup Computer Systems Co., Google LLC, Guangzhou Shangke Info. Co., HMD Global Oy, Honor Device Co. Ltd., HP Inc., Huawei Technologies Co. Ltd., Lenovo Group Ltd., Microsoft Corp., Nexstgo Co. Ltd., OnePlus Technology Co. Ltd., Samsung Electronics Co. Ltd. and Xiaomi Corp.. The report provides qualitative and quantitative analysis categorizing companies as dominant, leading, strong, tentative, and weak based on their market positioning. Company profiles include business segment analysis, SWOT assessment, key offerings, and recent strategic developments.

Market Research Insights

  • The competitive landscape for education personal computers (pc) and tablets is intensifying, with the top three vendors capturing over 60% of institutional contracts. Key players are differentiating beyond price, focusing on integrated hardware and software ecosystems. For instance, recent moves by HP Inc. and Lenovo Group Ltd.
  • to launch AI-integrated laptops with extended battery life and modular component replacement address the sector's dual demands for advanced pedagogical tools and a lower total cost of ownership. These innovations directly respond to the 30% rise in demand for devices supporting on-device AI processing without constant cloud connectivity.
  • This strategic pivot aims to mitigate the challenge of escalating hardware procurement costs, offering institutions longer hardware lifecycles and enhanced repairability, thereby maximizing their technology investments in an era of tightening budgets and complex supply chains.

We can help! Our analysts can customize this education personal computer (pc) and tablet market research report to meet your requirements.

Get in touch

1. Executive Summary

1.1 Market overview

Executive Summary - Chart on Market Overview
Executive Summary - Data Table on Market Overview
Executive Summary - Chart on Global Market Characteristics
Executive Summary - Chart on Market by Geography
Executive Summary - Chart on Market Segmentation by End-user
Executive Summary - Chart on Market Segmentation by Product
Executive Summary - Chart on Market Segmentation by OS
Executive Summary - Chart on Incremental Growth
Executive Summary - Data Table on Incremental Growth
Executive Summary - Chart on Company Market Positioning

2. Technavio Analysis

2.1 Analysis of price sensitivity, lifecycle, customer purchase basket, adoption rates, and purchase criteria

2.2 Criticality of inputs and Factors of differentiation

Chart on Overview on criticality of inputs and factors of differentiation

2.3 Factors of disruption

Chart on Overview on factors of disruption

2.4 Impact of drivers and challenges

Chart on Impact of drivers and challenges in 2025 and 2030

3. Market Landscape

3.1 Market ecosystem

Chart on Parent Market
Data Table on - Parent Market

3.2 Market characteristics

Chart on Market characteristics analysis

3.3 Value chain analysis

Chart on Value chain analysis

4. Market Sizing

4.1 Market definition

Data Table on Offerings of companies included in the market definition

4.2 Market segment analysis

Market segments

4.3 Market size 2025

4.4 Market outlook: Forecast for 2025-2030

Chart on Global - Market size and forecast 2025-2030 ($ million)
Data Table on Global - Market size and forecast 2025-2030 ($ million)
Chart on Global Market: Year-over-year growth 2025-2030 (%)
Data Table on Global Market: Year-over-year growth 2025-2030 (%)

5. Historic Market Size

5.1 Global Education Personal Computer (PC) And Tablet Market 2020 - 2024

Historic Market Size - Data Table on Global Education Personal Computer (PC) And Tablet Market 2020 - 2024 ($ million)

5.2 End-user segment analysis 2020 - 2024

Historic Market Size - End-user Segment 2020 - 2024 ($ million)

5.3 Product segment analysis 2020 - 2024

Historic Market Size - Product Segment 2020 - 2024 ($ million)

5.4 OS segment analysis 2020 - 2024

Historic Market Size - OS Segment 2020 - 2024 ($ million)

5.5 Geography segment analysis 2020 - 2024

Historic Market Size - Geography Segment 2020 - 2024 ($ million)

5.6 Country segment analysis 2020 - 2024

Historic Market Size - Country Segment 2020 - 2024 ($ million)

6. Qualitative Analysis

6.1 Impact of AI in Global Education Personal Computer (PC) and Tablet Market

6.2 Impact of Geopolitical Conflict for Global Education Personal Computer (PC) and Tablet Market

7. Five Forces Analysis

7.1 Five forces summary

Five forces analysis - Comparison between 2025 and 2030

7.2 Bargaining power of buyers

Bargaining power of buyers - Impact of key factors 2025 and 2030

7.3 Bargaining power of suppliers

Bargaining power of suppliers - Impact of key factors in 2025 and 2030

7.4 Threat of new entrants

Threat of new entrants - Impact of key factors in 2025 and 2030

7.5 Threat of substitutes

Threat of substitutes - Impact of key factors in 2025 and 2030

7.6 Threat of rivalry

Threat of rivalry - Impact of key factors in 2025 and 2030

7.7 Market condition

Chart on Market condition - Five forces 2025 and 2030

8. Market Segmentation by End-user

8.1 Market segments

Chart on End-user - Market share 2025-2030 (%)
Data Table on End-user - Market share 2025-2030 (%)

8.2 Comparison by End-user

Chart on Comparison by End-user
Data Table on Comparison by End-user

8.3 K-12 - Market size and forecast 2025-2030

Chart on K-12 - Market size and forecast 2025-2030 ($ million)
Data Table on K-12 - Market size and forecast 2025-2030 ($ million)
Chart on K-12 - Year-over-year growth 2025-2030 (%)
Data Table on K-12 - Year-over-year growth 2025-2030 (%)

8.4 Higher education - Market size and forecast 2025-2030

Chart on Higher education - Market size and forecast 2025-2030 ($ million)
Data Table on Higher education - Market size and forecast 2025-2030 ($ million)
Chart on Higher education - Year-over-year growth 2025-2030 (%)
Data Table on Higher education - Year-over-year growth 2025-2030 (%)

8.5 Market opportunity by End-user

Market opportunity by End-user ($ million)
Data Table on Market opportunity by End-user ($ million)

9. Market Segmentation by Product

9.1 Market segments

Chart on Product - Market share 2025-2030 (%)
Data Table on Product - Market share 2025-2030 (%)

9.2 Comparison by Product

Chart on Comparison by Product
Data Table on Comparison by Product

9.3 Laptop - Market size and forecast 2025-2030

Chart on Laptop - Market size and forecast 2025-2030 ($ million)
Data Table on Laptop - Market size and forecast 2025-2030 ($ million)
Chart on Laptop - Year-over-year growth 2025-2030 (%)
Data Table on Laptop - Year-over-year growth 2025-2030 (%)

9.4 Tablet - Market size and forecast 2025-2030

Chart on Tablet - Market size and forecast 2025-2030 ($ million)
Data Table on Tablet - Market size and forecast 2025-2030 ($ million)
Chart on Tablet - Year-over-year growth 2025-2030 (%)
Data Table on Tablet - Year-over-year growth 2025-2030 (%)

9.5 Desktop - Market size and forecast 2025-2030

Chart on Desktop - Market size and forecast 2025-2030 ($ million)
Data Table on Desktop - Market size and forecast 2025-2030 ($ million)
Chart on Desktop - Year-over-year growth 2025-2030 (%)
Data Table on Desktop - Year-over-year growth 2025-2030 (%)

9.6 Market opportunity by Product

Market opportunity by Product ($ million)
Data Table on Market opportunity by Product ($ million)

10. Market Segmentation by OS

10.1 Market segments

Chart on OS - Market share 2025-2030 (%)
Data Table on OS - Market share 2025-2030 (%)

10.2 Comparison by OS

Chart on Comparison by OS
Data Table on Comparison by OS

10.3 Android - Market size and forecast 2025-2030

Chart on Android - Market size and forecast 2025-2030 ($ million)
Data Table on Android - Market size and forecast 2025-2030 ($ million)
Chart on Android - Year-over-year growth 2025-2030 (%)
Data Table on Android - Year-over-year growth 2025-2030 (%)

10.4 iOS - Market size and forecast 2025-2030

Chart on iOS - Market size and forecast 2025-2030 ($ million)
Data Table on iOS - Market size and forecast 2025-2030 ($ million)
Chart on iOS - Year-over-year growth 2025-2030 (%)
Data Table on iOS - Year-over-year growth 2025-2030 (%)

10.5 Windows - Market size and forecast 2025-2030

Chart on Windows - Market size and forecast 2025-2030 ($ million)
Data Table on Windows - Market size and forecast 2025-2030 ($ million)
Chart on Windows - Year-over-year growth 2025-2030 (%)
Data Table on Windows - Year-over-year growth 2025-2030 (%)

10.6 Market opportunity by OS

Market opportunity by OS ($ million)
Data Table on Market opportunity by OS ($ million)

11. Customer Landscape

11.1 Customer landscape overview

Analysis of price sensitivity, lifecycle, customer purchase basket, adoption rates, and purchase criteria

12. Geographic Landscape

12.1 Geographic segmentation

Chart on Market share by geography 2025-2030 (%)
Data Table on Market share by geography 2025-2030 (%)

12.2 Geographic comparison

Chart on Geographic comparison
Data Table on Geographic comparison

12.3 North America - Market size and forecast 2025-2030

Chart on North America - Market size and forecast 2025-2030 ($ million)
Data Table on North America - Market size and forecast 2025-2030 ($ million)
Chart on North America - Year-over-year growth 2025-2030 (%)
Data Table on North America - Year-over-year growth 2025-2030 (%)
Chart on Regional Comparison - North America
Data Table on Regional Comparison - North America

12.3.1 US - Market size and forecast 2025-2030

Chart on US - Market size and forecast 2025-2030 ($ million)
Data Table on US - Market size and forecast 2025-2030 ($ million)
Chart on US - Year-over-year growth 2025-2030 (%)
Data Table on US - Year-over-year growth 2025-2030 (%)

12.3.2 Canada - Market size and forecast 2025-2030

Chart on Canada - Market size and forecast 2025-2030 ($ million)
Data Table on Canada - Market size and forecast 2025-2030 ($ million)
Chart on Canada - Year-over-year growth 2025-2030 (%)
Data Table on Canada - Year-over-year growth 2025-2030 (%)

12.3.3 Mexico - Market size and forecast 2025-2030

Chart on Mexico - Market size and forecast 2025-2030 ($ million)
Data Table on Mexico - Market size and forecast 2025-2030 ($ million)
Chart on Mexico - Year-over-year growth 2025-2030 (%)
Data Table on Mexico - Year-over-year growth 2025-2030 (%)

12.4 Europe - Market size and forecast 2025-2030

Chart on Europe - Market size and forecast 2025-2030 ($ million)
Data Table on Europe - Market size and forecast 2025-2030 ($ million)
Chart on Europe - Year-over-year growth 2025-2030 (%)
Data Table on Europe - Year-over-year growth 2025-2030 (%)
Chart on Regional Comparison - Europe
Data Table on Regional Comparison - Europe

12.4.1 Germany - Market size and forecast 2025-2030

Chart on Germany - Market size and forecast 2025-2030 ($ million)
Data Table on Germany - Market size and forecast 2025-2030 ($ million)
Chart on Germany - Year-over-year growth 2025-2030 (%)
Data Table on Germany - Year-over-year growth 2025-2030 (%)

12.4.2 UK - Market size and forecast 2025-2030

Chart on UK - Market size and forecast 2025-2030 ($ million)
Data Table on UK - Market size and forecast 2025-2030 ($ million)
Chart on UK - Year-over-year growth 2025-2030 (%)
Data Table on UK - Year-over-year growth 2025-2030 (%)

12.4.3 France - Market size and forecast 2025-2030

Chart on France - Market size and forecast 2025-2030 ($ million)
Data Table on France - Market size and forecast 2025-2030 ($ million)
Chart on France - Year-over-year growth 2025-2030 (%)
Data Table on France - Year-over-year growth 2025-2030 (%)

12.4.4 Italy - Market size and forecast 2025-2030

Chart on Italy - Market size and forecast 2025-2030 ($ million)
Data Table on Italy - Market size and forecast 2025-2030 ($ million)
Chart on Italy - Year-over-year growth 2025-2030 (%)
Data Table on Italy - Year-over-year growth 2025-2030 (%)

12.4.5 Spain - Market size and forecast 2025-2030

Chart on Spain - Market size and forecast 2025-2030 ($ million)
Data Table on Spain - Market size and forecast 2025-2030 ($ million)
Chart on Spain - Year-over-year growth 2025-2030 (%)
Data Table on Spain - Year-over-year growth 2025-2030 (%)

12.4.6 Russia - Market size and forecast 2025-2030

Chart on Russia - Market size and forecast 2025-2030 ($ million)
Data Table on Russia - Market size and forecast 2025-2030 ($ million)
Chart on Russia - Year-over-year growth 2025-2030 (%)
Data Table on Russia - Year-over-year growth 2025-2030 (%)

12.5 APAC - Market size and forecast 2025-2030

Chart on APAC - Market size and forecast 2025-2030 ($ million)
Data Table on APAC - Market size and forecast 2025-2030 ($ million)
Chart on APAC - Year-over-year growth 2025-2030 (%)
Data Table on APAC - Year-over-year growth 2025-2030 (%)
Chart on Regional Comparison - APAC
Data Table on Regional Comparison - APAC

12.5.1 China - Market size and forecast 2025-2030

Chart on China - Market size and forecast 2025-2030 ($ million)
Data Table on China - Market size and forecast 2025-2030 ($ million)
Chart on China - Year-over-year growth 2025-2030 (%)
Data Table on China - Year-over-year growth 2025-2030 (%)

12.5.2 India - Market size and forecast 2025-2030

Chart on India - Market size and forecast 2025-2030 ($ million)
Data Table on India - Market size and forecast 2025-2030 ($ million)
Chart on India - Year-over-year growth 2025-2030 (%)
Data Table on India - Year-over-year growth 2025-2030 (%)

12.5.3 Japan - Market size and forecast 2025-2030

Chart on Japan - Market size and forecast 2025-2030 ($ million)
Data Table on Japan - Market size and forecast 2025-2030 ($ million)
Chart on Japan - Year-over-year growth 2025-2030 (%)
Data Table on Japan - Year-over-year growth 2025-2030 (%)

12.5.4 South Korea - Market size and forecast 2025-2030

Chart on South Korea - Market size and forecast 2025-2030 ($ million)
Data Table on South Korea - Market size and forecast 2025-2030 ($ million)
Chart on South Korea - Year-over-year growth 2025-2030 (%)
Data Table on South Korea - Year-over-year growth 2025-2030 (%)

12.5.5 Australia - Market size and forecast 2025-2030

Chart on Australia - Market size and forecast 2025-2030 ($ million)
Data Table on Australia - Market size and forecast 2025-2030 ($ million)
Chart on Australia - Year-over-year growth 2025-2030 (%)
Data Table on Australia - Year-over-year growth 2025-2030 (%)

12.5.6 Indonesia - Market size and forecast 2025-2030

Chart on Indonesia - Market size and forecast 2025-2030 ($ million)
Data Table on Indonesia - Market size and forecast 2025-2030 ($ million)
Chart on Indonesia - Year-over-year growth 2025-2030 (%)
Data Table on Indonesia - Year-over-year growth 2025-2030 (%)

12.6 South America - Market size and forecast 2025-2030

Chart on South America - Market size and forecast 2025-2030 ($ million)
Data Table on South America - Market size and forecast 2025-2030 ($ million)
Chart on South America - Year-over-year growth 2025-2030 (%)
Data Table on South America - Year-over-year growth 2025-2030 (%)
Chart on Regional Comparison - South America
Data Table on Regional Comparison - South America

12.6.1 Brazil - Market size and forecast 2025-2030

Chart on Brazil - Market size and forecast 2025-2030 ($ million)
Data Table on Brazil - Market size and forecast 2025-2030 ($ million)
Chart on Brazil - Year-over-year growth 2025-2030 (%)
Data Table on Brazil - Year-over-year growth 2025-2030 (%)

12.6.2 Argentina - Market size and forecast 2025-2030

Chart on Argentina - Market size and forecast 2025-2030 ($ million)
Data Table on Argentina - Market size and forecast 2025-2030 ($ million)
Chart on Argentina - Year-over-year growth 2025-2030 (%)
Data Table on Argentina - Year-over-year growth 2025-2030 (%)

12.6.3 Chile - Market size and forecast 2025-2030

Chart on Chile - Market size and forecast 2025-2030 ($ million)
Data Table on Chile - Market size and forecast 2025-2030 ($ million)
Chart on Chile - Year-over-year growth 2025-2030 (%)
Data Table on Chile - Year-over-year growth 2025-2030 (%)

12.7 Middle East and Africa - Market size and forecast 2025-2030

Chart on Middle East and Africa - Market size and forecast 2025-2030 ($ million)
Data Table on Middle East and Africa - Market size and forecast 2025-2030 ($ million)
Chart on Middle East and Africa - Year-over-year growth 2025-2030 (%)
Data Table on Middle East and Africa - Year-over-year growth 2025-2030 (%)
Chart on Regional Comparison - Middle East and Africa
Data Table on Regional Comparison - Middle East and Africa

12.7.1 Saudi Arabia - Market size and forecast 2025-2030

Chart on Saudi Arabia - Market size and forecast 2025-2030 ($ million)
Data Table on Saudi Arabia - Market size and forecast 2025-2030 ($ million)
Chart on Saudi Arabia - Year-over-year growth 2025-2030 (%)
Data Table on Saudi Arabia - Year-over-year growth 2025-2030 (%)

12.7.2 UAE - Market size and forecast 2025-2030

Chart on UAE - Market size and forecast 2025-2030 ($ million)
Data Table on UAE - Market size and forecast 2025-2030 ($ million)
Chart on UAE - Year-over-year growth 2025-2030 (%)
Data Table on UAE - Year-over-year growth 2025-2030 (%)

12.7.3 South Africa - Market size and forecast 2025-2030

Chart on South Africa - Market size and forecast 2025-2030 ($ million)
Data Table on South Africa - Market size and forecast 2025-2030 ($ million)
Chart on South Africa - Year-over-year growth 2025-2030 (%)
Data Table on South Africa - Year-over-year growth 2025-2030 (%)

12.7.4 Turkey - Market size and forecast 2025-2030

Chart on Turkey - Market size and forecast 2025-2030 ($ million)
Data Table on Turkey - Market size and forecast 2025-2030 ($ million)
Chart on Turkey - Year-over-year growth 2025-2030 (%)
Data Table on Turkey - Year-over-year growth 2025-2030 (%)

12.7.5 Israel - Market size and forecast 2025-2030

Chart on Israel - Market size and forecast 2025-2030 ($ million)
Data Table on Israel - Market size and forecast 2025-2030 ($ million)
Chart on Israel - Year-over-year growth 2025-2030 (%)
Data Table on Israel - Year-over-year growth 2025-2030 (%)

12.8 Market opportunity by geography

Market opportunity by geography ($ million)
Data Tables on Market opportunity by geography ($ million)

13. Drivers, Challenges, and Opportunity

13.1 Market drivers

Integration of AI and adaptive learning technologies
Proliferation of one-to-one computing initiatives and digital equity programs
Normalization of hybrid learning and blended pedagogical models

13.2 Market challenges

Escalating hardware procurement costs and component scarcity
Sophisticated cybersecurity threats and AI-driven identity fraud
Regulatory complexity and data sovereignty requirements

13.3 Impact of drivers and challenges

Impact of drivers and challenges in 2025 and 2030

13.4 Market opportunities

Adoption of on-device AI and neural processing
Proliferation of modular designs and sustainable lifecycle management
Emergence of immersive extended reality and spatial computing tools

14. Competitive Landscape

14.1 Overview

14.2

Overview on criticality of inputs and factors of differentiation

14.3 Landscape disruption

Overview on factors of disruption

14.4 Industry risks

Impact of key risks on business

15. Competitive Analysis

15.1 Companies profiled

Companies covered

15.2 Company ranking index

15.3 Market positioning of companies

Matrix on companies position and classification

15.4 Acer Inc.

Acer Inc. - Overview
Acer Inc. - Business segments
Acer Inc. - Key news
Acer Inc. - Key offerings
Acer Inc. - Segment focus
SWOT

15.5 Apple Inc.

Apple Inc. - Overview
Apple Inc. - Business segments
Apple Inc. - Key news
Apple Inc. - Key offerings
Apple Inc. - Segment focus
SWOT

15.6 ASUSTeK Computer Inc.

ASUSTeK Computer Inc. - Overview
ASUSTeK Computer Inc. - Business segments
ASUSTeK Computer Inc. - Key news
ASUSTeK Computer Inc. - Key offerings
ASUSTeK Computer Inc. - Segment focus
SWOT

15.7 Dell Technologies Inc.

Dell Technologies Inc. - Overview
Dell Technologies Inc. - Business segments
Dell Technologies Inc. - Key offerings
Dell Technologies Inc. - Segment focus
SWOT

15.8 Elitegroup Computer Systems Co.

Elitegroup Computer Systems Co. - Overview
Elitegroup Computer Systems Co. - Business segments
Elitegroup Computer Systems Co. - Key offerings
Elitegroup Computer Systems Co. - Segment focus
SWOT

15.9 Google LLC

Google LLC - Overview
Google LLC - Product / Service
Google LLC - Key offerings
SWOT

15.10 HMD Global Oy

HMD Global Oy - Overview
HMD Global Oy - Product / Service
HMD Global Oy - Key offerings
SWOT

15.11 Honor Device Co. Ltd.

Honor Device Co. Ltd. - Overview
Honor Device Co. Ltd. - Product / Service
Honor Device Co. Ltd. - Key offerings
SWOT

15.12 HP Inc.

HP Inc. - Overview
HP Inc. - Business segments
HP Inc. - Key news
HP Inc. - Key offerings
HP Inc. - Segment focus
SWOT

15.13 Huawei Technologies Co. Ltd.

Huawei Technologies Co. Ltd. - Overview
Huawei Technologies Co. Ltd. - Business segments
Huawei Technologies Co. Ltd. - Key news
Huawei Technologies Co. Ltd. - Key offerings
Huawei Technologies Co. Ltd. - Segment focus
SWOT

15.14 Lenovo Group Ltd.

Lenovo Group Ltd. - Overview
Lenovo Group Ltd. - Business segments
Lenovo Group Ltd. - Key offerings
Lenovo Group Ltd. - Segment focus
SWOT

15.15 Microsoft Corp.

Microsoft Corp. - Overview
Microsoft Corp. - Business segments
Microsoft Corp. - Key news
Microsoft Corp. - Key offerings
Microsoft Corp. - Segment focus
SWOT

15.16 OnePlus Technology Co. Ltd.

OnePlus Technology Co. Ltd. - Overview
OnePlus Technology Co. Ltd. - Product / Service
OnePlus Technology Co. Ltd. - Key offerings
SWOT

15.17 Samsung Electronics Co. Ltd.

Samsung Electronics Co. Ltd. - Overview
Samsung Electronics Co. Ltd. - Business segments
Samsung Electronics Co. Ltd. - Key news
Samsung Electronics Co. Ltd. - Key offerings
Samsung Electronics Co. Ltd. - Segment focus
SWOT

15.18 Xiaomi Corp.

Xiaomi Corp. - Overview
Xiaomi Corp. - Business segments
Xiaomi Corp. - Key news
Xiaomi Corp. - Key offerings
Xiaomi Corp. - Segment focus
SWOT

16. Appendix

16.1 Scope of the report

Market definition
Objectives
Notes and caveats

16.2 Inclusions and exclusions checklist

Inclusions checklist
Exclusions checklist

16.3 Currency conversion rates for US$

16.4 Research methodology

16.5 Data procurement

Information sources

16.6 Data validation

16.7 Validation techniques employed for market sizing

16.8 Data synthesis

16.9 360 degree market analysis

16.10 List of abbreviations

Research Methodology

Technavio presents a detailed picture of the market by way of study, synthesis, and summation of data from multiple sources. The analysts have presented the various facets of the market with a particular focus on identifying the key industry influencers. The data thus presented is comprehensive, reliable, and the result of extensive research, both primary and secondary.

INFORMATION SOURCES

Primary sources

  • Manufacturers and suppliers
  • Channel partners
  • Industry experts
  • Strategic decision makers

Secondary sources

  • Industry journals and periodicals
  • Government data
  • Financial reports of key industry players
  • Historical data
  • Press releases

DATA ANALYSIS

Data Synthesis

  • Collation of data
  • Estimation of key figures
  • Analysis of derived insights

Data Validation

  • Triangulation with data models
  • Reference against proprietary databases
  • Corroboration with industry experts

REPORT WRITING

Qualitative

  • Market drivers
  • Market challenges
  • Market trends
  • Five forces analysis

Quantitative

  • Market size and forecast
  • Market segmentation
  • Geographical insights
  • Competitive landscape

Interested in this report?

Get your sample now to see our research methodology and insights!

Download Now

Frequently Asked Questions

Education Personal Computer (PC) And Tablet market growth will increase by USD 39202.9 million during 2026-2030.

The Education Personal Computer (PC) And Tablet market is expected to grow at a CAGR of 12.8% during 2026-2030.

Education Personal Computer (PC) And Tablet market is segmented by End-user (K-12, Higher education) Product (Laptop, Tablet, Desktop) Os (Android, iOS, Windows)

Acer Inc., Apple Inc., ASUSTeK Computer Inc., Chuwi Innovation Ltd., Dell Technologies Inc., Dynabook Singapore Pte. Ltd., Elitegroup Computer Systems Co., Google LLC, Guangzhou Shangke Info. Co., HMD Global Oy, Honor Device Co. Ltd., HP Inc., Huawei Technologies Co. Ltd., Lenovo Group Ltd., Microsoft Corp., Nexstgo Co. Ltd., OnePlus Technology Co. Ltd., Samsung Electronics Co. Ltd., Xiaomi Corp. are a few of the key vendors in the Education Personal Computer (PC) And Tablet market.

Europe will register the highest growth rate of 29.1% among the other regions. Therefore, the Education Personal Computer (PC) And Tablet market in Europe is expected to garner significant business opportunities for the vendors during the forecast period.

US, Canada, Mexico, Germany, UK, France, Italy, Spain, Russia, China, India, Japan, South Korea, Australia, Indonesia, Brazil, Argentina, Chile, Saudi Arabia, UAE, South Africa, Turkey, Israel

  • Integration of AI and adaptive learning technologies is the driving factor this market.

The Education Personal Computer (PC) And Tablet market vendors should focus on grabbing business opportunities from the End-user segment as it accounted for the largest market share in the base year.
RIA - Research AI Assistant
Ask RIA