Embedded Computer Market Analysis, Size, and Forecast 2026-2030: Europe (Germany, UK, and France), APAC (China, Japan, and India), North America (US, Canada, and Mexico), Middle East and Africa (Saudi Arabia, UAE, and South Africa), South America (Brazil and Argentina), and Rest of World (ROW)

Embedded Computer Market Analysis, Size, and Forecast 2026-2030:
Europe (Germany, UK, and France), APAC (China, Japan, and India), North America (US, Canada, and Mexico), Middle East and Africa (Saudi Arabia, UAE, and South Africa), South America (Brazil and Argentina), and Rest of World (ROW)

Published: Mar 2026 314 Pages SKU: IRTNTR40444

Market Overview at a Glance

$20.34 B
Market Opportunity
6.9%
CAGR 2025 - 2030
35.4%
Europe Growth
$18.55 B
COMs segment 2024

Embedded Computer Market Size 2026-2030

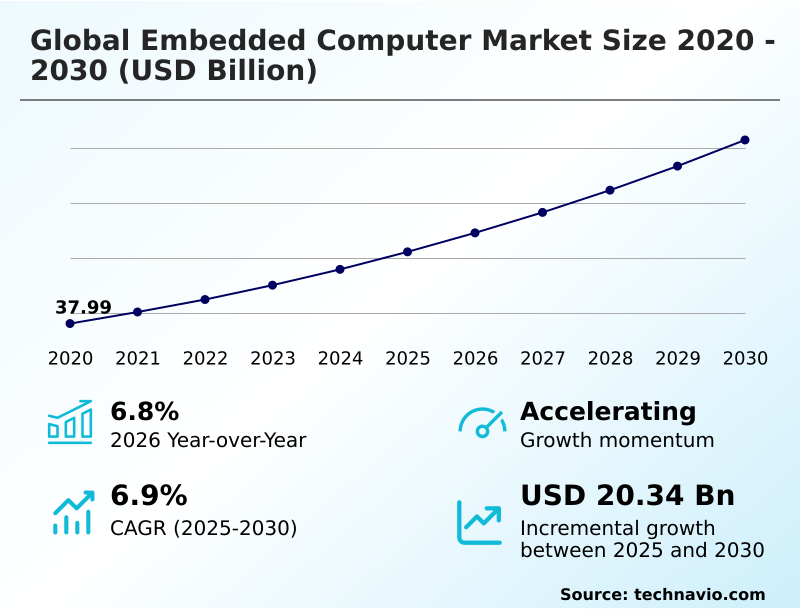
The embedded computer market size is valued to increase by USD 20.34 billion, at a CAGR of 6.9% from 2025 to 2030. Proliferation of IoT and shift toward edge computing will drive the embedded computer market.

Major Market Trends & Insights

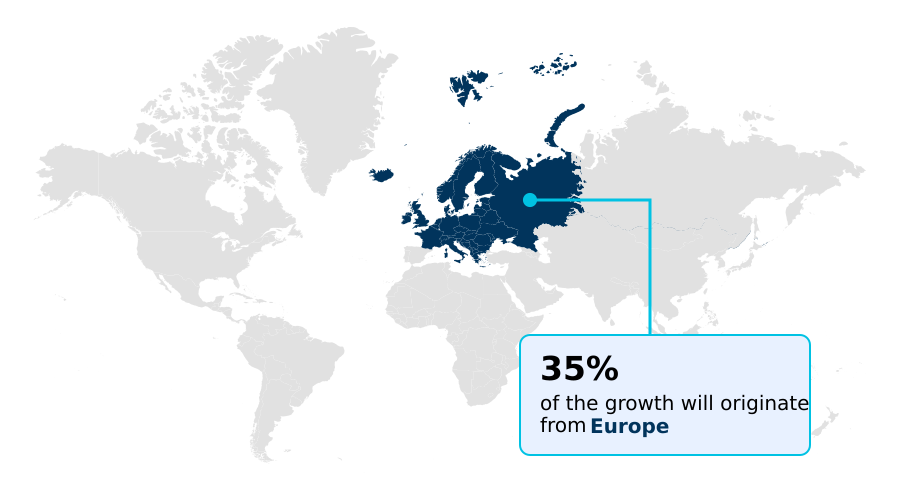
  • Europe dominated the market and accounted for a 35.4% growth during the forecast period.
  • By Product - COMs segment was valued at USD 18.55 billion in 2024
  • By End-user - Industrial automation segment accounted for the largest market revenue share in 2024

Market Size & Forecast

  • Market Opportunities: USD 33.37 billion
  • Market Future Opportunities: USD 20.34 billion
  • CAGR from 2025 to 2030 : 6.9%

Market Summary

  • The embedded computer market is experiencing a profound transformation, driven by the convergence of industrial digitalization and pervasive connectivity. This evolution extends far beyond mere processing power, focusing instead on creating intelligent, autonomous systems capable of real-time decision-making at the network's edge.
  • A key driver is the integration of artificial intelligence and machine learning, which necessitates a shift towards heterogeneous computing architectures that combine general-purpose CPUs with specialized graphics processing units and neural processing units. For example, a modern manufacturing facility might deploy machine vision systems powered by ruggedized designs to perform high-speed quality inspections.
  • These systems use edge ai platforms to analyze video streams locally, identifying defects with an accuracy unachievable by human operators and reducing reliance on cloud processing, thereby minimizing latency and bandwidth costs.
  • However, this increased sophistication introduces challenges, including escalating design complexity, fundamental constraints of power consumption and thermal management, and critical security imperatives to protect connected devices from cyber threats.
  • The industry's trajectory is toward creating more integrated, power-efficient, and secure system-on-chip solutions that can manage these competing demands while enabling the next wave of intelligent, connected applications across automotive, medical, and industrial sectors.

What will be the Size of the Embedded Computer Market during the forecast period?

Get Key Insights on Market Forecast (PDF) Request Free Sample

How is the Embedded Computer Market Segmented?

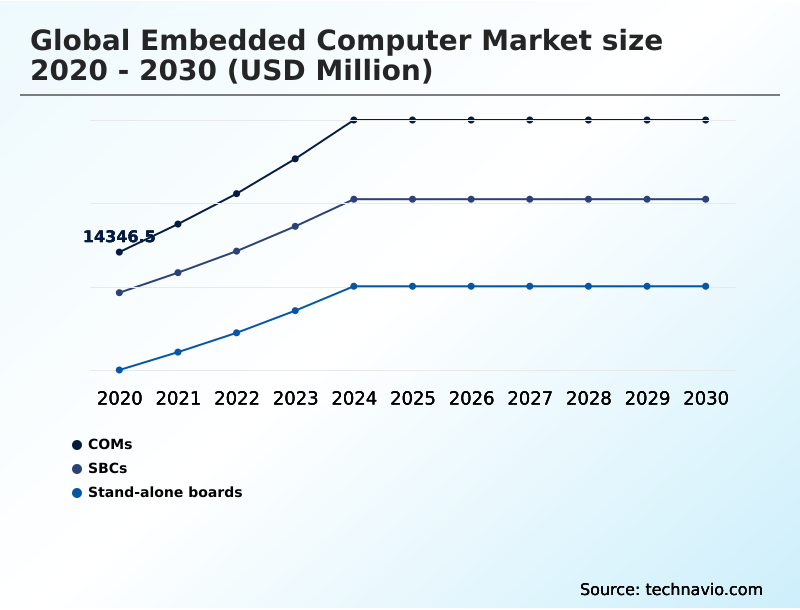
The embedded computer industry research report provides comprehensive data (region-wise segment analysis), with forecasts and estimates in "USD million" for the period 2026-2030, as well as historical data from 2020-2024 for the following segments.

  • Product
    • COMs
    • SBCs
    • Stand-alone boards
  • End-user
    • Industrial automation
    • Military and defense
    • Medical
    • Communication
    • Others
  • Cpu architecture
    • x86
    • ARM
    • PowerPC
    • Others
  • Geography
    • Europe
      • Germany
      • UK
      • France
    • APAC
      • China
      • Japan
      • India
    • North America
      • US
      • Canada
      • Mexico
    • Middle East and Africa
      • Saudi Arabia
      • UAE
      • South Africa
    • South America
      • Brazil
      • Argentina
    • Rest of World (ROW)

By Product Insights

The coms segment is estimated to witness significant growth during the forecast period.

Market segmentation by product highlights the strategic importance of modular and integrated solutions.

The computer-on-modules segment, based on the system-on-module concept, allows for accelerated product development and straightforward upgrade paths, a key advantage in markets like medical technology that require long product lifecycles.

Utilizing pre-certified modules can shorten the design-in phase by up to 50%.

In contrast, single-board computers offer a complete, cost-effective solution on a single board, popular in applications from education to light industrial use, supported by extensive software development kits and embedded linux development communities.

Stand-alone boards cater to traditional industrial needs, offering stability and extensive I/O for applications requiring robust, long-lasting performance, such as asset tracking solutions and legacy system integration.

Request Free Sample

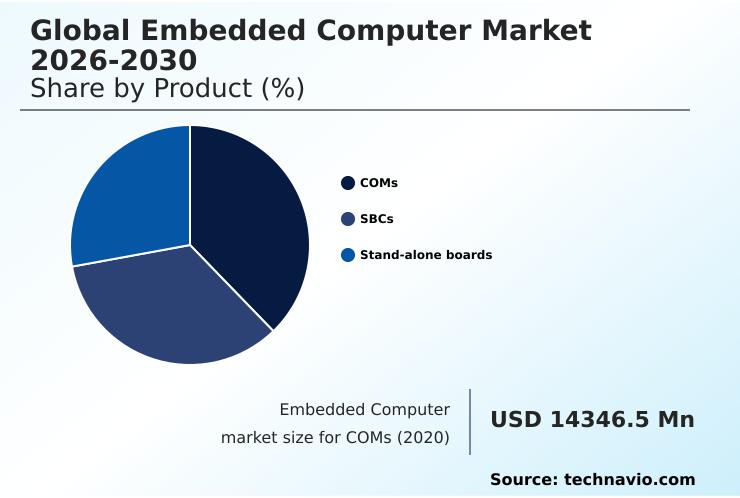
The COMs segment was valued at USD 18.55 billion in 2024 and showed a gradual increase during the forecast period.

Request Free Sample

Regional Analysis

Europe is estimated to contribute 35.4% to the growth of the global market during the forecast period.Technavio’s analysts have elaborately explained the regional trends and drivers that shape the market during the forecast period.

See How Embedded Computer Market Demand is Rising in Europe Request Free Sample

Regional dynamics define market opportunities, with APAC leading in manufacturing scale and market expansion, driven by consumer electronics and the adoption of smart city technologies.

North America is a hub for innovation in telecommunications infrastructure and advanced data acquisition systems, with significant investment in domestic semiconductor capabilities. The region's focus on R&D has resulted in a 20% year-over-year increase in patent filings for embedded AI.

Europe excels in creating high-reliability automotive embedded systems and platforms for industrial automation, where adherence to stringent regulatory standards is paramount.

Demand in these regions for sophisticated human-machine interfaces and remote device management platforms is growing, driven by the need for enhanced operational control and efficiency.

Market Dynamics

Our researchers analyzed the data with 2025 as the base year, along with the key drivers, trends, and challenges. A holistic analysis of drivers will help companies refine their marketing strategies to gain a competitive advantage.

  • Strategic decision-making in the embedded computer market involves navigating a complex web of trade-offs. The fundamental choice of x86 vs arm for industrial automation hinges on balancing legacy software support against power efficiency. Similarly, engineers must constantly weigh power consumption vs performance in embedded systems, a critical factor for both battery-powered IoT devices and thermally constrained industrial PCs.
  • The process for managing design complexity in soc development has become a core competency, as platforms now integrate diverse processing elements. This necessitates sophisticated software development for heterogeneous computing.
  • For applications demanding high reliability, such as in military and defense or medical devices, the focus shifts to sourcing ruggedized computer for military and defense and achieving functional safety certification for medical devices.
  • The question of choosing coms vs sbcs for new product design depends on factors like scalability, development speed, and total cost of ownership, with system-on-module carrier board design offering modularity. Implementing robust security, including a secure boot implementation in iot devices and adhering to iot gateway security best practices and cybersecurity standards for connected vehicles, is no longer optional.
  • This adds overhead, as development cycles for systems requiring long-term availability for industrial pcs are often 50% longer than consumer-grade products due to rigorous validation. Other critical considerations include thermal design for fanless embedded computers, hardware acceleration for edge ai inference, optimizing latency in real-time operating systems, and upgrading legacy systems with modular computers.
  • The integration of fpgas in embedded vision systems and multi-gigabit ethernet for industrial networks further illustrates the specialized knowledge required for high-speed data acquisition in embedded systems.

What are the key market drivers leading to the rise in the adoption of Embedded Computer Industry?

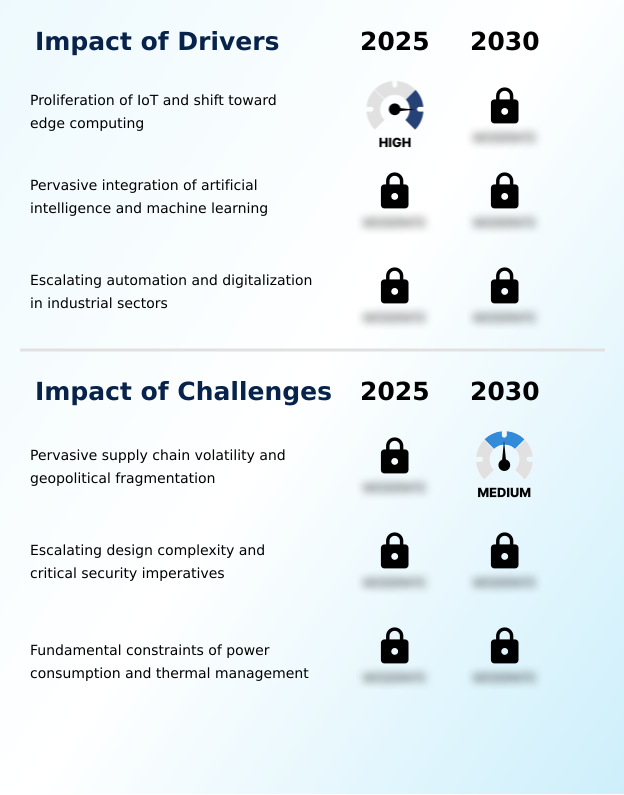
  • The proliferation of IoT devices and the corresponding strategic architectural shift toward edge computing are the primary drivers propelling market expansion.

  • The expansion of IoT, coupled with the shift to edge computing, is a primary market driver. This creates demand for intelligent iot gateway devices and edge ai platforms capable of real-time processing and predictive maintenance analytics.
  • The migration of AI workloads to the edge unlocks new services, with on-device machine vision systems improving defect detection in manufacturing by 35%.
  • This requires a new class of industrial automation computers with hardware acceleration to handle neural network inference efficiently.
  • The digitalization of industry, or Industry 4.0, serves as another foundational driver, fueling the need for ruggedized designs and time-sensitive networking to create interconnected and data-driven production environments. This ensures the long-term availability of stable, high-value systems.

What are the market trends shaping the Embedded Computer Industry?

  • The market is increasingly defined by the ascendancy of heterogeneous computing architectures. This paradigm shift integrates specialized processors to optimize performance and power efficiency for diverse workloads.

  • A dominant trend is the move toward heterogeneous computing, where a system-on-chip integrates specialized processing units for maximum efficiency. This embedded system design approach combines graphics processing units and field-programmable gate arrays to handle diverse workloads, from medical imaging processing to advanced driver-assistance systems.
  • The convergence of functional safety and hardware-based cybersecurity is another critical development, particularly for mission-critical applications in aerospace and automotive sectors. This has led to the adoption of features like redundant cores and secure boot processes, with certified systems reducing failure rates by over 25%.
  • Furthermore, the standardization of high-speed i/o interfaces like pci express and multi-gigabit ethernet is essential for enabling the low-latency communication needed in modern industrial control systems, increasing data throughput by 60%.

What challenges does the Embedded Computer Industry face during its growth?

  • Pervasive supply chain volatility, compounded by geopolitical fragmentation, presents a significant and persistent challenge to market stability and long-term growth.

  • A fundamental challenge is managing power consumption management and thermal management solutions in increasingly compact and powerful devices. The trade-off between performance and heat dissipation requires advanced passive cooling systems and complex firmware development to prevent thermal throttling, which can degrade performance by up to 30% in high-load scenarios.
  • Escalating design complexity and the imperative for robust security present another hurdle. Integrating multiple processors within a single device complicates validation, while the need for features like trusted execution environments adds an estimated 15% to development costs.
  • This is particularly acute in safety-critical systems, where achieving certification is a non-negotiable and costly requirement for market entry, demanding extensive expertise in both mechatronics integration and cybersecurity.

Exclusive Technavio Analysis on Customer Landscape

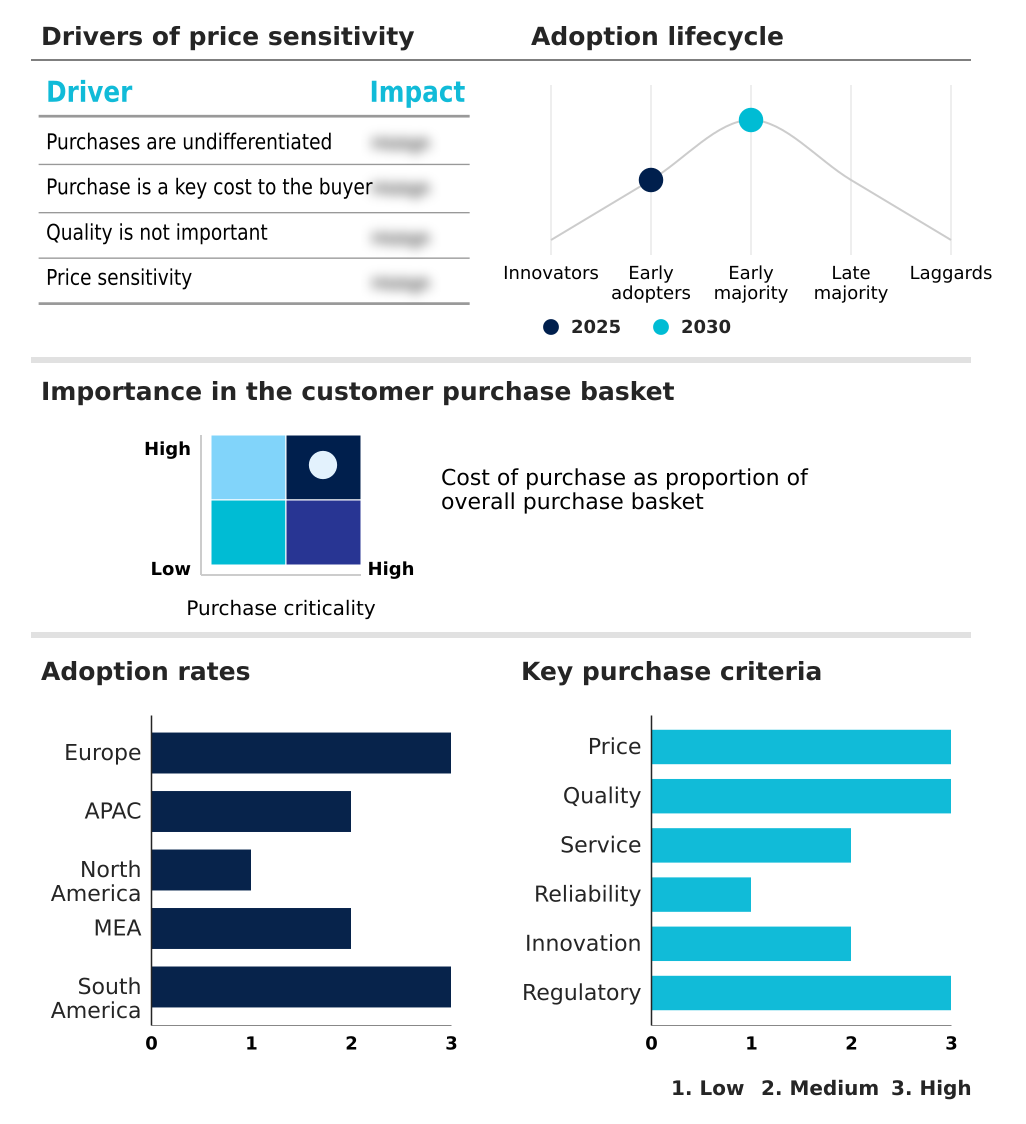
The embedded computer market forecasting report includes the adoption lifecycle of the market, covering from the innovator’s stage to the laggard’s stage. It focuses on adoption rates in different regions based on penetration. Furthermore, the embedded computer market report also includes key purchase criteria and drivers of price sensitivity to help companies evaluate and develop their market growth analysis strategies.

Customer Landscape of Embedded Computer Industry

Competitive Landscape

Companies are implementing various strategies, such as strategic alliances, embedded computer market forecast, partnerships, mergers and acquisitions, geographical expansion, and product/service launches, to enhance their presence in the industry.

AAEON Technology Inc. - Provides a comprehensive range of industrial automation computers, edge AI systems, and single-board computers tailored for diverse IoT and embedded design-in services.

The industry research and growth report includes detailed analyses of the competitive landscape of the market and information about key companies, including:

  • AAEON Technology Inc.
  • ADLINK Technology Inc.
  • Advantech Co. Ltd.
  • American Portwell Technology
  • Axiomtek Co. Ltd.
  • congatec GmbH
  • Curtiss Wright Corp.
  • DFI Inc.
  • Digi International Inc.
  • EUROTECH Spa
  • IEI Integration Corp.
  • Intel Corp.
  • Kontron AG
  • Lanner Electronics Inc.
  • NVIDIA Corp.
  • Raspberry Pi
  • Toradex AG
  • VIA TECHNOLOGIES Inc.

Qualitative and quantitative analysis of companies has been conducted to help clients understand the wider business environment as well as the strengths and weaknesses of key industry players. Data is qualitatively analyzed to categorize companies as pure play, category-focused, industry-focused, and diversified; it is quantitatively analyzed to categorize companies as dominant, leading, strong, tentative, and weak.

Recent Development and News in Embedded computer market

  • In September, 2024, NVIDIA Corp. announced the expansion of its Jetson platform with a new series of functional safety certified modules, specifically targeting Level 3 autonomous driving systems and collaborative robotics.
  • In November, 2024, Advantech Co. Ltd. partnered with a leading 5G chipset provider to launch a new line of industrial IoT gateways featuring integrated 5G NR connectivity, designed to support massive machine-type communications and ultra-reliable low-latency applications.
  • In February, 2025, Intel Corp. completed its acquisition of a fabless semiconductor startup specializing in ultra-low-power neural processing units, a strategic move to bolster its edge AI portfolio for battery-operated devices.
  • In May, 2025, The European Commission announced the final draft of its 'Cyber Resilience Act for Industrial Systems,' mandating hardware-based cybersecurity features, including secure boot and trusted execution environments, for all critical infrastructure control systems sold within the EU starting in 2028.

Dive into Technavio’s robust research methodology, blending expert interviews, extensive data synthesis, and validated models for unparalleled Embedded Computer Market insights. See full methodology.

Market Scope
Page number 314
Base year 2025
Historic period 2020-2024
Forecast period 2026-2030
Growth momentum & CAGR Accelerate at a CAGR of 6.9%
Market growth 2026-2030 USD 20335.0 million
Market structure Fragmented
YoY growth 2025-2026(%) 6.8%
Key countries Germany, UK, France, Italy, Spain, The Netherlands, China, Japan, India, South Korea, Australia, Indonesia, US, Canada, Mexico, Saudi Arabia, UAE, South Africa, Israel, Turkey, Brazil, Argentina and Chile
Competitive landscape Leading Companies, Market Positioning of Companies, Competitive Strategies, and Industry Risks

Request Free Sample

Research Analyst Overview

  • The embedded computer market is undergoing a strategic pivot from general-purpose processing to highly specialized, workload-optimized solutions. This shift is most evident in the move toward heterogeneous computing, a design philosophy that integrates various co-processors like graphics processing units and dedicated neural processing units onto a single system-on-chip.
  • This trend has profound boardroom implications, forcing a re-evaluation of R&D budgets to account for more complex hardware and software co-design, particularly for new edge ai platforms. The decision to adopt these architectures impacts long-term product roadmaps, requiring a commitment to new software ecosystems and engineering skill sets.
  • While increasing complexity, this approach delivers tangible performance benefits; for instance, integrated ai accelerators can execute real-time processing tasks for machine vision systems up to 10 times faster than traditional CPUs alone.
  • Consequently, competitive differentiation now hinges less on raw clock speed and more on the efficiency and performance of the entire system, encompassing computer-on-modules, single-board computers, and advanced i/o, including pci express and time-sensitive networking for industrial automation computers and iot gateway devices.
  • This evolution necessitates a deep understanding of functional safety and hardware-based cybersecurity to deliver reliable, ruggedized designs with robust power consumption management.

What are the Key Data Covered in this Embedded Computer Market Research and Growth Report?

  • What is the expected growth of the Embedded Computer Market between 2026 and 2030?

    • USD 20.34 billion, at a CAGR of 6.9%

  • What segmentation does the market report cover?

    • The report is segmented by Product (COMs, SBCs, and Stand-alone boards), End-user (Industrial automation, Military and defense, Medical, Communication, and Others), CPU Architecture (x86, ARM, PowerPC, and Others) and Geography (Europe, APAC, North America, Middle East and Africa, South America)

  • Which regions are analyzed in the report?

    • Europe, APAC, North America, Middle East and Africa and South America

  • What are the key growth drivers and market challenges?

    • Proliferation of IoT and shift toward edge computing, Pervasive supply chain volatility and geopolitical fragmentation

  • Who are the major players in the Embedded Computer Market?

    • AAEON Technology Inc., ADLINK Technology Inc., Advantech Co. Ltd., American Portwell Technology, Axiomtek Co. Ltd., congatec GmbH, Curtiss Wright Corp., DFI Inc., Digi International Inc., EUROTECH Spa, IEI Integration Corp., Intel Corp., Kontron AG, Lanner Electronics Inc., NVIDIA Corp., Raspberry Pi, Toradex AG and VIA TECHNOLOGIES Inc.

Market Research Insights

  • The market's dynamics are shaped by a relentless drive for efficiency and intelligence in connected devices. The adoption of advanced automotive embedded systems has led to a 30% reduction in response times for safety-critical functions, while new industrial control systems now offer predictive maintenance analytics that can lower unplanned downtime by over 40%.
  • This progress is facilitated by sophisticated software development kits that abstract hardware complexity, enabling faster firmware development. As smart city technologies become more widespread, the focus on remote device management and low-latency communication intensifies, with some IoT deployments demonstrating a 25% decrease in operational costs through optimized energy usage and asset tracking solutions.
  • The challenge remains to balance these performance gains with the demands of long-term availability and robust security protocols.

We can help! Our analysts can customize this embedded computer market research report to meet your requirements.

Get in touch

1. Executive Summary

1.1 Market overview

Executive Summary - Chart on Market Overview
Executive Summary - Data Table on Market Overview
Executive Summary - Chart on Global Market Characteristics
Executive Summary - Chart on Market by Geography
Executive Summary - Chart on Market Segmentation by Product
Executive Summary - Chart on Market Segmentation by End-user
Executive Summary - Chart on Market Segmentation by CPU Architecture
Executive Summary - Chart on Incremental Growth
Executive Summary - Data Table on Incremental Growth
Executive Summary - Chart on Company Market Positioning

2. Technavio Analysis

2.1 Analysis of price sensitivity, lifecycle, customer purchase basket, adoption rates, and purchase criteria

2.2 Criticality of inputs and Factors of differentiation

Chart on Overview on criticality of inputs and factors of differentiation

2.3 Factors of disruption

Chart on Overview on factors of disruption

2.4 Impact of drivers and challenges

Chart on Impact of drivers and challenges in 2025 and 2030

3. Market Landscape

3.1 Market ecosystem

Chart on Parent Market
Data Table on - Parent Market

3.2 Market characteristics

Chart on Market characteristics analysis

3.3 Value chain analysis

Chart on Value chain analysis

4. Market Sizing

4.1 Market definition

Data Table on Offerings of companies included in the market definition

4.2 Market segment analysis

Market segments

4.3 Market size 2025

4.4 Market outlook: Forecast for 2025-2030

Chart on Global - Market size and forecast 2025-2030 ($ million)
Data Table on Global - Market size and forecast 2025-2030 ($ million)
Chart on Global Market: Year-over-year growth 2025-2030 (%)
Data Table on Global Market: Year-over-year growth 2025-2030 (%)

5. Historic Market Size

5.1 Global Embedded Computer Market 2020 - 2024

Historic Market Size - Data Table on Global Embedded Computer Market 2020 - 2024 ($ million)

5.2 Product segment analysis 2020 - 2024

Historic Market Size - Product Segment 2020 - 2024 ($ million)

5.3 End-user segment analysis 2020 - 2024

Historic Market Size - End-user Segment 2020 - 2024 ($ million)

5.4 CPU Architecture segment analysis 2020 - 2024

Historic Market Size - CPU Architecture Segment 2020 - 2024 ($ million)

5.5 Geography segment analysis 2020 - 2024

Historic Market Size - Geography Segment 2020 - 2024 ($ million)

5.6 Country segment analysis 2020 - 2024

Historic Market Size - Country Segment 2020 - 2024 ($ million)

6. Qualitative Analysis

6.1 The AI impact on global embedded computer market

7. Five Forces Analysis

7.1 Five forces summary

Five forces analysis - Comparison between 2025 and 2030

7.2 Bargaining power of buyers

Bargaining power of buyers - Impact of key factors 2025 and 2030

7.3 Bargaining power of suppliers

Bargaining power of suppliers - Impact of key factors in 2025 and 2030

7.4 Threat of new entrants

Threat of new entrants - Impact of key factors in 2025 and 2030

7.5 Threat of substitutes

Threat of substitutes - Impact of key factors in 2025 and 2030

7.6 Threat of rivalry

Threat of rivalry - Impact of key factors in 2025 and 2030

7.7 Market condition

Chart on Market condition - Five forces 2025 and 2030

8. Market Segmentation by Product

8.1 Market segments

Chart on Product - Market share 2025-2030 (%)
Data Table on Product - Market share 2025-2030 (%)

8.2 Comparison by Product

Chart on Comparison by Product
Data Table on Comparison by Product

8.3 COMs - Market size and forecast 2025-2030

Chart on COMs - Market size and forecast 2025-2030 ($ million)
Data Table on COMs - Market size and forecast 2025-2030 ($ million)
Chart on COMs - Year-over-year growth 2025-2030 (%)
Data Table on COMs - Year-over-year growth 2025-2030 (%)

8.4 SBCs - Market size and forecast 2025-2030

Chart on SBCs - Market size and forecast 2025-2030 ($ million)
Data Table on SBCs - Market size and forecast 2025-2030 ($ million)
Chart on SBCs - Year-over-year growth 2025-2030 (%)
Data Table on SBCs - Year-over-year growth 2025-2030 (%)

8.5 Stand-alone boards - Market size and forecast 2025-2030

Chart on Stand-alone boards - Market size and forecast 2025-2030 ($ million)
Data Table on Stand-alone boards - Market size and forecast 2025-2030 ($ million)
Chart on Stand-alone boards - Year-over-year growth 2025-2030 (%)
Data Table on Stand-alone boards - Year-over-year growth 2025-2030 (%)

8.6 Market opportunity by Product

Market opportunity by Product ($ million)
Data Table on Market opportunity by Product ($ million)

9. Market Segmentation by End-user

9.1 Market segments

Chart on End-user - Market share 2025-2030 (%)
Data Table on End-user - Market share 2025-2030 (%)

9.2 Comparison by End-user

Chart on Comparison by End-user
Data Table on Comparison by End-user

9.3 Industrial automation - Market size and forecast 2025-2030

Chart on Industrial automation - Market size and forecast 2025-2030 ($ million)
Data Table on Industrial automation - Market size and forecast 2025-2030 ($ million)
Chart on Industrial automation - Year-over-year growth 2025-2030 (%)
Data Table on Industrial automation - Year-over-year growth 2025-2030 (%)

9.4 Military and defense - Market size and forecast 2025-2030

Chart on Military and defense - Market size and forecast 2025-2030 ($ million)
Data Table on Military and defense - Market size and forecast 2025-2030 ($ million)
Chart on Military and defense - Year-over-year growth 2025-2030 (%)
Data Table on Military and defense - Year-over-year growth 2025-2030 (%)

9.5 Medical - Market size and forecast 2025-2030

Chart on Medical - Market size and forecast 2025-2030 ($ million)
Data Table on Medical - Market size and forecast 2025-2030 ($ million)
Chart on Medical - Year-over-year growth 2025-2030 (%)
Data Table on Medical - Year-over-year growth 2025-2030 (%)

9.6 Communication - Market size and forecast 2025-2030

Chart on Communication - Market size and forecast 2025-2030 ($ million)
Data Table on Communication - Market size and forecast 2025-2030 ($ million)
Chart on Communication - Year-over-year growth 2025-2030 (%)
Data Table on Communication - Year-over-year growth 2025-2030 (%)

9.7 Others - Market size and forecast 2025-2030

Chart on Others - Market size and forecast 2025-2030 ($ million)
Data Table on Others - Market size and forecast 2025-2030 ($ million)
Chart on Others - Year-over-year growth 2025-2030 (%)
Data Table on Others - Year-over-year growth 2025-2030 (%)

9.8 Market opportunity by End-user

Market opportunity by End-user ($ million)
Data Table on Market opportunity by End-user ($ million)

10. Market Segmentation by CPU Architecture

10.1 Market segments

Chart on CPU Architecture - Market share 2025-2030 (%)
Data Table on CPU Architecture - Market share 2025-2030 (%)

10.2 Comparison by CPU Architecture

Chart on Comparison by CPU Architecture
Data Table on Comparison by CPU Architecture

10.3 x86 - Market size and forecast 2025-2030

Chart on x86 - Market size and forecast 2025-2030 ($ million)
Data Table on x86 - Market size and forecast 2025-2030 ($ million)
Chart on x86 - Year-over-year growth 2025-2030 (%)
Data Table on x86 - Year-over-year growth 2025-2030 (%)

10.4 ARM - Market size and forecast 2025-2030

Chart on ARM - Market size and forecast 2025-2030 ($ million)
Data Table on ARM - Market size and forecast 2025-2030 ($ million)
Chart on ARM - Year-over-year growth 2025-2030 (%)
Data Table on ARM - Year-over-year growth 2025-2030 (%)

10.5 PowerPC - Market size and forecast 2025-2030

Chart on PowerPC - Market size and forecast 2025-2030 ($ million)
Data Table on PowerPC - Market size and forecast 2025-2030 ($ million)
Chart on PowerPC - Year-over-year growth 2025-2030 (%)
Data Table on PowerPC - Year-over-year growth 2025-2030 (%)

10.6 Others - Market size and forecast 2025-2030

Chart on Others - Market size and forecast 2025-2030 ($ million)
Data Table on Others - Market size and forecast 2025-2030 ($ million)
Chart on Others - Year-over-year growth 2025-2030 (%)
Data Table on Others - Year-over-year growth 2025-2030 (%)

10.7 Market opportunity by CPU Architecture

Market opportunity by CPU Architecture ($ million)
Data Table on Market opportunity by CPU Architecture ($ million)

11. Customer Landscape

11.1 Customer landscape overview

Analysis of price sensitivity, lifecycle, customer purchase basket, adoption rates, and purchase criteria

12. Geographic Landscape

12.1 Geographic segmentation

Chart on Market share by geography 2025-2030 (%)
Data Table on Market share by geography 2025-2030 (%)

12.2 Geographic comparison

Chart on Geographic comparison
Data Table on Geographic comparison

12.3 Europe - Market size and forecast 2025-2030

Chart on Europe - Market size and forecast 2025-2030 ($ million)
Data Table on Europe - Market size and forecast 2025-2030 ($ million)
Chart on Europe - Year-over-year growth 2025-2030 (%)
Data Table on Europe - Year-over-year growth 2025-2030 (%)
Chart on Regional Comparison - Europe
Data Table on Regional Comparison - Europe

12.3.1 Germany - Market size and forecast 2025-2030

Chart on Germany - Market size and forecast 2025-2030 ($ million)
Data Table on Germany - Market size and forecast 2025-2030 ($ million)
Chart on Germany - Year-over-year growth 2025-2030 (%)
Data Table on Germany - Year-over-year growth 2025-2030 (%)

12.3.2 UK - Market size and forecast 2025-2030

Chart on UK - Market size and forecast 2025-2030 ($ million)
Data Table on UK - Market size and forecast 2025-2030 ($ million)
Chart on UK - Year-over-year growth 2025-2030 (%)
Data Table on UK - Year-over-year growth 2025-2030 (%)

12.3.3 France - Market size and forecast 2025-2030

Chart on France - Market size and forecast 2025-2030 ($ million)
Data Table on France - Market size and forecast 2025-2030 ($ million)
Chart on France - Year-over-year growth 2025-2030 (%)
Data Table on France - Year-over-year growth 2025-2030 (%)

12.3.4 Italy - Market size and forecast 2025-2030

Chart on Italy - Market size and forecast 2025-2030 ($ million)
Data Table on Italy - Market size and forecast 2025-2030 ($ million)
Chart on Italy - Year-over-year growth 2025-2030 (%)
Data Table on Italy - Year-over-year growth 2025-2030 (%)

12.3.5 Spain - Market size and forecast 2025-2030

Chart on Spain - Market size and forecast 2025-2030 ($ million)
Data Table on Spain - Market size and forecast 2025-2030 ($ million)
Chart on Spain - Year-over-year growth 2025-2030 (%)
Data Table on Spain - Year-over-year growth 2025-2030 (%)

12.3.6 The Netherlands - Market size and forecast 2025-2030

Chart on The Netherlands - Market size and forecast 2025-2030 ($ million)
Data Table on The Netherlands - Market size and forecast 2025-2030 ($ million)
Chart on The Netherlands - Year-over-year growth 2025-2030 (%)
Data Table on The Netherlands - Year-over-year growth 2025-2030 (%)

12.4 APAC - Market size and forecast 2025-2030

Chart on APAC - Market size and forecast 2025-2030 ($ million)
Data Table on APAC - Market size and forecast 2025-2030 ($ million)
Chart on APAC - Year-over-year growth 2025-2030 (%)
Data Table on APAC - Year-over-year growth 2025-2030 (%)
Chart on Regional Comparison - APAC
Data Table on Regional Comparison - APAC

12.4.1 China - Market size and forecast 2025-2030

Chart on China - Market size and forecast 2025-2030 ($ million)
Data Table on China - Market size and forecast 2025-2030 ($ million)
Chart on China - Year-over-year growth 2025-2030 (%)
Data Table on China - Year-over-year growth 2025-2030 (%)

12.4.2 Japan - Market size and forecast 2025-2030

Chart on Japan - Market size and forecast 2025-2030 ($ million)
Data Table on Japan - Market size and forecast 2025-2030 ($ million)
Chart on Japan - Year-over-year growth 2025-2030 (%)
Data Table on Japan - Year-over-year growth 2025-2030 (%)

12.4.3 India - Market size and forecast 2025-2030

Chart on India - Market size and forecast 2025-2030 ($ million)
Data Table on India - Market size and forecast 2025-2030 ($ million)
Chart on India - Year-over-year growth 2025-2030 (%)
Data Table on India - Year-over-year growth 2025-2030 (%)

12.4.4 South Korea - Market size and forecast 2025-2030

Chart on South Korea - Market size and forecast 2025-2030 ($ million)
Data Table on South Korea - Market size and forecast 2025-2030 ($ million)
Chart on South Korea - Year-over-year growth 2025-2030 (%)
Data Table on South Korea - Year-over-year growth 2025-2030 (%)

12.4.5 Australia - Market size and forecast 2025-2030

Chart on Australia - Market size and forecast 2025-2030 ($ million)
Data Table on Australia - Market size and forecast 2025-2030 ($ million)
Chart on Australia - Year-over-year growth 2025-2030 (%)
Data Table on Australia - Year-over-year growth 2025-2030 (%)

12.4.6 Indonesia - Market size and forecast 2025-2030

Chart on Indonesia - Market size and forecast 2025-2030 ($ million)
Data Table on Indonesia - Market size and forecast 2025-2030 ($ million)
Chart on Indonesia - Year-over-year growth 2025-2030 (%)
Data Table on Indonesia - Year-over-year growth 2025-2030 (%)

12.5 North America - Market size and forecast 2025-2030

Chart on North America - Market size and forecast 2025-2030 ($ million)
Data Table on North America - Market size and forecast 2025-2030 ($ million)
Chart on North America - Year-over-year growth 2025-2030 (%)
Data Table on North America - Year-over-year growth 2025-2030 (%)
Chart on Regional Comparison - North America
Data Table on Regional Comparison - North America

12.5.1 US - Market size and forecast 2025-2030

Chart on US - Market size and forecast 2025-2030 ($ million)
Data Table on US - Market size and forecast 2025-2030 ($ million)
Chart on US - Year-over-year growth 2025-2030 (%)
Data Table on US - Year-over-year growth 2025-2030 (%)

12.5.2 Canada - Market size and forecast 2025-2030

Chart on Canada - Market size and forecast 2025-2030 ($ million)
Data Table on Canada - Market size and forecast 2025-2030 ($ million)
Chart on Canada - Year-over-year growth 2025-2030 (%)
Data Table on Canada - Year-over-year growth 2025-2030 (%)

12.5.3 Mexico - Market size and forecast 2025-2030

Chart on Mexico - Market size and forecast 2025-2030 ($ million)
Data Table on Mexico - Market size and forecast 2025-2030 ($ million)
Chart on Mexico - Year-over-year growth 2025-2030 (%)
Data Table on Mexico - Year-over-year growth 2025-2030 (%)

12.6 Middle East and Africa - Market size and forecast 2025-2030

Chart on Middle East and Africa - Market size and forecast 2025-2030 ($ million)
Data Table on Middle East and Africa - Market size and forecast 2025-2030 ($ million)
Chart on Middle East and Africa - Year-over-year growth 2025-2030 (%)
Data Table on Middle East and Africa - Year-over-year growth 2025-2030 (%)
Chart on Regional Comparison - Middle East and Africa
Data Table on Regional Comparison - Middle East and Africa

12.6.1 Saudi Arabia - Market size and forecast 2025-2030

Chart on Saudi Arabia - Market size and forecast 2025-2030 ($ million)
Data Table on Saudi Arabia - Market size and forecast 2025-2030 ($ million)
Chart on Saudi Arabia - Year-over-year growth 2025-2030 (%)
Data Table on Saudi Arabia - Year-over-year growth 2025-2030 (%)

12.6.2 UAE - Market size and forecast 2025-2030

Chart on UAE - Market size and forecast 2025-2030 ($ million)
Data Table on UAE - Market size and forecast 2025-2030 ($ million)
Chart on UAE - Year-over-year growth 2025-2030 (%)
Data Table on UAE - Year-over-year growth 2025-2030 (%)

12.6.3 South Africa - Market size and forecast 2025-2030

Chart on South Africa - Market size and forecast 2025-2030 ($ million)
Data Table on South Africa - Market size and forecast 2025-2030 ($ million)
Chart on South Africa - Year-over-year growth 2025-2030 (%)
Data Table on South Africa - Year-over-year growth 2025-2030 (%)

12.6.4 Israel - Market size and forecast 2025-2030

Chart on Israel - Market size and forecast 2025-2030 ($ million)
Data Table on Israel - Market size and forecast 2025-2030 ($ million)
Chart on Israel - Year-over-year growth 2025-2030 (%)
Data Table on Israel - Year-over-year growth 2025-2030 (%)

12.6.5 Turkey - Market size and forecast 2025-2030

Chart on Turkey - Market size and forecast 2025-2030 ($ million)
Data Table on Turkey - Market size and forecast 2025-2030 ($ million)
Chart on Turkey - Year-over-year growth 2025-2030 (%)
Data Table on Turkey - Year-over-year growth 2025-2030 (%)

12.7 South America - Market size and forecast 2025-2030

Chart on South America - Market size and forecast 2025-2030 ($ million)
Data Table on South America - Market size and forecast 2025-2030 ($ million)
Chart on South America - Year-over-year growth 2025-2030 (%)
Data Table on South America - Year-over-year growth 2025-2030 (%)
Chart on Regional Comparison - South America
Data Table on Regional Comparison - South America

12.7.1 Brazil - Market size and forecast 2025-2030

Chart on Brazil - Market size and forecast 2025-2030 ($ million)
Data Table on Brazil - Market size and forecast 2025-2030 ($ million)
Chart on Brazil - Year-over-year growth 2025-2030 (%)
Data Table on Brazil - Year-over-year growth 2025-2030 (%)

12.7.2 Argentina - Market size and forecast 2025-2030

Chart on Argentina - Market size and forecast 2025-2030 ($ million)
Data Table on Argentina - Market size and forecast 2025-2030 ($ million)
Chart on Argentina - Year-over-year growth 2025-2030 (%)
Data Table on Argentina - Year-over-year growth 2025-2030 (%)

12.7.3 Chile - Market size and forecast 2025-2030

Chart on Chile - Market size and forecast 2025-2030 ($ million)
Data Table on Chile - Market size and forecast 2025-2030 ($ million)
Chart on Chile - Year-over-year growth 2025-2030 (%)
Data Table on Chile - Year-over-year growth 2025-2030 (%)

12.8 Market opportunity by geography

Market opportunity by geography ($ million)
Data Tables on Market opportunity by geography ($ million)

13. Drivers, Challenges, and Opportunity

13.1 Market drivers

Proliferation of IoT and shift toward edge computing
Pervasive integration of artificial intelligence and machine learning
Escalating automation and digitalization in industrial sectors

13.2 Market challenges

Pervasive supply chain volatility and geopolitical fragmentation
Escalating design complexity and critical security imperatives
Fundamental constraints of power consumption and thermal management

13.3 Impact of drivers and challenges

Impact of drivers and challenges in 2025 and 2030

13.4 Market opportunities

Ascendancy of heterogeneous computing architectures
Convergence of functional safety and hardware-based cybersecurity
Standardization and adoption of high-speed input/output interfaces

14. Competitive Landscape

14.1 Overview

14.2

Overview on criticality of inputs and factors of differentiation

14.3 Landscape disruption

Overview on factors of disruption

14.4 Industry risks

Impact of key risks on business

15. Competitive Analysis

15.1 Companies profiled

Companies covered

15.2 Company ranking index

15.3 Market positioning of companies

Matrix on companies position and classification

15.4 AAEON Technology Inc.

AAEON Technology Inc. - Overview
AAEON Technology Inc. - Business segments
AAEON Technology Inc. - Key offerings
AAEON Technology Inc. - Segment focus
SWOT

15.5 ADLINK Technology Inc.

ADLINK Technology Inc. - Overview
ADLINK Technology Inc. - Business segments
ADLINK Technology Inc. - Key offerings
ADLINK Technology Inc. - Segment focus
SWOT

15.6 Advantech Co. Ltd.

Advantech Co. Ltd. - Overview
Advantech Co. Ltd. - Business segments
Advantech Co. Ltd. - Key news
Advantech Co. Ltd. - Key offerings
Advantech Co. Ltd. - Segment focus
SWOT

15.7 American Portwell Technology

American Portwell Technology - Overview
American Portwell Technology - Product / Service
American Portwell Technology - Key offerings
SWOT

15.8 Axiomtek Co. Ltd.

Axiomtek Co. Ltd. - Overview
Axiomtek Co. Ltd. - Product / Service
Axiomtek Co. Ltd. - Key offerings
SWOT

15.9 congatec GmbH

congatec GmbH - Overview
congatec GmbH - Product / Service
congatec GmbH - Key offerings
SWOT

15.10 Curtiss Wright Corp.

Curtiss Wright Corp. - Overview
Curtiss Wright Corp. - Business segments
Curtiss Wright Corp. - Key offerings
Curtiss Wright Corp. - Segment focus
SWOT

15.11 DFI Inc.

DFI Inc. - Overview
DFI Inc. - Product / Service
DFI Inc. - Key offerings
SWOT

15.12 Digi International Inc.

Digi International Inc. - Overview
Digi International Inc. - Business segments
Digi International Inc. - Key news
Digi International Inc. - Key offerings
Digi International Inc. - Segment focus
SWOT

15.13 EUROTECH Spa

EUROTECH Spa - Overview
EUROTECH Spa - Business segments
EUROTECH Spa - Key offerings
EUROTECH Spa - Segment focus
SWOT

15.14 IEI Integration Corp.

IEI Integration Corp. - Overview
IEI Integration Corp. - Product / Service
IEI Integration Corp. - Key offerings
SWOT

15.15 Intel Corp.

Intel Corp. - Overview
Intel Corp. - Business segments
Intel Corp. - Key news
Intel Corp. - Key offerings
Intel Corp. - Segment focus
SWOT

15.16 Kontron AG

Kontron AG - Overview
Kontron AG - Business segments
Kontron AG - Key offerings
Kontron AG - Segment focus
SWOT

15.17 Lanner Electronics Inc.

Lanner Electronics Inc. - Overview
Lanner Electronics Inc. - Product / Service
Lanner Electronics Inc. - Key offerings
SWOT

15.18 NVIDIA Corp.

NVIDIA Corp. - Overview
NVIDIA Corp. - Business segments
NVIDIA Corp. - Key news
NVIDIA Corp. - Key offerings
NVIDIA Corp. - Segment focus
SWOT

16. Appendix

16.1 Scope of the report

Market definition
Objectives
Notes and caveats

16.2 Inclusions and exclusions checklist

Inclusions checklist
Exclusions checklist

16.3 Currency conversion rates for US$

16.4 Research methodology

16.5 Data procurement

Information sources

16.6 Data validation

16.7 Validation techniques employed for market sizing

16.8 Data synthesis

16.9 360 degree market analysis

16.10 List of abbreviations

Research Methodology

Technavio presents a detailed picture of the market by way of study, synthesis, and summation of data from multiple sources. The analysts have presented the various facets of the market with a particular focus on identifying the key industry influencers. The data thus presented is comprehensive, reliable, and the result of extensive research, both primary and secondary.

INFORMATION SOURCES

Primary sources

  • Manufacturers and suppliers
  • Channel partners
  • Industry experts
  • Strategic decision makers

Secondary sources

  • Industry journals and periodicals
  • Government data
  • Financial reports of key industry players
  • Historical data
  • Press releases

DATA ANALYSIS

Data Synthesis

  • Collation of data
  • Estimation of key figures
  • Analysis of derived insights

Data Validation

  • Triangulation with data models
  • Reference against proprietary databases
  • Corroboration with industry experts

REPORT WRITING

Qualitative

  • Market drivers
  • Market challenges
  • Market trends
  • Five forces analysis

Quantitative

  • Market size and forecast
  • Market segmentation
  • Geographical insights
  • Competitive landscape

Interested in this report?

Get your sample now to see our research methodology and insights!

Download Now

Frequently Asked Questions

Embedded Computer market growth will increase by USD 20335.0 million during 2026-2030.

The Embedded Computer market is expected to grow at a CAGR of 6.9% during 2026-2030.

Embedded Computer market is segmented by Product (COMs, SBCs, Stand-alone boards) End-user (Industrial automation, Military and defense, Medical, Communication, Others) Cpu architecture (x86, ARM, PowerPC, Others)

AAEON Technology Inc., ADLINK Technology Inc., Advantech Co. Ltd., American Portwell Technology, Axiomtek Co. Ltd., congatec GmbH, Curtiss Wright Corp., DFI Inc., Digi International Inc., EUROTECH Spa, IEI Integration Corp., Intel Corp., Kontron AG, Lanner Electronics Inc., NVIDIA Corp., Raspberry Pi, Toradex AG, VIA TECHNOLOGIES Inc. are a few of the key vendors in the Embedded Computer market.

Europe will register the highest growth rate of 35.4% among the other regions. Therefore, the Embedded Computer market in Europe is expected to garner significant business opportunities for the vendors during the forecast period.

Germany, UK, France, Italy, Spain, The Netherlands, China, Japan, India, South Korea, Australia, Indonesia, US, Canada, Mexico, Saudi Arabia, UAE, South Africa, Israel, Turkey, Brazil, Argentina, Chile

  • Proliferation of IoT and shift toward edge computing is the driving factor this market.

The Embedded Computer market vendors should focus on grabbing business opportunities from the Product segment as it accounted for the largest market share in the base year.
RIA - Research AI Assistant
Ask RIA