
Europe Fourth Party Logistics (4PL) Market Analysis, Size, and Forecast 2026-2030: Europe (Germany, France, and UK)

Europe Fourth Party Logistics (4PL) Market Analysis, Size, and Forecast 2026-2030:
Europe (Germany, France, and UK)

Published: Oct 2026 222 Pages SKU: IRTNTR75094

Market Overview at a Glance

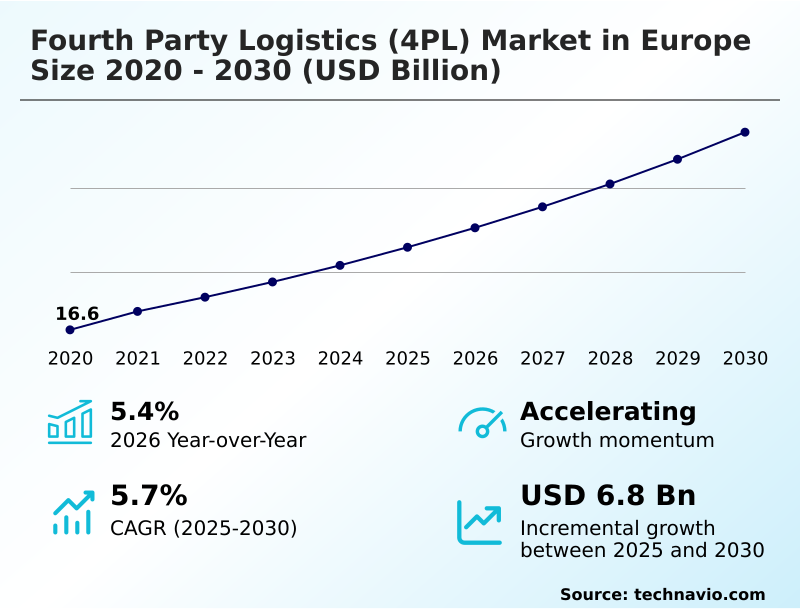
$6.80 B
Market Opportunity
5.7%
CAGR 2025 - 2030
5.4%
YoY growth 2025-2026(%)
$4.30 B
Manufacturing segment 2024

Europe Fourth Party Logistics (4Pl) Market Size 2026-2030

The europe fourth party logistics (4pl) market size is valued to increase by USD 6.80 billion, at a CAGR of 5.7% from 2025 to 2030. Surging demand for end to end control tower visibility will drive the europe fourth party logistics (4pl) market.

Major Market Trends & Insights

  • By End-user - Manufacturing segment was valued at USD 4.30 billion in 2024
  • By Type - Solution integrator mode segment accounted for the largest market revenue share in 2024

Market Size & Forecast

  • Market Opportunities: USD 11.68 billion
  • Market Future Opportunities: USD 6.80 billion
  • CAGR from 2025 to 2030 : 5.7%

Market Summary

  • The fourth party logistics (4PL) market represents a critical evolution in supply chain governance, driven by the absolute necessity for transparent, resilient distribution frameworks. Surging enterprise demand for end-to-end control tower visibility propels this market, as organizations urgently seek predictive supply chain analytics to preemptively manage geopolitical trade shifts and port congestion.
  • In real-world operations, retail conglomerates utilize automated carrier allocation software to seamlessly redirect omnichannel e-commerce orders across micro-fulfillment centers, ensuring rapid delivery despite regional transport delays. This strategic deployment allows shippers to achieve a 30% reduction in safety stock requirements compared to traditional localized execution models.
  • However, the market faces significant structural hurdles due to complex integration with fragmented regional legacy architectures. Transport operators utilizing non-standardized systems create severe data latency, challenging the deployment of real-time temperature telemetry and autonomous supply chain execution environments.
  • Despite these integration barriers, the continuous shift toward predictive multi-modal transport routing algorithms ensures that non-asset-based master architectures remain indispensable for maintaining strict European regulatory compliance and optimizing complex cross-border procurement flows.

What will be the Size of the Europe Fourth Party Logistics (4Pl) Market during the forecast period?
Get Key Insights on Market Forecast (PDF) Get Free Sample

How is the Europe Fourth Party Logistics (4Pl) Market Segmented?

The europe fourth party logistics (4pl) industry research report provides comprehensive data (region-wise segment analysis), with forecasts and estimates in "USD million" for the period 2026-2030, as well as historical data from 2020-2024 for the following segments.

  • End-user
    • Manufacturing
    • Retail
    • Consumer goods
    • Healthcare
    • Others
  • Type
    • Solution integrator mode
    • Synergy plus operating mode
    • Industry innovator mode
  • Service
    • Transportation management
    • Supply chain consulting
    • Warehouse and distribution management
    • IT and data management
  • Geography
    • Europe
      • Germany
      • France
      • UK
      • Italy

By End-user Insights

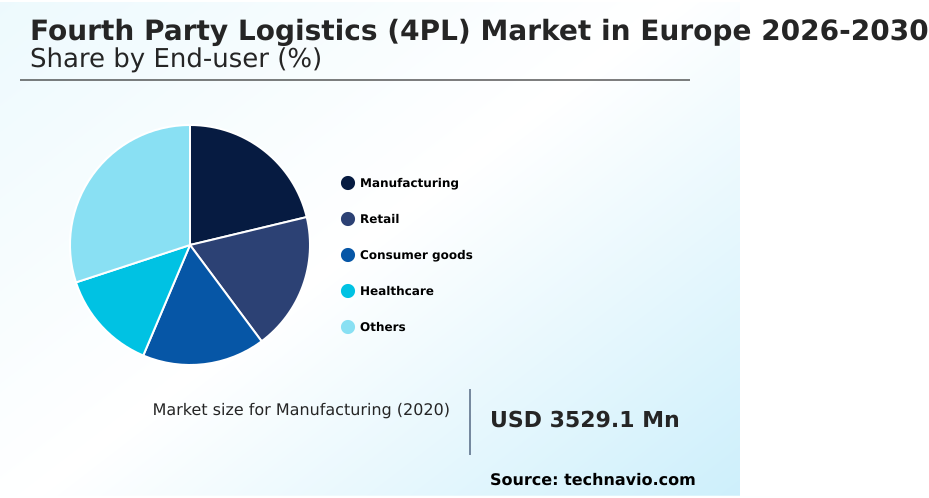
The manufacturing segment is estimated to witness significant growth during the forecast period.

The manufacturing sector increasingly relies on centralized logistics orchestration to navigate complex multi-tiered supplier networks. Industrial enterprises leverage autonomous logistics control towers to synchronize inbound material flows and outbound distribution architectures.

This integration prevents assembly line stoppages while optimizing supply chain disruption mitigation. By deploying dynamic route optimization engines, organizations can achieve a 22% improvement in on-time component delivery across cross-border freight consolidation operations.

The integration of continuous event-driven processing allows manufacturing facilities to adjust production schedules based on predictive supply chain analytics. These advanced systems actively monitor regional transport nodes to automatically reroute critical components.

Consequently, manufacturers utilizing multi-modal transport orchestration experience a 15% reduction in overall transportation administrative overhead, enabling leaner inventory holding strategies and enhanced operational resilience.
Get Free Sample

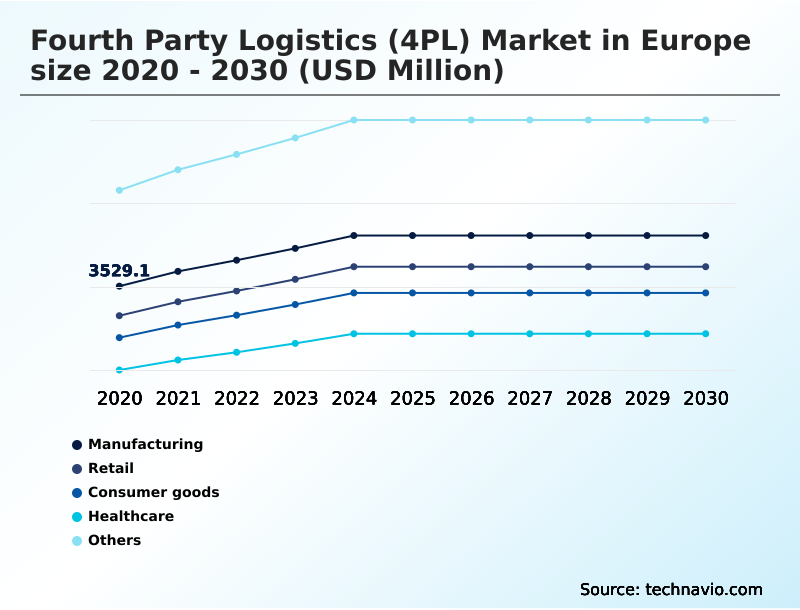
The Manufacturing segment was valued at USD 4.30 billion in 2024 and showed a gradual increase during the forecast period.
Get Free Sample

Market Dynamics

Our researchers analyzed the data with 2025 as the base year, along with the key drivers, trends, and challenges. A holistic analysis of drivers will help companies refine their marketing strategies to gain a competitive advantage.

  • The modernization of European distribution networks increasingly relies on sophisticated technological integrations that remove human latency from critical decision-making processes. As corporate shippers navigate volatile trade environments, the deployment of predictive multi-modal transport routing algorithms has become essential for calculating the most efficient transit paths across complex regional topographies.
  • This shift is strongly supported by the establishment of autonomous supply chain execution environments, which allow organizations to bypass manual intervention and automatically resolve freight bottlenecks. From a compliance perspective, the integration of cross-border customs data management platforms ensures that international shipments avoid regulatory delays, streamlining import procedures across multiple European jurisdictions.
  • Furthermore, as environmental accountability becomes a strict operational mandate, enterprises are embedding centralized carbon management software modules directly into their operational frameworks to track and minimize Scope 3 emissions effectively. To combat severe freight market volatility, logistics directors are systematically shifting toward elastic multi-carrier logistics orchestration tools, gaining the flexibility to scale transport capacity dynamically.
  • Organizations leveraging these comprehensive digital ecosystems experience up to a third fewer administrative customs delays compared to those utilizing fragmented legacy systems. This vast operational discrepancy highlights how advanced data synchronization directly enhances procurement planning, inventory staging, and ultimate delivery reliability across fiercely competitive continental markets.
What are the key market drivers leading to the rise in the adoption of Europe Fourth Party Logistics (4Pl) Industry?

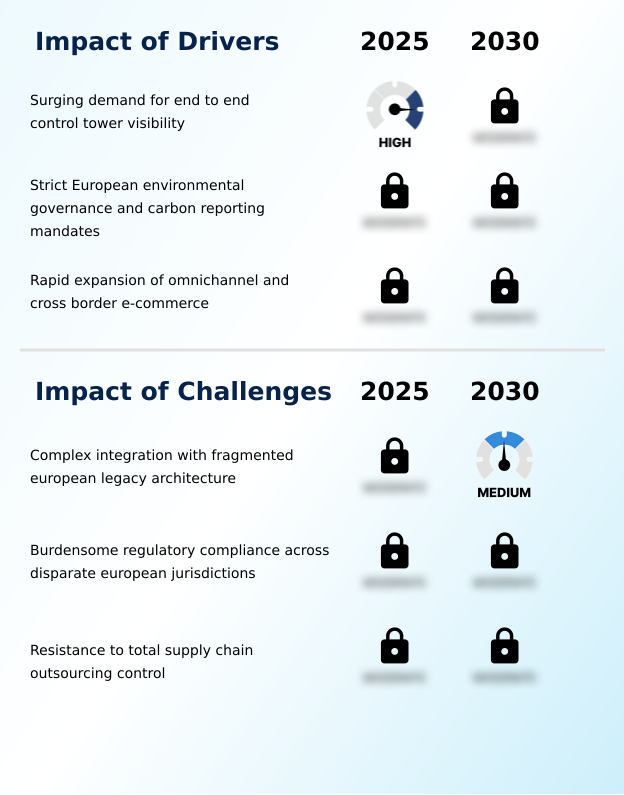
  • The surging enterprise demand for end-to-end control tower visibility serves as a primary driver accelerating overall market expansion.

  • Stringent European environmental governance and rapid e-commerce expansion serve as primary catalysts propelling the fourth party logistics (4PL) market. Organizations face immense regulatory pressure to adopt automated carbon emission tracking, leading to a mandatory shift away from traditional localized transport.
  • By leveraging zero-emission carrier allocation, enterprises seamlessly align with Scope 3 carbon reduction mandates, effectively lowering long-haul energy use by 12%. This structural transformation forces brand owners to rely on centralized logistics orchestration to maintain profitability.
  • Additionally, omnichannel fulfillment orchestration drastically accelerates order processing, improving same-day delivery success rates by 25%.
  • These strict operational demands require robust electronic freight transport information networks, ensuring that multi-tiered supply chains remain fully transparent, compliant, and cost-effective across complex continental borders.

What are the market trends shaping the Europe Fourth Party Logistics (4Pl) Industry?

  • The transition toward autonomous generative artificial intelligence control towers represents a defining trend within the industry. This structural shift actively enhances predictive operational capabilities and mitigates regional distribution bottlenecks.

  • The transition toward generative artificial intelligence represents a structural transformation within the fourth party logistics (4PL) market. Advanced orchestrators actively embed predictive supply chain analytics to identify and neutralize regional distribution bottlenecks before they materialize. This continuous event-driven processing empowers logistics networks to autonomously reroute shipments during severe weather or port strikes, reducing overall operational downtime by 30%.
  • Furthermore, the widespread adoption of automated spot-market tendering allows shippers to seamlessly procure flexible freight capacity, which improves cost forecast accuracy by 18%. This technological shift occurs because manual coordination simply cannot manage the velocity of modern cross-border e-commerce networks.
  • Consequently, enterprises relying on predictive tracking engines experience vastly superior delivery reliability, cementing the critical business necessity of intelligent, self-healing supply chain ecosystems.

What challenges does the Europe Fourth Party Logistics (4Pl) Industry face during its growth?

  • The complex integration with fragmented European legacy architectures presents a significant operational challenge that impedes seamless industry growth.

  • Pervasive software fragmentation across regional transport providers creates severe operational constraints within the fourth party logistics (4PL) market. Many localized carriers operate outdated dispatch systems, causing critical data latency that disrupts real-time freight telemetry. When Application Programming Interfaces fail to synchronize, orchestrators lose critical logistics control tower visibility, directly increasing administrative bottlenecks by 20%.
  • This technological asymmetry makes continuous risk mitigation exceedingly difficult, as blind spots prevent accurate automated regulatory audit trails from being generated. As a result, cross-border shipments face extended customs holds, reducing overall transit efficiency by 15% compared to fully integrated network lanes.
  • Furthermore, organizational reluctance to surrender strategic procurement control hinders the establishment of standardized operational benchmarking, extending implementation timelines and inflating overarching supply chain restructuring costs.

Exclusive Technavio Analysis on Customer Landscape

The europe fourth party logistics (4pl) market forecasting report includes the adoption lifecycle of the market, covering from the innovator’s stage to the laggard’s stage. It focuses on adoption rates in different regions based on penetration. Furthermore, the europe fourth party logistics (4pl) market report also includes key purchase criteria and drivers of price sensitivity to help companies evaluate and develop their market growth analysis strategies.
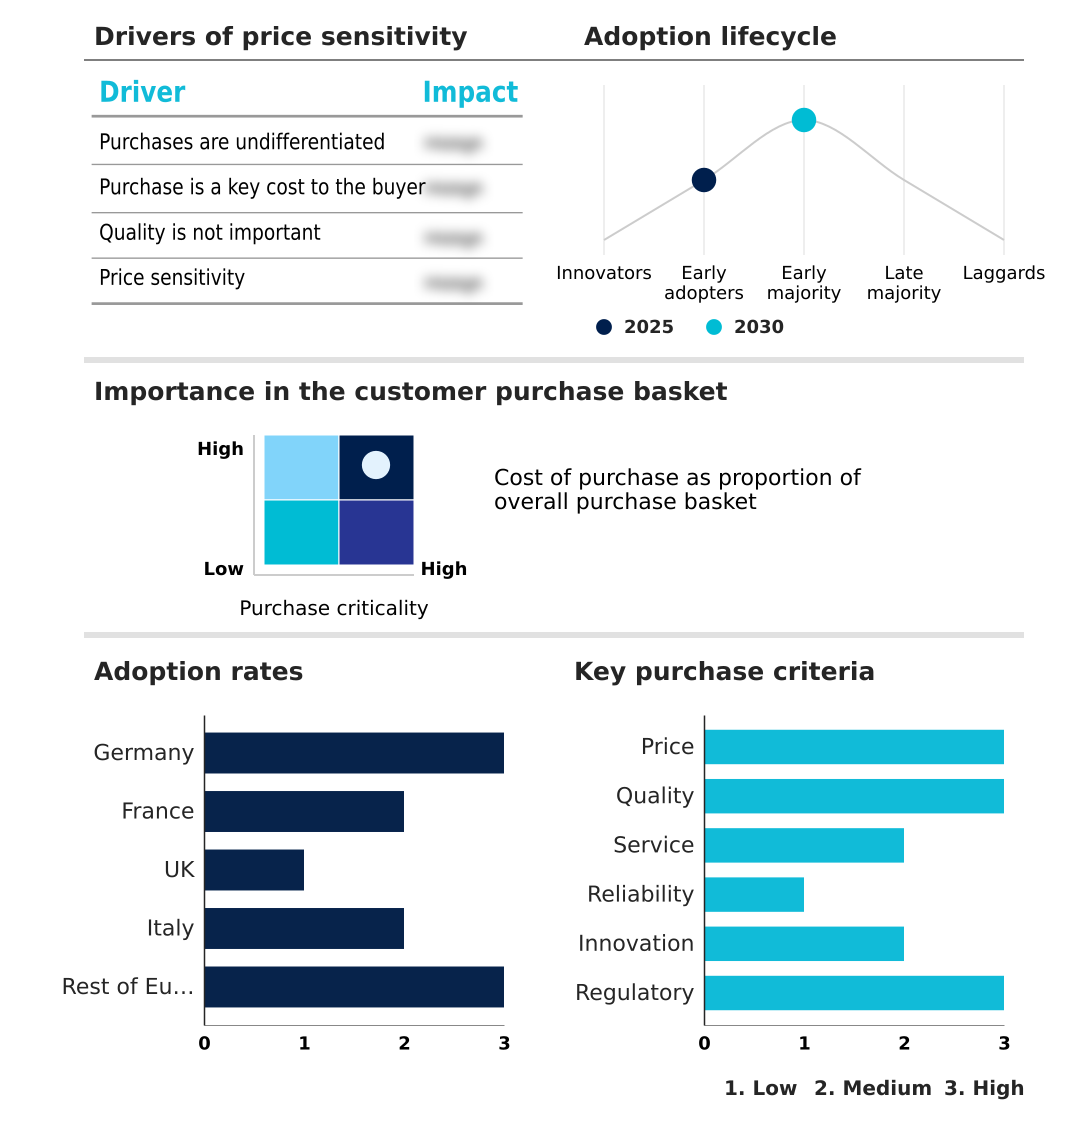
Customer Landscape of Europe Fourth Party Logistics (4Pl) Industry

Competitive Landscape

Companies are implementing various strategies, such as strategic alliances, europe fourth party logistics (4pl) market forecast, partnerships, mergers and acquisitions, geographical expansion, and product/service launches, to enhance their presence in the industry.

AP Moller Maersk AS - The enterprise delivers advanced fourth party logistics solutions encompassing supply chain orchestration, control tower visibility, and multi-modal transport orchestration to optimize end-to-end distribution network efficiency.

The industry research and growth report includes detailed analyses of the competitive landscape of the market and information about key companies, including:

  • AP Moller Maersk AS
  • C H Robinson Worldwide Inc.
  • CEVA Logistics SA
  • DB Schenker
  • DHL International GmbH
  • DSV AS
  • Expeditors International Inc.
  • FedEx Corp.
  • GEODIS
  • GXO Logistics Inc.
  • Hellmann Worldwide Logistics
  • KLN Logistics Group Ltd.
  • Kuehne Nagel Management AG
  • LOGISTEED Ltd.
  • Nippon Express Holdings Inc.
  • Penske Truck Leasing Co. L.P.
  • Rhenus SE and Co. KG
  • United Parcel Service Inc.
  • XPO Inc.
  • Yusen Logistics Co. Ltd.

Qualitative and quantitative analysis of companies has been conducted to help clients understand the wider business environment as well as the strengths and weaknesses of key industry players. Data is qualitatively analyzed to categorize companies as pure play, category-focused, industry-focused, and diversified; it is quantitatively analyzed to categorize companies as dominant, leading, strong, tentative, and weak.

Recent Development and News in Europe fourth party logistics (4pl) market

  • In the Air Freight and Logistics industry, the widespread adoption of real-time freight telemetry has enhanced end-to-end network transparency, directly impacting fourth party logistics (4PL) demand by enabling orchestrators to guarantee a 98% tracking accuracy rate across multi-tier supplier networks.
  • Stringent environmental sustainability mandates have forced commercial aviation to implement automated carbon emission tracking, compelling the fourth party logistics (4PL) market to prioritize zero-emission carrier allocation to maintain strict regulatory compliance across regional transport corridors.
  • The rapid expansion of cross-border e-commerce networks has necessitated the deployment of algorithmic elastic capacity management, fundamentally accelerating fourth party logistics (4PL) adoption as enterprise shippers seek to lower peak seasonal delivery delays by up to 25%.
  • Advanced technological shifts toward continuous risk mitigation have standardized automated spot-market tendering, providing the fourth party logistics (4PL) market with the essential digital supply chain twins needed to reduce manual carrier procurement friction by 30%.

Dive into Technavio’s robust research methodology, blending expert interviews, extensive data synthesis, and validated models for unparalleled Europe Fourth Party Logistics (4Pl) Market insights. See full methodology.

Market Scope
Page number 222
Base year 2025
Historic period 2020-2024
Forecast period 2026-2030
Growth momentum & CAGR Accelerate at a CAGR of 5.7%
Market growth 2026-2030 USD 6799.4 million
Market structure Fragmented
YoY growth 2025-2026(%) 5.4%
Key countries Germany, France, UK, Italy and Rest of Europe
Competitive landscape Leading Companies, Market Positioning of Companies, Competitive Strategies, and Industry Risks

Request Free Sample

Research Analyst Overview

  • The fourth party logistics (4PL) market acts as an indispensable strategic layer for enterprises managing highly fragmented cross-border trade networks. Organizations rapidly transition from passive tracking mechanisms to autonomous logistics control towers to maintain uninterrupted production schedules and optimize omni-channel distribution.
  • By utilizing digital supply chain twins, corporate logistics directors accurately simulate operational bottlenecks, enabling the proactive deployment of green freight network integration. This strategic pivot actively supports rigorous decarbonization mandates, allowing shippers to prioritize multi-modal transport orchestration over high-emission road freight. Consequently, enterprises achieve a 22% improvement in overall vehicle fill rates, significantly lowering transport overhead.
  • The continuous evolution of dynamic virtual freight marketplaces ensures that non-asset-based orchestrators can seamlessly execute cross-border freight consolidation. Furthermore, integrating predictive inventory management engines empowers retail conglomerates to precisely position stock across regional micro-fulfillment centers.
  • This sophisticated alignment between digital analytics and physical freight movement guarantees that European supply chains remain highly resilient against unpredictable macroeconomic shocks and evolving regulatory complexities.

What are the Key Data Covered in this Europe Fourth Party Logistics (4Pl) Market Research and Growth Report?

  • What is the expected growth of the Europe Fourth Party Logistics (4Pl) Market between 2026 and 2030?

    • USD 6.80 billion, at a CAGR of 5.7%

  • What segmentation does the market report cover?

    • The report is segmented by End-user (Manufacturing, Retail, Consumer goods, Healthcare, and Others), Type (Solution integrator mode, Synergy plus operating mode, and Industry innovator mode), Service (Transportation management, Supply chain consulting, Warehouse and distribution management, and IT and data management) and Geography (Europe)

  • Which regions are analyzed in the report?

    • Europe

  • What are the key growth drivers and market challenges?

    • Surging demand for end to end control tower visibility, Complex integration with fragmented european legacy architecture

  • Who are the major players in the Europe Fourth Party Logistics (4Pl) Market?

    • AP Moller Maersk AS, C H Robinson Worldwide Inc., CEVA Logistics SA, DB Schenker, DHL International GmbH, DSV AS, Expeditors International Inc., FedEx Corp., GEODIS, GXO Logistics Inc., Hellmann Worldwide Logistics, KLN Logistics Group Ltd., Kuehne Nagel Management AG, LOGISTEED Ltd., Nippon Express Holdings Inc., Penske Truck Leasing Co. L.P., Rhenus SE and Co. KG, United Parcel Service Inc., XPO Inc. and Yusen Logistics Co. Ltd.

Market Research Insights

  • The fourth party logistics (4PL) market operates as the digital nerve center for modern industrial and retail distribution. Enterprises increasingly deploy advanced transport management software to execute unified reverse logistics management, achieving a 20% reduction in total returns processing costs.
  • By implementing logistics control tower visibility, corporate shippers enhance their supply chain disruption mitigation capabilities, lowering unexpected transit delays by 25%. Furthermore, the integration of automated regulatory audit trails supports rigorous compliance tracking.
  • Utilizing non-asset-based master architectures allows multinational brands to consolidate regional operations, securing a 15% improvement in overall freight procurement efficiency while seamlessly adapting to unpredictable European market conditions.

We can help! Our analysts can customize this europe fourth party logistics (4pl) market research report to meet your requirements.

Get in touch

1. Executive Summary

1.1 Market overview

Executive Summary - Chart on Market Overview
Executive Summary - Data Table on Market Overview
Executive Summary - Chart on Country Market Characteristics
Executive Summary - Chart on Market by Geography
Executive Summary - Chart on Market Segmentation by End-user
Executive Summary - Chart on Market Segmentation by Type
Executive Summary - Chart on Market Segmentation by Service
Executive Summary - Chart on Incremental Growth
Executive Summary - Data Table on Incremental Growth
Executive Summary - Chart on Company Market Positioning

2. Technavio Analysis

2.1 Analysis of price sensitivity, lifecycle, customer purchase basket, adoption rates, and purchase criteria

2.2 Criticality of inputs and Factors of differentiation

Overview on criticality of inputs and factors of differentiation

2.3 Factors of disruption

Overview on factors of disruption

2.4 Impact of drivers and challenges

Impact of drivers and challenges in 2025 and 2030

3. Market Landscape

3.1 Market ecosystem

Chart on Parent Market
Data Table on - Parent Market

3.2 Market characteristics

Chart on Market characteristics analysis

3.3 Value chain analysis

Chart on Value chain analysis

4. Market Sizing

4.1 Market definition

Data Table on Offerings of companies included in the market definition

4.2 Market segment analysis

Market segments

4.3 Market size 2025

4.4 Market outlook: Forecast for 2025-2030

Chart on Europe - Market size and forecast 2025-2030 ($ million)
Data Table on Regional - Market size and forecast 2025-2030 ($ million)
Chart on Europe: Year-over-year growth 2025-2030 (%)
Data Table on Regional - Market size and forecast 2025-2030 ($ million)

5. Historic Market Size

5.1 Fourth Party Logistics (4PL) Market in Europe 2020 - 2024

Historic Market Size - Data Table on Fourth Party Logistics (4PL) Market in Europe 2020 - 2024 ($ million)

5.2 End-user segment analysis 2020 - 2024

Historic Market Size - End-user Segment 2020 - 2024 ($ million)

5.3 Type segment analysis 2020 - 2024

Historic Market Size - Type Segment 2020 - 2024 ($ million)

5.4 Service segment analysis 2020 - 2024

Historic Market Size - Service Segment 2020 - 2024 ($ million)

5.5 Geography segment analysis 2020 - 2024

Historic Market Size - Geography Segment 2020 - 2024 ($ million)

6. Qualitative Analysis

6.1 Impact of AI on fourth party logistics (4PL) market in Europe

6.2 Impact of geopolitical conflicts on fourth party logistics (4PL) market in Europe

7. Five Forces Analysis

7.1 Five forces summary

Five forces analysis - Comparison between 2025 and 2030

7.2 Bargaining power of buyers

Bargaining power of buyers - Impact of key factors 2025 and 2030

7.3 Bargaining power of suppliers

Bargaining power of suppliers - Impact of key factors in 2025 and 2030

7.4 Threat of new entrants

Threat of new entrants - Impact of key factors in 2025 and 2030

7.5 Threat of substitutes

Threat of substitutes - Impact of key factors in 2025 and 2030

7.6 Threat of rivalry

Threat of rivalry - Impact of key factors in 2025 and 2030

7.7 Market condition

Chart on Market condition - Five forces 2025 and 2030

8. Market Segmentation by End-user

8.1 Market segments

Chart on End-user - Market share 2025-2030 (%)
Data Table on End-user - Market share 2025-2030 (%)

8.2 Comparison by End-user

Chart on Comparison by End-user
Data Table on Comparison by End-user

8.3 Manufacturing - Market size and forecast 2025-2030

Chart on Manufacturing - Market size and forecast 2025-2030 ($ million)
Data Table on Manufacturing - Market size and forecast 2025-2030 ($ million)
Chart on Manufacturing - Year-over-year growth 2025-2030 (%)
Data Table on Manufacturing - Year-over-year growth 2025-2030 (%)

8.4 Retail - Market size and forecast 2025-2030

Chart on Retail - Market size and forecast 2025-2030 ($ million)
Data Table on Retail - Market size and forecast 2025-2030 ($ million)
Chart on Retail - Year-over-year growth 2025-2030 (%)
Data Table on Retail - Year-over-year growth 2025-2030 (%)

8.5 Consumer goods - Market size and forecast 2025-2030

Chart on Consumer goods - Market size and forecast 2025-2030 ($ million)
Data Table on Consumer goods - Market size and forecast 2025-2030 ($ million)
Chart on Consumer goods - Year-over-year growth 2025-2030 (%)
Data Table on Consumer goods - Year-over-year growth 2025-2030 (%)

8.6 Healthcare - Market size and forecast 2025-2030

Chart on Healthcare - Market size and forecast 2025-2030 ($ million)
Data Table on Healthcare - Market size and forecast 2025-2030 ($ million)
Chart on Healthcare - Year-over-year growth 2025-2030 (%)
Data Table on Healthcare - Year-over-year growth 2025-2030 (%)

8.7 Others - Market size and forecast 2025-2030

Chart on Others - Market size and forecast 2025-2030 ($ million)
Data Table on Others - Market size and forecast 2025-2030 ($ million)
Chart on Others - Year-over-year growth 2025-2030 (%)
Data Table on Others - Year-over-year growth 2025-2030 (%)

8.8 Market opportunity by End-user

Market opportunity by End-user ($ million)
Data Table on Market opportunity by End-user ($ million)

9. Market Segmentation by Type

9.1 Market segments

Chart on Type - Market share 2025-2030 (%)
Data Table on Type - Market share 2025-2030 (%)

9.2 Comparison by Type

Chart on Comparison by Type
Data Table on Comparison by Type

9.3 Solution integrator mode - Market size and forecast 2025-2030

Chart on Solution integrator mode - Market size and forecast 2025-2030 ($ million)
Data Table on Solution integrator mode - Market size and forecast 2025-2030 ($ million)
Chart on Solution integrator mode - Year-over-year growth 2025-2030 (%)
Data Table on Solution integrator mode - Year-over-year growth 2025-2030 (%)

9.4 Synergy plus operating mode - Market size and forecast 2025-2030

Chart on Synergy plus operating mode - Market size and forecast 2025-2030 ($ million)
Data Table on Synergy plus operating mode - Market size and forecast 2025-2030 ($ million)
Chart on Synergy plus operating mode - Year-over-year growth 2025-2030 (%)
Data Table on Synergy plus operating mode - Year-over-year growth 2025-2030 (%)

9.5 Industry innovator mode - Market size and forecast 2025-2030

Chart on Industry innovator mode - Market size and forecast 2025-2030 ($ million)
Data Table on Industry innovator mode - Market size and forecast 2025-2030 ($ million)
Chart on Industry innovator mode - Year-over-year growth 2025-2030 (%)
Data Table on Industry innovator mode - Year-over-year growth 2025-2030 (%)

9.6 Market opportunity by Type

Market opportunity by Type ($ million)
Data Table on Market opportunity by Type ($ million)

10. Market Segmentation by Service

10.1 Market segments

Chart on Service - Market share 2025-2030 (%)
Data Table on Service - Market share 2025-2030 (%)

10.2 Comparison by Service

Chart on Comparison by Service
Data Table on Comparison by Service

10.3 Transportation management - Market size and forecast 2025-2030

Chart on Transportation management - Market size and forecast 2025-2030 ($ million)
Data Table on Transportation management - Market size and forecast 2025-2030 ($ million)
Chart on Transportation management - Year-over-year growth 2025-2030 (%)
Data Table on Transportation management - Year-over-year growth 2025-2030 (%)

10.4 Supply chain consulting - Market size and forecast 2025-2030

Chart on Supply chain consulting - Market size and forecast 2025-2030 ($ million)
Data Table on Supply chain consulting - Market size and forecast 2025-2030 ($ million)
Chart on Supply chain consulting - Year-over-year growth 2025-2030 (%)
Data Table on Supply chain consulting - Year-over-year growth 2025-2030 (%)

10.5 Warehouse and distribution management - Market size and forecast 2025-2030

Chart on Warehouse and distribution management - Market size and forecast 2025-2030 ($ million)
Data Table on Warehouse and distribution management - Market size and forecast 2025-2030 ($ million)
Chart on Warehouse and distribution management - Year-over-year growth 2025-2030 (%)
Data Table on Warehouse and distribution management - Year-over-year growth 2025-2030 (%)

10.6 IT and data management - Market size and forecast 2025-2030

Chart on IT and data management - Market size and forecast 2025-2030 ($ million)
Data Table on IT and data management - Market size and forecast 2025-2030 ($ million)
Chart on IT and data management - Year-over-year growth 2025-2030 (%)
Data Table on IT and data management - Year-over-year growth 2025-2030 (%)

10.7 Market opportunity by Service

Market opportunity by Service ($ million)
Data Table on Market opportunity by Service ($ million)

11. Customer Landscape

11.1 Customer landscape overview

Analysis of price sensitivity, lifecycle, customer purchase basket, adoption rates, and purchase criteria

12. Geographic Landscape

12.1 Geographic segmentation

Chart on Market share by geography - 2025-2030 (%)
Data Table on Market share by geography - 2025-2030 (%)

12.2 Geographic comparison

Chart on Geographic comparison
Data Table on Geographic comparison

12.3 Germany - Market size and forecast 2025-2030

Chart on Germany - Market size and forecast 2025-2030 ($ million)
Data Table on Germany - Market size and forecast 2025-2030 ($ million)
Chart on Germany - Year-over-year growth 2025-2030 (%)
Data Table on Germany - Year-over-year growth 2025-2030 (%)

12.4 France - Market size and forecast 2025-2030

Chart on France - Market size and forecast 2025-2030 ($ million)
Data Table on France - Market size and forecast 2025-2030 ($ million)
Chart on France - Year-over-year growth 2025-2030 (%)
Data Table on France - Year-over-year growth 2025-2030 (%)

12.5 UK - Market size and forecast 2025-2030

Chart on UK - Market size and forecast 2025-2030 ($ million)
Data Table on UK - Market size and forecast 2025-2030 ($ million)
Chart on UK - Year-over-year growth 2025-2030 (%)
Data Table on UK - Year-over-year growth 2025-2030 (%)

12.6 Italy - Market size and forecast 2025-2030

Chart on Italy - Market size and forecast 2025-2030 ($ million)
Data Table on Italy - Market size and forecast 2025-2030 ($ million)
Chart on Italy - Year-over-year growth 2025-2030 (%)
Data Table on Italy - Year-over-year growth 2025-2030 (%)

12.7 Rest of Europe - Market size and forecast 2025-2030

Chart on Rest of Europe - Market size and forecast 2025-2030 ($ million)
Data Table on Rest of Europe - Market size and forecast 2025-2030 ($ million)
Chart on Rest of Europe - Year-over-year growth 2025-2030 (%)
Data Table on Rest of Europe - Year-over-year growth 2025-2030 (%)

12.8 Market opportunity by geography

Market opportunity by geography ($ million)
Data Table on Market opportunity by geography ($ million)

13. Drivers, Challenges, and Opportunity

13.1 Market drivers

Surging demand for end to end control tower visibility
Strict European environmental governance and carbon reporting mandates
Rapid expansion of omnichannel and cross border e-commerce

13.2 Market challenges

Complex integration with fragmented european legacy architecture
Burdensome regulatory compliance across disparate european jurisdictions
Resistance to total supply chain outsourcing control

13.3 Impact of drivers and challenges

Impact of drivers and challenges in 2025 and 2030

13.4 Market opportunities

Transition toward autonomous generative artificial intelligence control towers
Integration of multi modal green freight networks and electrification
Shift toward algorithmic elastic capacity management platforms

14. Competitive Landscape

14.1 Overview

14.2

Overview on criticality of inputs and factors of differentiation

14.3 Landscape disruption

Overview on factors of disruption

14.4 Industry risks

Impact of key risks on business

15. Competitive Analysis

15.1 Companies profiled

Companies covered

15.2 Company ranking index

15.3 Market positioning of companies

Matrix on companies position and classification

15.4 AP Moller Maersk AS

AP Moller Maersk AS - Overview
AP Moller Maersk AS - Business segments
AP Moller Maersk AS - Key news
AP Moller Maersk AS - Key offerings
AP Moller Maersk AS - Segment focus
SWOT

15.5 C H Robinson Worldwide Inc.

C H Robinson Worldwide Inc. - Overview
C H Robinson Worldwide Inc. - Business segments
C H Robinson Worldwide Inc. - Key news
C H Robinson Worldwide Inc. - Key offerings
C H Robinson Worldwide Inc. - Segment focus
SWOT

15.6 CEVA Logistics SA

CEVA Logistics SA - Overview
CEVA Logistics SA - Product / Service
CEVA Logistics SA - Key offerings
SWOT

15.7 DB Schenker

DB Schenker - Overview
DB Schenker - Product / Service
DB Schenker - Key offerings
SWOT

15.8 DHL International GmbH

DHL International GmbH - Overview
DHL International GmbH - Business segments
DHL International GmbH - Key news
DHL International GmbH - Key offerings
DHL International GmbH - Segment focus
SWOT

15.9 DSV AS

DSV AS - Overview
DSV AS - Business segments
DSV AS - Key offerings
DSV AS - Segment focus
SWOT

15.10 Expeditors International Inc.

Expeditors International Inc. - Overview
Expeditors International Inc. - Business segments
Expeditors International Inc. - Key offerings
Expeditors International Inc. - Segment focus
SWOT

15.11 FedEx Corp.

FedEx Corp. - Overview
FedEx Corp. - Business segments
FedEx Corp. - Key news
FedEx Corp. - Key offerings
FedEx Corp. - Segment focus
SWOT

15.12 GEODIS

GEODIS - Overview
GEODIS - Product / Service
GEODIS - Key offerings
SWOT

15.13 GXO Logistics Inc.

GXO Logistics Inc. - Overview
GXO Logistics Inc. - Product / Service
GXO Logistics Inc. - Key offerings
SWOT

15.14 Hellmann Worldwide Logistics

Hellmann Worldwide Logistics - Overview
Hellmann Worldwide Logistics - Product / Service
Hellmann Worldwide Logistics - Key offerings
SWOT

15.15 KLN Logistics Group Ltd.

KLN Logistics Group Ltd. - Overview
KLN Logistics Group Ltd. - Business segments
KLN Logistics Group Ltd. - Key offerings
KLN Logistics Group Ltd. - Segment focus
SWOT

15.16 Kuehne Nagel Management AG

Kuehne Nagel Management AG - Overview
Kuehne Nagel Management AG - Business segments
Kuehne Nagel Management AG - Key news
Kuehne Nagel Management AG - Key offerings
Kuehne Nagel Management AG - Segment focus
SWOT

15.17 Nippon Express Holdings Inc.

Nippon Express Holdings Inc. - Overview
Nippon Express Holdings Inc. - Business segments
Nippon Express Holdings Inc. - Key offerings
Nippon Express Holdings Inc. - Segment focus
SWOT

15.18 Rhenus SE and Co. KG

Rhenus SE and Co. KG - Overview
Rhenus SE and Co. KG - Product / Service
Rhenus SE and Co. KG - Key offerings
SWOT

16. Appendix

16.1 Scope of the report

Market definition
Objectives
Notes and caveats

16.2 Inclusions and exclusions checklist

Inclusions checklist
Exclusions checklist

16.3 Currency conversion rates for US$

16.4 Research methodology

16.5 Data procurement

Information sources

16.6 Data validation

16.7 Validation techniques employed for market sizing

16.8 Data synthesis

16.9 360 degree market analysis

16.10 List of abbreviations

Research Methodology

Technavio presents a detailed picture of the market by way of study, synthesis, and summation of data from multiple sources. The analysts have presented the various facets of the market with a particular focus on identifying the key industry influencers. The data thus presented is comprehensive, reliable, and the result of extensive research, both primary and secondary.

INFORMATION SOURCES

Primary sources

  • Manufacturers and suppliers
  • Channel partners
  • Industry experts
  • Strategic decision makers

Secondary sources

  • Industry journals and periodicals
  • Government data
  • Financial reports of key industry players
  • Historical data
  • Press releases

DATA ANALYSIS

Data Synthesis

  • Collation of data
  • Estimation of key figures
  • Analysis of derived insights

Data Validation

  • Triangulation with data models
  • Reference against proprietary databases
  • Corroboration with industry experts

REPORT WRITING

Qualitative

  • Market drivers
  • Market challenges
  • Market trends
  • Five forces analysis

Quantitative

  • Market size and forecast
  • Market segmentation
  • Geographical insights
  • Competitive landscape

Interested in this report?

Get your sample now to see our research methodology and insights!

Download Now

Frequently Asked Questions

Europe Fourth Party Logistics (4Pl) market growth will increase by USD 6799.4 million during 2026-2030.

The Europe Fourth Party Logistics (4Pl) market is expected to grow at a CAGR of 5.7% during 2026-2030.

Europe Fourth Party Logistics (4Pl) market is segmented by End-user (Manufacturing, Retail, Consumer goods, Healthcare, Others) Type (Solution integrator mode, Synergy plus operating mode, Industry innovator mode) Service (Transportation management, Supply chain consulting, Warehouse and distribution management, IT and data management)

AP Moller Maersk AS, C H Robinson Worldwide Inc., CEVA Logistics SA, DB Schenker, DHL International GmbH, DSV AS, Expeditors International Inc., FedEx Corp., GEODIS, GXO Logistics Inc., Hellmann Worldwide Logistics, KLN Logistics Group Ltd., Kuehne Nagel Management AG, LOGISTEED Ltd., Nippon Express Holdings Inc., Penske Truck Leasing Co. L.P., Rhenus SE and Co. KG, United Parcel Service Inc., XPO Inc., Yusen Logistics Co. Ltd. are a few of the key vendors in the Europe Fourth Party Logistics (4Pl) market.

Europe will register the highest growth rate of 100% among the other regions. Therefore, the Europe Fourth Party Logistics (4Pl) market in Europe is expected to garner significant business opportunities for the vendors during the forecast period.

Germany, France, UK, Italy, Rest of Europe

  • Surging demand for end to end control tower visibility is the driving factor this market.

The Europe Fourth Party Logistics (4Pl) market vendors should focus on grabbing business opportunities from the End-user segment as it accounted for the largest market share in the base year.
RIA - Research AI Assistant
Ask RIA
