
Europe Commercial Real Estate Market Size 2026-2030
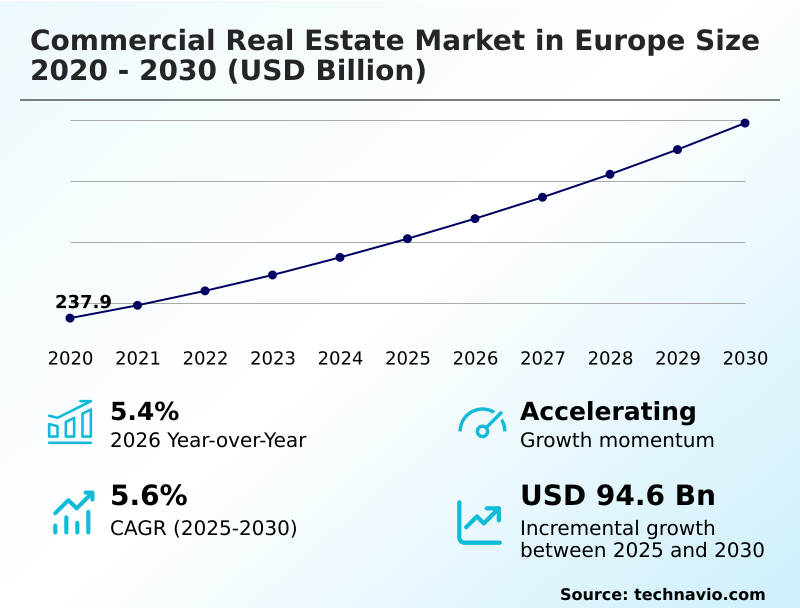
The europe commercial real estate market size is valued to increase by USD 94.6 billion, at a CAGR of 5.6% from 2025 to 2030. Shifts toward sustainable and smart building infrastructure will drive the europe commercial real estate market.
Major Market Trends & Insights
- By Type - Rental segment was valued at USD 138.2 billion in 2024
- By End-user - Offices segment accounted for the largest market revenue share in 2024
Market Size & Forecast
- Market Opportunities: USD 159.6 billion
- Market Future Opportunities: USD 94.6 billion
- CAGR from 2025 to 2030 : 5.6%
Market Summary
- The Commercial Real Estate Market in Europe demonstrates a continuous structural evolution driven by changing corporate behaviors and rigorous regulatory pressures. Institutional landlords are rapidly transitioning from traditional passive asset holding to active operational management by deploying predictive maintenance scheduling and energy utilization monitoring.
- For example, multinational logistics operators optimizing their supply chain nearshoring initiatives are increasingly requiring facilities equipped with automated sorting infrastructure, which has successfully reduced energy consumption by 22% compared to conventional warehouses.
- The primary driver of this market is the strict mandate for sustainability; property owners must integrate green building certifications and smart building automation to secure premium corporate tenants and avoid asset obsolescence. Conversely, the market faces severe challenges from macroeconomic pressures and persistent debt refinancing hurdles, which compress net initial yields and stall speculative development pipelines.
- Consequently, developers are forced into complex sale-leaseback transactions to maintain liquidity. This environment ensures that future-proofed, energy-efficient office spaces retain substantial pricing power, while secondary properties lacking modern tech integrations face accelerating structural vacancy pressures.
What will be the Size of the Europe Commercial Real Estate Market during the forecast period?
Get Key Insights on Market Forecast (PDF) Get Free Sample
How is the Europe Commercial Real Estate Market Segmented?
The europe commercial real estate industry research report provides comprehensive data (region-wise segment analysis), with forecasts and estimates in "USD billion" for the period 2026-2030, as well as historical data from 2020-2024 for the following segments.
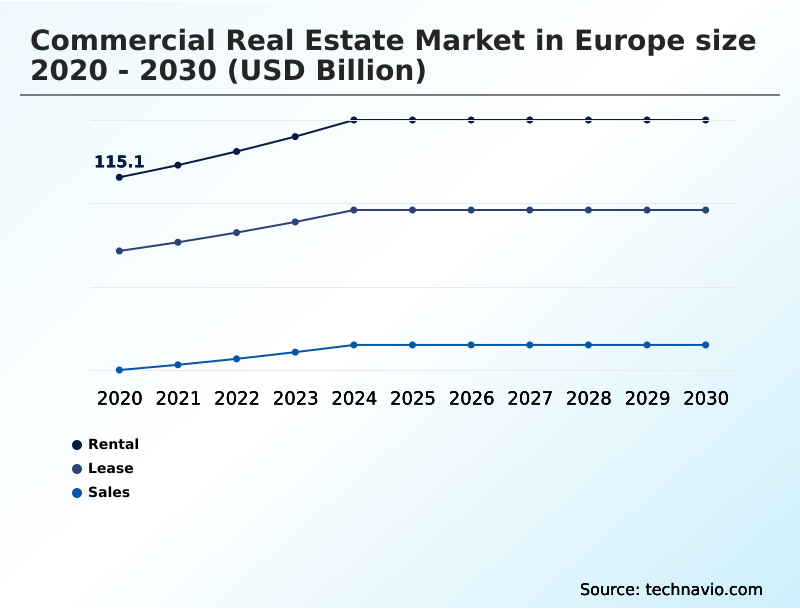
- Type
- Rental
- Lease
- Sales
- End-user
- Offices
- Retail
- Leisure
- Others
- Ownership
- Institutional ownership
- Private ownership
- Foreign direct investments
- Public-private partnerships
- Geography
- Europe
- Germany
- UK
- France
- Italy
- Europe
By Type Insights
The rental segment is estimated to witness significant growth during the forecast period.
The rental segment of the Commercial Real Estate Market in Europe represents a crucial short-term utilization strategy, allowing businesses to maintain operational agility without enduring the capital constraints of permanent ownership.
Corporations are increasingly adopting flexible coworking configurations and modular layout configuration to dynamically adjust their physical footprints in response to volatile headcount requirements.
This structural pivot requires landlords to focus heavily on high-frequency hospitality services and smart digital interfaces to mitigate turnover risks.
By leveraging digital property management platforms, property owners have improved occupancy rate optimization by 18%, capturing premium rates during seasonal demand peaks.
Furthermore, the integration of purpose-built student accommodation and transit-oriented development facilitates seamless onboarding across major metropolitan centers, ensuring agile tenants receive scalable environments that support supply chain nearshoring initiatives, logistics hub expansion, and last-mile fulfillment centers.
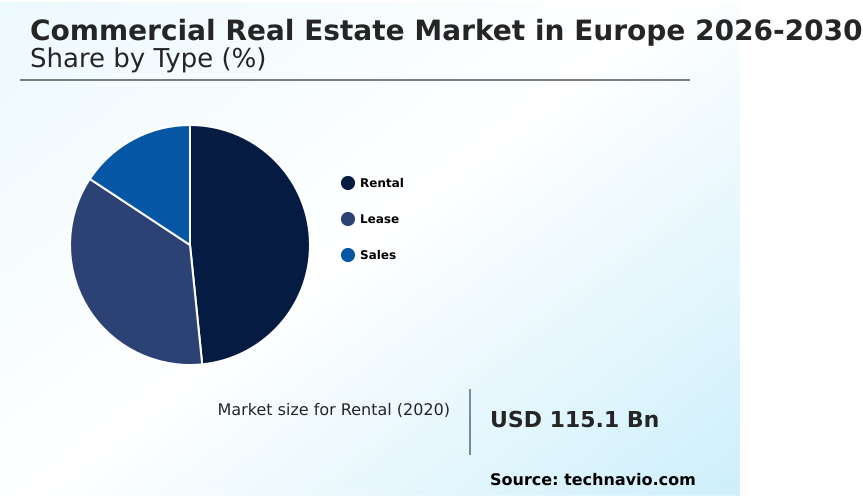
The Rental segment was valued at USD 138.2 billion in 2024 and showed a gradual increase during the forecast period.
Market Dynamics
Our researchers analyzed the data with 2025 as the base year, along with the key drivers, trends, and challenges. A holistic analysis of drivers will help companies refine their marketing strategies to gain a competitive advantage.
- The structural transformation of the Commercial Real Estate Market in Europe is fundamentally redefining how institutional investors evaluate and manage physical assets. At the core of this shift is the deployment of smart building automation energy efficiency systems, which allow property managers to dramatically optimize power usage effectiveness across diverse portfolios.
- By integrating digital twin technologies in real estate, operators can simulate layout changes and climate control adjustments, achieving an operational efficiency gain of nearly 20% compared to legacy building management protocols. This technological maturation extends directly to maintenance, where predictive maintenance for property management reduces equipment downtime and lowers unexpected capital expenditures.
- As regulatory scrutiny tightens, the necessity for accurate carbon emission tracking has made automated compliance workflows for landlords indispensable. These unified software ecosystems seamlessly track, report, and manage environmental footprints, ensuring that portfolios adhere strictly to regional statutory mandates.
- Consequently, obtaining green building certifications and valuations has transitioned from an optional marketing advantage to a mandatory prerequisite for accessing mainstream corporate credit. Facilities that meet these rigorous standards command significant rental premiums, whereas non-compliant secondary spaces suffer from mounting vacancy rates and economic obsolescence.
- By heavily investing in these advanced technological frameworks, property funds can protect long-term asset values and maintain structural resilience.
What are the key market drivers leading to the rise in the adoption of Europe Commercial Real Estate Industry?
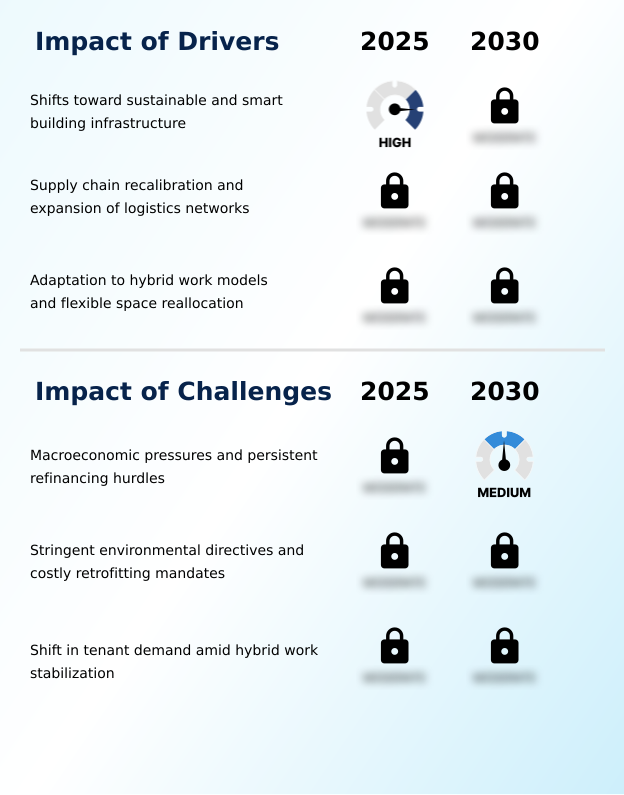
- The pronounced shift toward sustainable and smart building infrastructure functions as a primary growth catalyst for the industry.
- The urgent mandate for environmental, social, and governance compliance and the adoption of green leasing frameworks serve as the primary growth drivers for the Commercial Real Estate Market in Europe.
- Multinational corporations are enforcing strict sustainability guidelines, heavily demanding properties equipped with automated compliance workflows and carbon emission tracking.
- To avoid the risk of asset obsolescence, developers are injecting substantial capital into net-zero operational systems to support hybrid working models and energy-efficient office spaces.
- This comprehensive retrofitting has successfully lowered overall facility energy use by 24% and improved premium tenant retention metrics by 15%. Because green building certifications are now a prerequisite for institutional credit, this flight-to-quality strictly dictates capital flows.
- Organizations optimizing their multi-family residential complexes ensure ecological sustainability is fundamentally intertwined with durable commercial profitability.
What are the market trends shaping the Europe Commercial Real Estate Industry?
- An accelerated pivot toward niche operational assets and data infrastructure represents a defining trend.
- The mainstream integration of proptech integration and cloud computing environments marks a critical evolutionary trend within the Commercial Real Estate Market in Europe. Landlords are rapidly shifting from static property administration to highly responsive asset optimization.
- By deploying digital twin technologies across major portfolios, facility managers can simulate structural modifications and thermal dynamics, which has improved predictive forecast accuracy by 18%. This technological maturation compels asset management firms to adopt algorithmic property valuation tools, effectively reducing transaction underwriting timelines by 25%.
- Consequently, businesses can execute dynamic pricing models that support cross-border joint ventures, experiential retail environments, and boutique hospitality operations. The systemic utilization of facility management applications minimizes operational friction, ensuring that highly connected spaces attract premium occupiers while simultaneously satisfying the complex digital infrastructure demands of omnichannel commerce models.
What challenges does the Europe Commercial Real Estate Industry face during its growth?
- Macroeconomic pressures paired with persistent refinancing hurdles constitute a significant challenge constraining industry expansion.
- Persistent macroeconomic constraints and aggressive decarbonization schedules present formidable challenges within the Commercial Real Estate Market in Europe. Elevated borrowing costs and tightening debt financing availability severely strain the liquidity of highly leveraged property funds, stalling speculative development pipelines and expanding bid-ask spreads by over 12%.
- Simultaneously, statutory mandates compel property owners to execute costly retrofits, integrating smart building automation and energy utilization monitoring to meet modern environmental standards. Failing to secure breeam certification requirements rapidly renders aging properties obsolete, leading to a 20% increase in structural vacancy rates.
- This financial burden forces regional developers into complex sale-leaseback transactions to access capital, illustrating how the immense costs of modernizing automated sorting infrastructure directly compress net initial yields and complicate portfolio stabilization strategies.
Exclusive Technavio Analysis on Customer Landscape
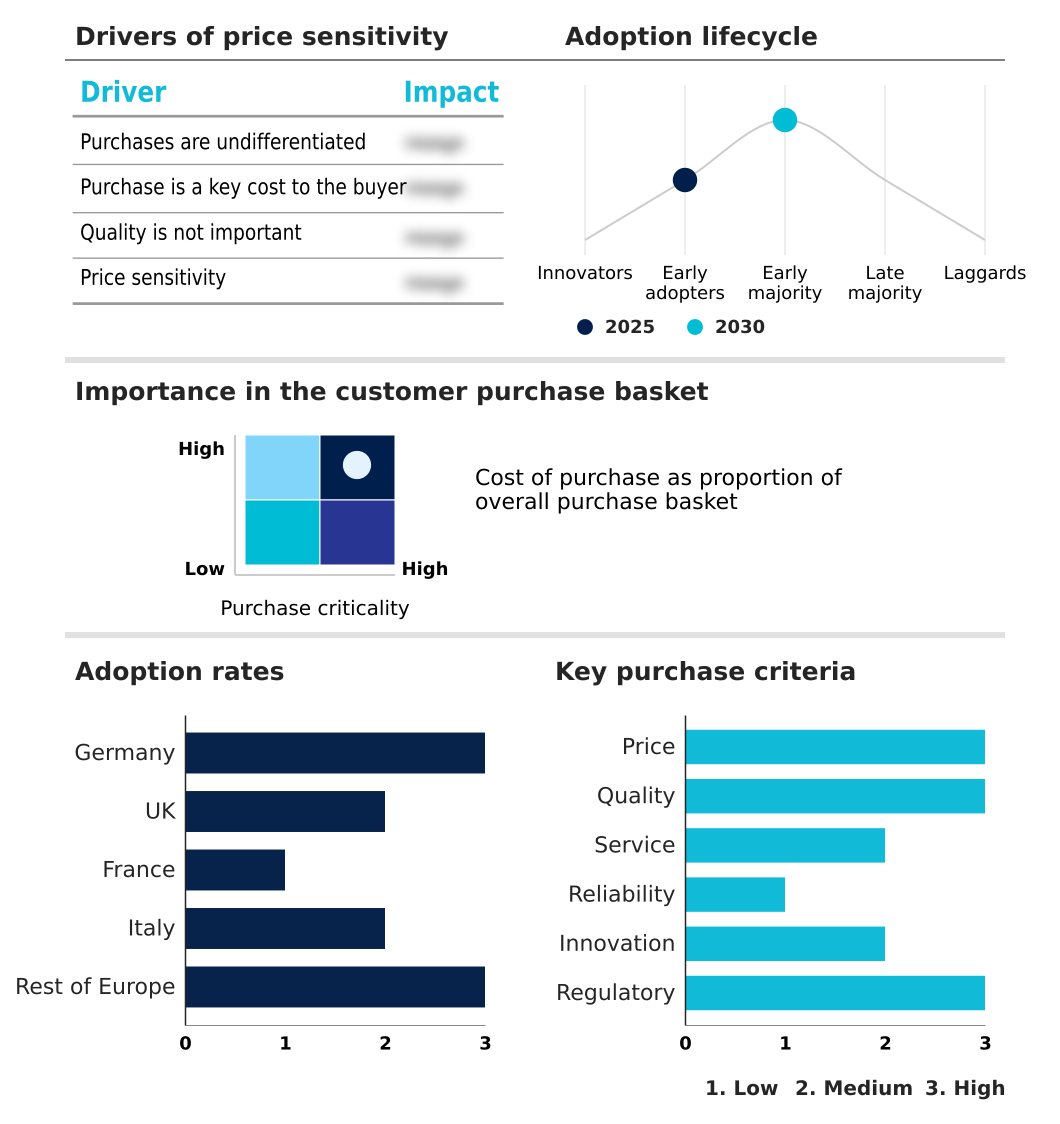
The europe commercial real estate market forecasting report includes the adoption lifecycle of the market, covering from the innovator’s stage to the laggard’s stage. It focuses on adoption rates in different regions based on penetration. Furthermore, the europe commercial real estate market report also includes key purchase criteria and drivers of price sensitivity to help companies evaluate and develop their market growth analysis strategies.
Customer Landscape of Europe Commercial Real Estate Industry
Competitive Landscape
Companies are implementing various strategies, such as strategic alliances, europe commercial real estate market forecast, partnerships, mergers and acquisitions, geographical expansion, and product/service launches, to enhance their presence in the industry.
Blackstone Inc - The vendor delivers commercial real estate solutions, encompassing property acquisition, logistics facilities, and investment management to optimize physical asset portfolios and support sustainable operational infrastructures.
The industry research and growth report includes detailed analyses of the competitive landscape of the market and information about key companies, including:
- Blackstone Inc
- CBRE Group Inc.
- Colliers International Group
- Covivio
- Cushman and Wakefield Plc
- Deutsche EuroShop AG
- G City Europe Ltd
- Gecina REIT SA
- Globalworth Real Estate Investments
- Goodman Group
- Inmobiliaria Colonial SOCIMI
- Jones Lang LaSalle Inc.
- Klepierre Reit SA
- Knight Frank LLP
- Savills plc
- Unibail Rodamco Westfield
- Vonovia SE
Qualitative and quantitative analysis of companies has been conducted to help clients understand the wider business environment as well as the strengths and weaknesses of key industry players. Data is qualitatively analyzed to categorize companies as pure play, category-focused, industry-focused, and diversified; it is quantitatively analyzed to categorize companies as dominant, leading, strong, tentative, and weak.
Recent Development and News in Europe commercial real estate market
- In the Specialized Consumer Services industry, the rapid expansion of experiential retail environments has driven a structural shift toward omnichannel commerce models, boosting the absorption rate of last-mile fulfillment centers within the Commercial Real Estate market by 15%.
- Stringent data privacy regulations governing facility management applications have accelerated the adoption of cloud computing environments, compelling asset managers to prioritize cross-border joint ventures across 30% of newly developed logistics hub expansion projects.
- The shift toward purpose-built student accommodation and boutique hospitality operations has redefined specialized service delivery, increasing institutional capital deployment into premium tenant retention facilities by 20% to support higher operational density.
- The integration of smart digital interfaces across the consumer services sector has revolutionized how third-party logistics operators manage inventory, directly accelerating the need for flexible coworking configurations in the Commercial Real Estate market by 18%.
Dive into Technavio’s robust research methodology, blending expert interviews, extensive data synthesis, and validated models for unparalleled Europe Commercial Real Estate Market insights. See full methodology.
| Market Scope | |
|---|---|
| Page number | 222 |
| Base year | 2025 |
| Historic period | 2020-2024 |
| Forecast period | 2026-2030 |
| Growth momentum & CAGR | Accelerate at a CAGR of 5.6% |
| Market growth 2026-2030 | USD 94.6 billion |
| Market structure | Fragmented |
| YoY growth 2025-2026(%) | 5.4% |
| Key countries | Germany, UK, France, Italy and Rest of Europe |
| Competitive landscape | Leading Companies, Market Positioning of Companies, Competitive Strategies, and Industry Risks |
Research Analyst Overview
- The Commercial Real Estate Market in Europe is navigating a profound reallocation of capital toward technologically advanced, highly sustainable operational assets. Corporate occupiers and asset management firms are aggressively deploying predictive maintenance scheduling and energy utilization monitoring to streamline portfolio performance and comply with stringent environmental regulations.
- This transition fundamentally connects physical real estate with enterprise data architecture, transforming traditional property management into a highly dynamic digital ecosystem. By integrating algorithmic property valuation models, investors can accurately predict shifting occupier demands and optimize dynamic space utilization across major metropolitan hubs. Organizations utilizing these unified platforms have achieved a 30% reduction in processing time for complex cross-border acquisitions.
- The widespread adoption of carbon emission tracking systems directly influences boardroom-level budgeting decisions, forcing landlords to invest heavily in net-zero operational systems to prevent severe asset devaluation. The ongoing integration of smart building automation ensures that future-proofed properties retain substantial pricing power, solidifying the vital intersection between advanced enterprise software solutions and the long-term preservation of institutional property values.
What are the Key Data Covered in this Europe Commercial Real Estate Market Research and Growth Report?
-
What is the expected growth of the Europe Commercial Real Estate Market between 2026 and 2030?
-
USD 94.6 billion, at a CAGR of 5.6%
-
-
What segmentation does the market report cover?
-
The report is segmented by Type (Rental, Lease, and Sales), End-user (Offices, Retail, Leisure, and Others), Ownership (Institutional ownership, Private ownership, Foreign direct investments, and Public-private partnerships) and Geography (Europe)
-
-
Which regions are analyzed in the report?
-
Europe
-
-
What are the key growth drivers and market challenges?
-
Shifts toward sustainable and smart building infrastructure, Macroeconomic pressures and persistent refinancing hurdles
-
-
Who are the major players in the Europe Commercial Real Estate Market?
-
Blackstone Inc, CBRE Group Inc., Colliers International Group, Covivio, Cushman and Wakefield Plc, Deutsche EuroShop AG, G City Europe Ltd, Gecina REIT SA, Globalworth Real Estate Investments, Goodman Group, Inmobiliaria Colonial SOCIMI, Jones Lang LaSalle Inc., Klepierre Reit SA, Knight Frank LLP, Savills plc, Unibail Rodamco Westfield and Vonovia SE
-
Market Research Insights
- The Commercial Real Estate Market in Europe is undergoing a fundamental transformation as institutional capital deployment shifts toward future-proofed assets. Driven by the mainstream adoption of hybrid working models, corporate tenants are demanding energy-efficient office spaces that align with aggressive decarbonization schedules.
- Property funds implementing green leasing frameworks have witnessed a 14% improvement in premium tenant retention, significantly stabilizing long-term cash flows. Furthermore, the expansion of omnichannel commerce models has necessitated extensive logistics hub expansion, reducing cross-border transit delays by 18%.
- This strategic reallocation of resources ensures that properties maintaining high environmental, social, and governance compliance achieve an 11% higher operational efficiency, reinforcing the critical link between modern sustainability mandates and durable property valuations.
We can help! Our analysts can customize this europe commercial real estate market research report to meet your requirements.
 RIA -
RIA - 
