Expanded Polystyrene (EPS) For Packaging Market Size 2025-2029
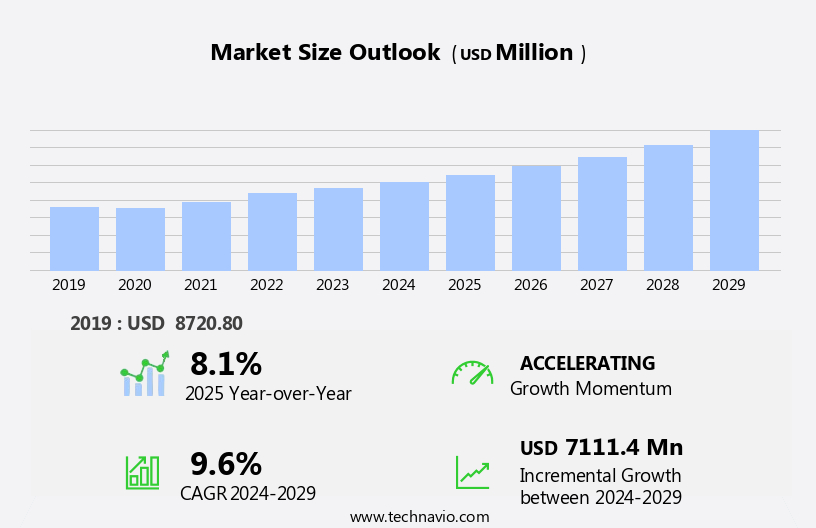
The expanded polystyrene (EPS) for packaging market size is forecast to increase by USD 7.11 billion, at a CAGR of 9.6% between 2024 and 2029.
- The market is driven by the increasing focus on environmental sustainability, with EPS offering significant benefits in this regard. EPS is known for its excellent insulation properties, making it an ideal choice for protecting temperature-sensitive goods during transportation. Moreover, its lightweight nature reduces the carbon footprint of transportation, contributing to its appeal. A key trend in the market is the growth of the food delivery and takeaway industry, which has witnessed a rise due to the convenience it offers in today's fast-paced world. EPS packaging is extensively used in this sector due to its excellent insulation properties, ensuring food remains at the desired temperature during transit. The environmental benefits of EPS are increasingly recognized, with its excellent insulation properties reducing the need for excessive energy consumption in refrigeration and transportation
- Additionally, the popularity of bioplastic packaging is on the rise as consumers increasingly demand eco-friendly alternatives. However, challenges persist in the form of stringent regulations regarding the disposal of EPS waste, which can be detrimental to the environment. In the food service industry, EPS is utilized for insulation of hot and cold food containers, ensuring food safety and preserving temperature. Addressing these concerns through sustainable disposal methods and exploring biodegradable alternatives will be crucial for market participants seeking to capitalize on the opportunities presented by this market while mitigating potential challenges effectively.
What will be the Size of the Expanded Polystyrene (EPS) For Packaging Market during the forecast period?
Explore in-depth regional segment analysis with market size data - historical 2019-2023 and forecasts 2025-2029 - in the full report.
Request Free Sample
- Expanded polystyrene (EPS) cushioning materials continue to be a significant player in the packaging industry, offering superior shock absorption and protection for various products. While bubble wrap and corrugated cardboard remain popular alternatives, EPS's lightweight and customizable nature make it an attractive choice for businesses seeking packaging efficiency. Polypropylene (PP) and protective films, along with polyethylene (PE), are other materials that cater to specific packaging requirements. The Packaging Efficiency Index (PEI) is a crucial metric in assessing the environmental impact of various packaging solutions, including EPS, oxygen absorbers, and shock absorbing inserts. Compliance with packaging regulations is essential, with EPS being subject to stringent guidelines for its use in various industries.
- PVC, anti-static packaging, and protective partitions are other materials that cater to specific applications, such as humidity control and ESD protection. The packaging circular economy is a growing trend, with EPS manufacturers focusing on packaging volume reduction and carbon footprint reduction through optimization and weight reduction techniques. Air cushioning and void fill are essential components of this approach, providing effective protection while minimizing material usage. EPS's versatility extends to its use as protective covers for sensitive products, offering an additional layer of protection during transportation and storage. Overall, the EPS market is dynamic, with ongoing research and development efforts aimed at enhancing its sustainability and performance.
How is this Expanded Polystyrene (EPS) For Packaging Industry segmented?
The expanded polystyrene (EPS) for packaging industry research report provides comprehensive data (region-wise segment analysis), with forecasts and estimates in "USD million" for the period 2025-2029, as well as historical data from 2019-2023 for the following segments.
- Application
- Electronic appliances
- Food and beverage
- Healthcare
- Others
- Type
- White
- Grey
- Packaging
- Rigid packaging
- Flexible packaging
- Product Type
- Molded foam
- Sheets
- Blocks
- Beads and loose fill
- Custom shapes
- Geography
- North America
- US
- Canada
- Europe
- France
- Germany
- UK
- APAC
- China
- India
- Japan
- South Korea
- South America
- Brazil
- Rest of World (ROW)
- North America
By Application Insights
The electronic appliances segment is estimated to witness significant growth during the forecast period. In the realm of electronic appliances, expanded polystyrene (EPS) plays a pivotal role as a protective packaging solution. EPS is utilized extensively for various appliances such as blenders, washing machines, air conditioners, personal computers, scanners, and television screens. The electronics sector, particularly dominated by refrigerators, television screens, and air conditioners, experiences significant growth due to increasing global temperatures and consumer demand. Consequently, numerous enterprises introduce new products to cater to this expanding market. For instance, Voltas launched 24 new adjustable AC models in India during March 2023. This burgeoning industry trend signifies the increasing demand for lightweight, efficient, and effective packaging solutions.
EPS, with its superior shock absorption, moisture barrier, and insulation properties, is poised to meet these requirements. Additionally, the e-commerce sector's escalating popularity necessitates robust packaging solutions for safe transportation and delivery. Packaging innovations, such as recyclable, biodegradable, and smart packaging, are gaining traction to reduce environmental impact and enhance consumer convenience. The packaging industry responds by offering advanced technologies, including packaging design software, automation, and testing equipment. The integration of packaging regulations, labeling, branding, and supply chain management further streamlines the manufacturing process. Overall, the electronic appliances industry's growth and the evolving packaging trends create a dynamic market for EPS and other protective packaging solutions.
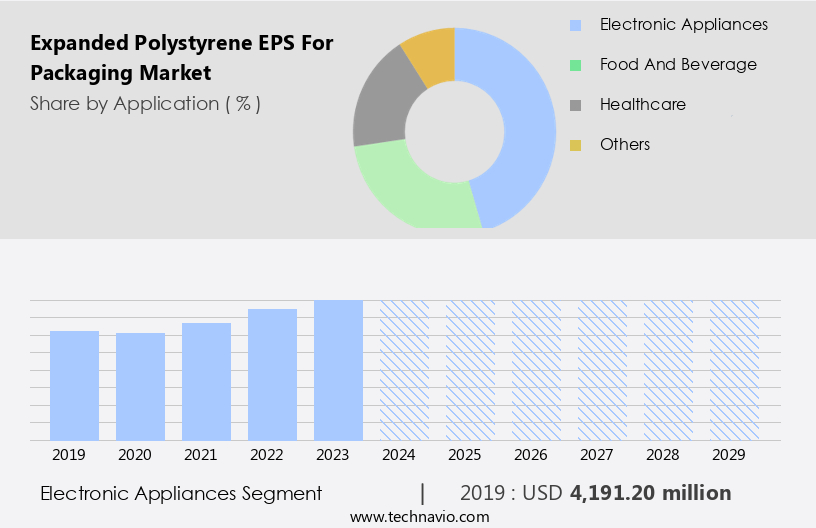
The Electronic appliances segment was valued at USD 4.19 billion in 2019 and showed a gradual increase during the forecast period.
The Expanded Polystyrene (EPS) Packaging Market is growing as industries prioritize durability and efficiency. Foam packaging is widely used in eCommerce packaging and consumer goods packaging, ensuring product protection. The demand for custom packaging solutions is rising, enabling packaging cost optimization and seamless packaging logistics. Rigorous testing methods, including drop test, vibration test, and compression test, enhance packaging performance. Focus on packaging sustainability drives packaging lifecycle analysis and packaging waste reduction efforts. Smart technologies such as RFID packaging and barcode packaging streamline tracking. Companies invest in packaging branding, packaging marketing, and packaging recycling to strengthen eco-friendly strategies. Innovations in packaging equipment and packaging machinery optimize production. Packaging consulting and packaging analysis further refine market strategies, fueling growth.
Regional Analysis
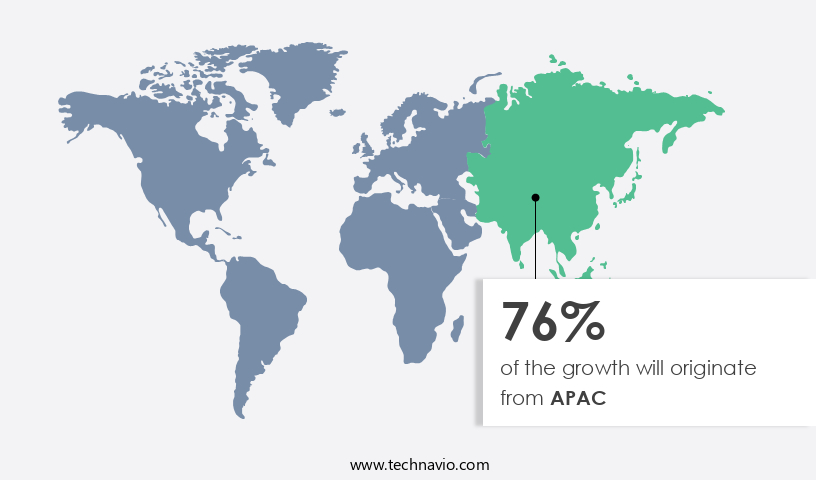
APAC is estimated to contribute 76% to the growth of the global market during the forecast period. Technavio's analysts have elaborately explained the regional trends and drivers that shape the market during the forecast period.
The market is experiencing significant growth, driven by the increasing demand for protective packaging solutions in various industries. E-commerce and industrial sectors are major contributors to this trend, with the former witnessing a rise due to the expanding consumer base and the latter due to the rise in manufacturing activities. EPS offers several advantages, including excellent shock absorption, moisture barrier, and insulation properties, making it an ideal choice for protecting sensitive goods during transportation and storage. Packaging innovation continues to be a key focus area, with companies investing in advanced technologies such as extrusion molding and injection molding to produce customized and efficient packaging solutions.
Recyclable packaging is also gaining popularity, with EPS recycling becoming increasingly important to reduce waste and promote sustainability. Regulations regarding packaging labeling and branding are strict, ensuring that all packaging meets the required standards for safety and performance. Food packaging is another significant application area for EPS, with its excellent insulation properties making it ideal for preserving temperature-sensitive products. Pharmaceutical packaging also utilizes EPS due to its impact resistance and ability to protect delicate products during transportation. EPS is also used in thermal insulation for electronics packaging and in protective packaging for industrial equipment. Packaging efficiency and analysis are crucial in the supply chain, with companies investing in software and automation to optimize costs and reduce waste.
The market for EPS packaging is diverse, with applications ranging from protective packaging for consumer goods to industrial packaging for heavy machinery. The future of EPS packaging lies in smart packaging solutions, which offer real-time monitoring and tracking capabilities, enhancing product protection and supply chain efficiency. The market is witnessing robust growth due to its versatility, cost-effectiveness, and excellent protective properties. The market is driven by the expanding e-commerce and industrial sectors, with a focus on innovation, sustainability, and efficiency. EPS packaging offers several advantages, including shock absorption, moisture barrier, insulation, and impact resistance, making it an ideal choice for various applications.
The market is expected to continue growing, with a focus on customization, recycling, and smart packaging solutions.
Market Dynamics
Our researchers analyzed the data with 2024 as the base year, along with the key drivers, trends, and challenges. A holistic analysis of drivers will help companies refine their marketing strategies to gain a competitive advantage.
What are the Expanded Polystyrene (EPS) For Packaging market drivers leading to the rise in the adoption of Industry?
- The expansion of the polystyrene market is primarily driven by the environmental advantages this material offers. Expanded polystyrene (EPS) is a popular choice for packaging manufacturing due to its unique properties and environmental benefits. Unlike other packaging materials, EPS is non-biodegradable but is still considered environmentally friendly due to its ease of recycling and composition. The material consists of a large amount of air and a limited amount of plastic, making it lightweight and efficient for shock absorption. EPS packaging is more sustainable than plastic, wood, and cardboard. Its recyclability is a significant advantage, as it can be recycled using expanded polystyrene compactors and pelleting processes. The recycling process is relatively quick, and the material breaks down into simpler forms, minimizing the time it spends in the waste stream.
- Moreover, EPS packaging is reusable, reducing the need for constant production and disposal. This feature is particularly attractive to retail and food and beverage establishments, which often use large quantities of packaging. By encouraging customers to reuse EPS containers, these businesses can reduce their environmental footprint and save on packaging material sourcing costs. EPS is a preferred packaging material due to its recyclability, reusability, and efficient shock absorption properties. Its environmental benefits make it a more sustainable choice compared to plastic, wood, and cardboard. As packaging regulations continue to evolve, businesses that prioritize sustainability and efficiency in their packaging supply chain will increasingly turn to EPS as a solution.
What are the Expanded Polystyrene (EPS) For Packaging market trends shaping the Industry?
- The food delivery and takeaway industry is experiencing significant growth and is becoming a prominent market trend. This sector is expected to continue expanding due to its convenience and flexibility in meeting consumers' demands for quick and convenient meal options. The market is experiencing notable growth due to several factors. These include the increasing trend of urbanization, hectic lifestyles, and the widespread use of smartphones and m-commerce. The food delivery and takeaway industry, which is a significant end-user of EPS packaging, is estimated to grow at a Compound Annual Growth Rate (CAGR) of approximately 9% during the forecast period. This growth can be attributed to the convenience and ease of ordering food online through mobile applications and websites.
- Additionally, advancements in packaging technology include the integration of RFID tags, packaging software, and packaging automation. The sustainability trend is also influencing the packaging industry, with the increasing demand for biodegradable packaging alternatives. However, EPS packaging can be recycled and reused, making it an environmentally friendly choice. Overall, the EPS for packaging market is expected to continue its growth trajectory, driven by these market dynamics. Moreover, EPS packaging offers advantages such as excellent impact resistance, insulation properties, and customization options through packaging graphics. To ensure the performance and quality of EPS packaging, testing and certification are crucial.
How does Expanded Polystyrene (EPS) For Packaging market faces challenges during its growth?
- The increasing popularity of bioplastic packaging poses a significant challenge to the growth of the packaging industry, as this eco-friendly alternative gains traction in the market. Expanded Polystyrene (EPS) for packaging is a crucial solution for product protection, particularly in industries that require thermal insulation, such as electronics. However, the market is witnessing a shift towards sustainable packaging solutions due to increasing environmental concerns. Bioplastics, derived from renewable biomass sources, are gaining popularity as they offer a more eco-friendly alternative to traditional packaging materials. Several studies indicate that sustainable packaging is a priority for customers, driving the demand for packaging that meets stringent protective standards while reducing waste and optimizing costs. Smart packaging solutions are also becoming increasingly important in the packaging distribution chain, enabling real-time monitoring of product conditions and reducing the need for frequent drop tests.
- Governments and organizations are promoting the use of sustainable packaging through various initiatives, including funding for projects that utilize household food waste to create biodegradable plastic bags and cups. As a result, end-users are transitioning to bioplastics for their flexible packaging needs. The packaging industry is undergoing significant changes, with a focus on sustainability and cost optimization. EPS for packaging continues to play a vital role in product protection, but the market is evolving to meet the demands of eco-conscious consumers and regulatory requirements. Bioplastics offer a promising solution, providing sustainable alternatives while maintaining the necessary protective properties.
Exclusive Customer Landscape
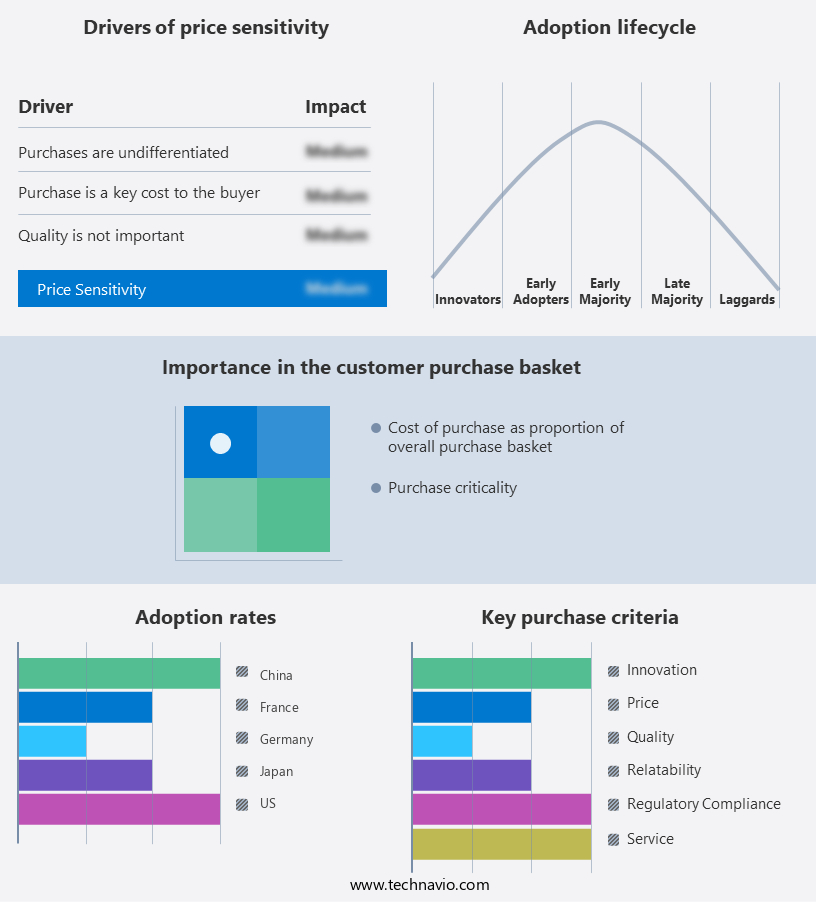
The expanded polystyrene (EPS) for packaging market forecasting report includes the adoption lifecycle of the market, covering from the innovator's stage to the laggard's stage. It focuses on adoption rates in different regions based on penetration. Furthermore, the expanded polystyrene (EPS) for packaging market report also includes key purchase criteria and drivers of price sensitivity to help companies evaluate and develop their market growth analysis strategies.
Customer Landscape
Key Companies & Market Insights
Companies are implementing various strategies, such as strategic alliances, expanded polystyrene (eps) for packaging market forecast, partnerships, mergers and acquisitions, geographical expansion, and product/service launches, to enhance their presence in the industry.
Alpek SAB de CV - The company specializes in expanded polystyrene (EPS) for packaging solutions and has launched Arcel, a premium expanded polystyrene brand known for its superior performance and durability.
The industry research and growth report includes detailed analyses of the competitive landscape of the market and information about key companies, including:
- Alpek SAB de CV
- Arkema
- Axion Recycling Ltd.
- BASF SE
- Chimei Corp.
- DuPont de Nemours Inc.
- Eni SpA
- Epsilyte LLC
- Formosa Chemicals and Fibre Corp.
- INEOS Group Holdings S.A.
- Kaneka Corp.
- LG Chem Ltd.
- NOVA Chemicals Corp.
- PS Japan Corp.
- Ravago
- Saudi Basic Industries Corp.
- Supreme Petrochem Ltd.
- TotalEnergies SE
- Trinseo PLC
- Videolar Innova SA
Qualitative and quantitative analysis of companies has been conducted to help clients understand the wider business environment as well as the strengths and weaknesses of key industry players. Data is qualitatively analyzed to categorize companies as pure play, category-focused, industry-focused, and diversified; it is quantitatively analyzed to categorize companies as dominant, leading, strong, tentative, and weak.
Recent Development and News in Expanded Polystyrene (EPS) For Packaging Market
- In February 2023, BASF, a leading global chemical producer, announced the expansion of its EPS (Expanded Polystyrene) foam production capacity at its site in Ludwigshafen, Germany. This expansion is expected to increase the company's annual production by 50,000 metric tons, strengthening its position in the European EPS market (BASF press release, 2023).
- In April 2024, DuPont and INEOS Styrolution, two major players in the polystyrene industry, announced a strategic collaboration to develop and commercialize innovative EPS products. This collaboration aims to combine DuPont's expertise in specialty materials and INEOS Styrolution's leadership in polystyrene production, creating new opportunities for the EPS market (DuPont press release, 2024).
- In July 2024, LyondellBasell, a leading chemical company, completed the acquisition of A. Schulman, a global supplier of specialty materials, including EPS. This acquisition is expected to enhance LyondellBasell's position in the packaging market and expand its product portfolio (LyondellBasell press release, 2024).
Research Analyst Overview
Expanded polystyrene (EPS) continues to be a dynamic force in the packaging market, with ongoing advancements and applications across various sectors. EPS offers exceptional product protection through its unique properties, including excellent shock absorption, thermal insulation, and moisture barrier. In the realm of protective packaging solutions, EPS plays a crucial role in ensuring the safe transportation of fragile and valuable goods. Adhering to stringent packaging standards, EPS is utilized in industries such as electronics, pharmaceuticals, and industrial manufacturing. Sustainability is a key focus in today's packaging landscape, and EPS is evolving to meet these demands. Efforts in EPS recycling and the development of biodegradable alternatives are underway, contributing to the reduction of packaging waste and the optimization of costs.
Packaging distribution and logistics are also influenced by EPS, with its lightweight and efficient nature making it an ideal choice for shipping and transportation. Smart packaging innovations, such as RFID technology and product tracking, are being integrated into EPS solutions to enhance supply chain visibility and streamline operations. The packaging industry is continually pushing the boundaries of technology and performance. EPS remains at the forefront, with ongoing advancements in packaging design, manufacturing, and testing, ensuring it remains a competitive and essential component in the evolving packaging landscape.
The Expanded Polystyrene (EPS) Packaging Market continues to advance, focusing on efficiency and sustainability. Compared to polyvinyl chloride (PVC), EPS offers lightweight durability, promoting packaging optimization and packaging weight reduction without compromising protection. Companies conduct rigorous environmental impact assessment to minimize ecological footprint, exploring recyclable alternatives and energy-efficient production processes. Strict packaging regulations compliance ensures adherence to industry standards, driving innovation in sustainable packaging solutions. Expanded Polystyrene (EPS), also known as expanded plastic foam or polystyrene beads, is a versatile plastic foam material widely used in various industries for packaging applications.
Dive into Technavio's strong research methodology, blending expert interviews, extensive data synthesis, and validated models for unparalleled Expanded Polystyrene (EPS) For Packaging Market insights. See full methodology.
|
Market Scope |
|
|
Report Coverage |
Details |
|
Page number |
249 |
|
Base year |
2024 |
|
Historic period |
2019-2023 |
|
Forecast period |
2025-2029 |
|
Growth momentum & CAGR |
Accelerate at a CAGR of 9.6% |
|
Market growth 2025-2029 |
USD 7.11 billion |
|
Market structure |
Fragmented |
|
YoY growth 2024-2025(%) |
8.1 |
|
Key countries |
China, US, India, Germany, Japan, Brazil, France, South Korea, UK, and Canada |
|
Competitive landscape |
Leading Companies, Market Positioning of Companies, Competitive Strategies, and Industry Risks |
What are the Key Data Covered in this Expanded Polystyrene (EPS) For Packaging Market Research and Growth Report?
- CAGR of the Expanded Polystyrene (EPS) For Packaging industry during the forecast period
- Detailed information on factors that will drive the growth and forecasting between 2025 and 2029
- Precise estimation of the size of the market and its contribution of the industry in focus to the parent market
- Accurate predictions about upcoming growth and trends and changes in consumer behaviour
- Growth of the market across APAC, Europe, North America, South America, and Middle East and Africa
- Thorough analysis of the market's competitive landscape and detailed information about companies
- Comprehensive analysis of factors that will challenge the expanded polystyrene (eps) for packaging market growth of industry companies
We can help! Our analysts can customize this expanded polystyrene (eps) for packaging market research report to meet your requirements.
 RIA -
RIA - 
