Free Amino Acid Market Size 2024-2028
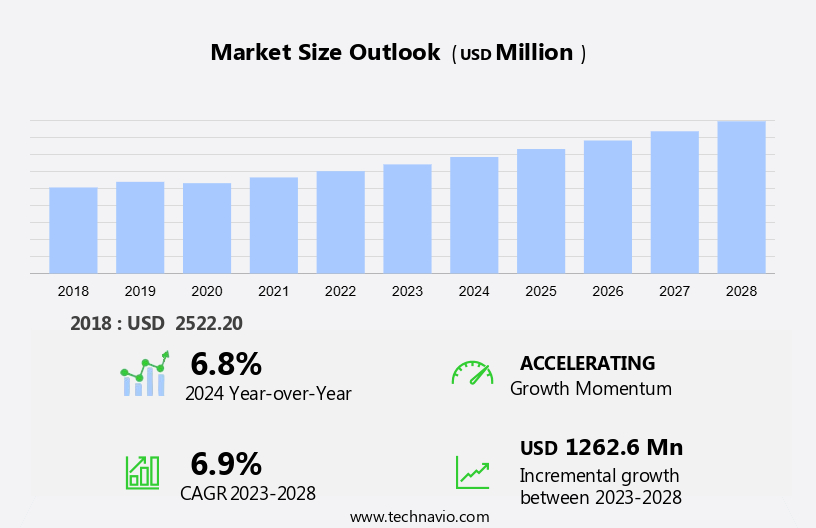
The free amino acid market size is forecast to increase by USD 1.26 billion at a CAGR of 6.9% between 2023 and 2028.
- The market is witnessing significant growth due to several key factors. One of the primary drivers is the increasing health consciousness among consumers, leading to a higher demand for nutritional supplements and functional foods containing these essential nutrients. Another trend influencing market growth is the focus of companies on new product launches to cater to evolving consumer preferences and expand their product portfolios. Vertical integration in agriculture and the use of environment-friendly fertilizers are key trends. The pharmaceutical, food and beverage, and dietary supplement industries are major consumers, with nutraceuticals gaining popularity due to their health benefits. However, the market is also facing challenges, such as the fluctuating prices of raw materials used in production, which can impact profitability and put pressure on manufacturers to find cost-effective solutions. Overall, the market is expected to experience steady growth In the coming years, driven by these factors and the ongoing demand for healthier food and beverage options.
What will be the Size of the Free Amino Acid Market During the Forecast Period?
- The market is a significant segment within the nutraceutical industry, driven by growing consumer awareness towards health and wellness. Amino acids, the building blocks of proteins, play crucial roles in various physiological functions such as immunity, depression, sleep difficulties, premenstrual dysphoric disorder, bruxism, and ADHD. The market sources raw materials from both plant-based and chemically derived sources, including soybean, wheat, and corn. Hydrothermal treatment and biomass waste utilization are emerging processing technologies. Glutamic acid, a key amino acid, is used for protein synthesis and as a flavor enhancer. Organic food production and the shift towards sustainable agriculture are influencing market dynamics. Digital solutions are also transforming the industry, improving supply chain efficiency and product traceability.
How is this Free Amino Acid Industry segmented and which is the largest segment?
The industry research report provides comprehensive data (region-wise segment analysis), with forecasts and estimates in "USD billion" for the period 2024-2028, as well as historical data from 2018-2022 for the following segments.
- Type
- Non-essential amino acids
- Essential amino acids
- Application
- Animal feed
- Healthcare
- Food and beverages
- Others
- Geography
- APAC
- China
- Japan
- South Korea
- North America
- US
- Europe
- Germany
- South America
- Middle East and Africa
- APAC
By Type Insights
- The non-essential amino acids segment is estimated to witness significant growth during the forecast period.
Non-essential amino acids are organic compounds the human body can synthesize, despite not being required In the diet. These compounds, including alanine, arginine, asparagine, aspartic acid, cysteine, glutamic acid, glutamine, glycine, proline, serine, and tyrosine, play essential roles In the body. They contribute to 11 of the 20 amino acids necessary for protein synthesis. Beyond protein synthesis, they participate in various metabolic pathways, influence tumor metabolism, provide precursors for macromolecule biosynthesis, regulate redox status and antioxidant systems, and serve as substrates for post-translational and epigenetic modifications. In industries such as poultry, Impossible Foods, agriculture, pharmaceuticals, food and beverage, and environmentally friendly fertilizers, they are valuable components due to their versatile functions.
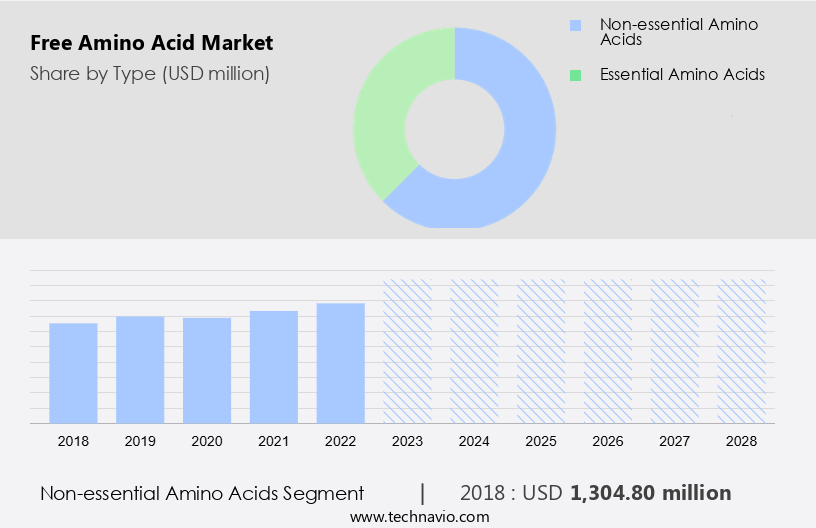
Get a glance at the Industry report of share of various segments Request Free Sample
The non-essential amino acids segment was valued at USD 1.3 billion in 2018 and showed a gradual increase during the forecast period.
Regional Analysis
- APAC is estimated to contribute 50% to the growth of the global market during the forecast period.
Technavio's analysts have elaborately explained the regional trends and drivers that shape the market during the forecast period.

For more insights on the market share of various regions, Request Free Sample
The market in Asia Pacific is experiencing steady growth due to the region's extensive livestock population and the increasing consumption of animal feed additives. India, in particular, has shown significant progress in its livestock sector, achieving a Compound Annual Growth Rate (CAGR) of 7.38% from 2014-15 to 2022-23. This growth has led to a substantial increase In the sector's contribution to the total Gross Value Added (GVA) in agriculture and allied sectors, rising from 24.32% in 2014-15 to 30.38% in 2022-23.
Furthermore, they are essential for enhancing livestock productivity and health, making them a crucial component of animal feed additives. The nutraceutical industry's growing interest in using natural plant-based raw materials for producing this further boosts the market's expansion. Applications in addressing various health conditions, such as immunity enhancement, depression, sleep difficulties, premenstrual dysphoric disorder, bruxism, and ADHD, add to the market's potential.
Market Dynamics
Our market researchers analyzed the data with 2023 as the base year, along with the key drivers, trends, and challenges. A holistic analysis of drivers will help companies refine their marketing strategies to gain a competitive advantage.
What are the key market drivers leading to the rise In the adoption of Free Amino Acid Industry?
Increasing health consciousness among people is the key driver of the market.
- In today's health-conscious society, amino acids have gained significant attention due to their role in various nutraceutical applications. These organic compounds are essential for protein synthesis and play a crucial part in immunity, depression, sleep difficulties, and other health issues. The nutraceutical industry utilizes amino acids derived from plant-based raw materials like soybean, wheat, and corn, as well as animal sources such as red meat, shellfish, eggs, and dairy products. The demand extends beyond human consumption, with applications in animal feed, antibiotics, and nutritional supplements. Biotechnology has also played a pivotal role In the production of proteinogenic amino acids, enhancing the nutritional value of food and beverages. Protein-rich foods like quinoa, soy products, and lysine are increasingly popular among bodybuilders, athletes, and sports supplements. Amino acids contribute to the immune system, cancer prevention, arthritis relief, and even tinnitus treatment.
- Furthermore, the market for amino acids is diverse, encompassing international sporting events, animal nutrition, feed additives, and pharmaceutical applications. Environmental sustainability is a growing concern, leading to the adoption of environment-friendly fertilizers and hydrothermal treatment in the production. Organic food and biomass waste are emerging trends In the market, offering health benefits and reducing waste. Digital solutions and poultry nutrition are other areas of growth, reflecting the industry's commitment to innovation and meeting nutrient requirements. Overall, the market is a dynamic and evolving industry, driven by the need for healthier food options and advancements in biotechnology. It caters to diverse applications, from human health to animal nutrition, and continues to innovate in response to changing consumer demands and environmental concerns.
What are the market trends shaping the Free Amino Acid Industry?
The increasing focus of market players on new product launches is the upcoming market trend.
- The market is experiencing significant growth In the nutraceutical industry as consumers seek natural solutions for various health issues. Amino acids, such as glutamic acid and lysine, are essential nutrients that play a crucial role in protein synthesis, immunity, and nutrient requirements for bodybuilders, athletes, and sports supplements. Plant-based raw materials, including soybean, wheat, and corn, are increasingly being used to produce nutritional food and feed additives. Biotechnology is also driving innovation In the market, with companies focusing on vertical integration and hydrothermal treatment of biomass waste to produce these. Nutraceuticals derived from amino acids offer health benefits for immunity, cancer, arthritis, sleep difficulties, depression, premenstrual dysphoric disorder, bruxism, ADHD, and tinnitus. Major food and beverage industries, including Red meat, shellfish, eggs, dairy products, quinoa, and soy products, are also significant consumers. The pharmaceutical industry uses amino acids as building blocks for antibiotics and nutritional supplements.
- Furthermore, the market is witnessing a trend towards environmentally friendly fertilizers and organic food production, further boosting demand. Digital solutions are also being integrated into poultry nutrition and animal feed to optimize nutrient requirements and address health issues. The international sporting events sector is another key market, with athletes and bodybuilders relying on them for optimal performance and recovery. Overall, the market is expected to continue growing, driven by increasing consumer awareness of their health benefits and the expanding applications in various industries.
What challenges does the Free Amino Acid Industry face during its growth?
Fluctuating prices of raw materials used in free amino acids production is a key challenge affecting the industry growth.
- The market is experiencing fluctuations due to the rising prices of plant-based raw materials, particularly soybean, wheat, and corn. The Nutraceutical industry's growing demand as immunity boosters, mood enhancers for depression and sleep difficulties, and treatment for conditions like Premenstrual Dysphoric Disorder and Bruxism, is driving the market. However, the increasing use in Animal feed, Antibiotics, and Nutritional supplements for bodybuilders and athletes In the Sports supplements sector, and as feed additives in Animal nutrition, is putting pressure on the prices of these raw materials. The Biotechnology industry's advancements in producing Proteinogenic amino acids from non-traditional sources and the use of plant-based raw materials in Nutritional food, Quinoa, and Soy products, are offering alternatives to traditional sources. The market's dynamics are further influenced by the environmental concerns surrounding Red meat, Shellfish, Eggs, and Dairy products, leading consumers to opt for more plant-based sources of amino acids.
- Furthermore, the market's growth is also impacted by the Immune system's role in Cancer, Arthritis, Tinnitus, and other health issues, making amino acids essential nutrients. The increasing popularity of Organic food and the shift towards Environment friendly fertilizers, Hydrothermal treatment, and Digital solutions in Agriculture, are also influencing the market's direction. The market's future outlook is promising, with potential opportunities in Pharmaceutical, Food and beverage, and Poultry nutrition. Despite the challenges, the market's future looks promising due to the health benefits associated with amino acids. The market's growth is expected to be influenced by the increasing demand from various sectors, including Animal nutrition, Feed additives, and Nutraceuticals, as well as the ongoing research and development In the field of amino acid production and application. The market's dynamics are complex, and the price fluctuations of raw materials, the increasing demand for plant-based sources, and the regulatory landscape are some of the key factors that will shape its future.
Exclusive Customer Landscape
The market forecasting report includes the adoption lifecycle of the market, covering from the innovator's stage to the laggard's stage. It focuses on adoption rates in different regions based on penetration. Furthermore, the market report also includes key purchase criteria and drivers of price sensitivity to help companies evaluate and develop their market growth analysis strategies.

Customer Landscape
Key Companies & Market Insights
Companies are implementing various strategies, such as strategic alliances, market forecast, market growth and forecasting, partnerships, mergers and acquisitions, geographical expansion, and product/service launches, to enhance their presence In the industry. The industry research and growth report includes detailed analyses of the competitive landscape of the market and information about key companies, including:
- Adisseo Co.
- Ajinomoto Co. Inc.
- Amino GmbH
- Archer Daniels Midland Co.
- Blue Star Corp
- Cargill Inc.
- CJ CheilJedang Corp.
- Daesang Corp.
- Evonik Industries AG
- Fermentis Life Sciences Pvt. Ltd.
- Glanbia plc
- Global Bio chem Technology Group Co. Ltd.
- Iris Biotech GmbH
- Kyowa Hakko Bio Co. Ltd.
- Pacific Rainbow International Inc.
- Sichuan Tongsheng Amino acid Co. Ltd
- Sigma Aldrich Chemicals Pvt Ltd
- Sumitomo Chemical Co. Ltd.
- The Taiwan Amino Acids Co. Ltd.
- Wacker Chemie AG
Qualitative and quantitative analysis of companies has been conducted to help clients understand the wider business environment as well as the strengths and weaknesses of key industry players. Data is qualitatively analyzed to categorize companies as pure play, category-focused, industry-focused, and diversified; it is quantitatively analyzed to categorize companies as dominant, leading, strong, tentative, and weak.
Research Analyst Overview
Understanding the Dynamics of the Amino Acid Market In the Nutraceutical Industry The amino acid market holds a significant role In the nutraceutical industry, with its wide-ranging applications in various sectors. Amino acids are organic compounds that play a crucial role in protein synthesis, which is essential for the growth and development of all living organisms. In the nutraceutical industry, amino acids are used to enhance the nutritional value of food and beverages, catering to diverse health needs. These include supporting immunity, addressing depression, sleep difficulties, premenstrual dysphoric disorder, bruxism, ADHD, and various other health issues. Plant-based raw materials, such as soybean, wheat, and corn, are the primary sources of amino acids In the nutraceutical industry. Vertical integration and biotechnology have played a pivotal role In the production and supply of these raw materials. Proteinogenic amino acids, which are essential for human health, are in high demand In the nutraceutical industry. These are crucial for the synthesis of proteins and play a vital role in various bodily functions. Bodybuilders and athletes frequently use nutritional supplements containing these amino acids to support their training regimens.
Furthermore, animal feed and antibiotics are other significant markets for amino acids. Amino acids are used as feed additives to improve animal nutrition and enhance agricultural output. In the pharmaceutical industry, amino acids are used In the production of various drugs, including those used to treat cancer, arthritis, tinnitus, and other health conditions. The nutraceutical industry's demand is driven by the increasing awareness of the health benefits associated with these compounds. The industry's growth is further fueled by the increasing popularity of organic food and the shift towards environmentally friendly fertilizers. The use of hydrothermal treatment and biomass waste In production is a promising trend In the industry. This approach not only reduces the environmental impact of production but also increases its sustainability. The amino acid market is diverse and dynamic, with various players, including Impossible Foods, operating in different segments.
Thus, the industry's growth is influenced by factors such as consumer preferences, regulatory policies, and technological advancements. In summary, the market plays a vital role In the nutraceutical industry, with its wide-ranging applications and diverse sources. The market's growth is driven by various factors, including health benefits, sustainability, and technological advancements. As the demand for nutraceuticals continues to grow, the market is expected to remain a significant contributor to the industry's growth.
|
Free Amino Acid Market Scope |
|
|
Report Coverage |
Details |
|
Page number |
215 |
|
Base year |
2023 |
|
Historic period |
2018-2022 |
|
Forecast period |
2024-2028 |
|
Growth momentum & CAGR |
Accelerate at a CAGR of 6.9% |
|
Market growth 2024-2028 |
USD 1.26 billion |
|
Market structure |
Fragmented |
|
YoY growth 2023-2024(%) |
6.8 |
|
Key countries |
US, China, Japan, South Korea, and Germany |
|
Competitive landscape |
Leading Companies, Market Positioning of Companies, Competitive Strategies, and Industry Risks |
What are the Key Data Covered in this Free Amino Acid Market Research and Growth Report?
- CAGR of the Free Amino Acid industry during the forecast period
- Detailed information on factors that will drive the Free Amino Acid growth and forecasting between 2024 and 2028
- Precise estimation of the size of the market and its contribution of the industry in focus to the parent market
- Accurate predictions about upcoming growth and trends and changes in consumer behaviour
- Growth of the market across APAC, North America, Europe, South America, and Middle East and Africa
- Thorough analysis of the market's competitive landscape and detailed information about companies
- Comprehensive analysis of factors that will challenge the free amino acid market growth of industry companies
We can help! Our analysts can customize this free amino acid market research report to meet your requirements.
 RIA -
RIA - 
