
Generative AI In Chemical Market Size 2025-2029
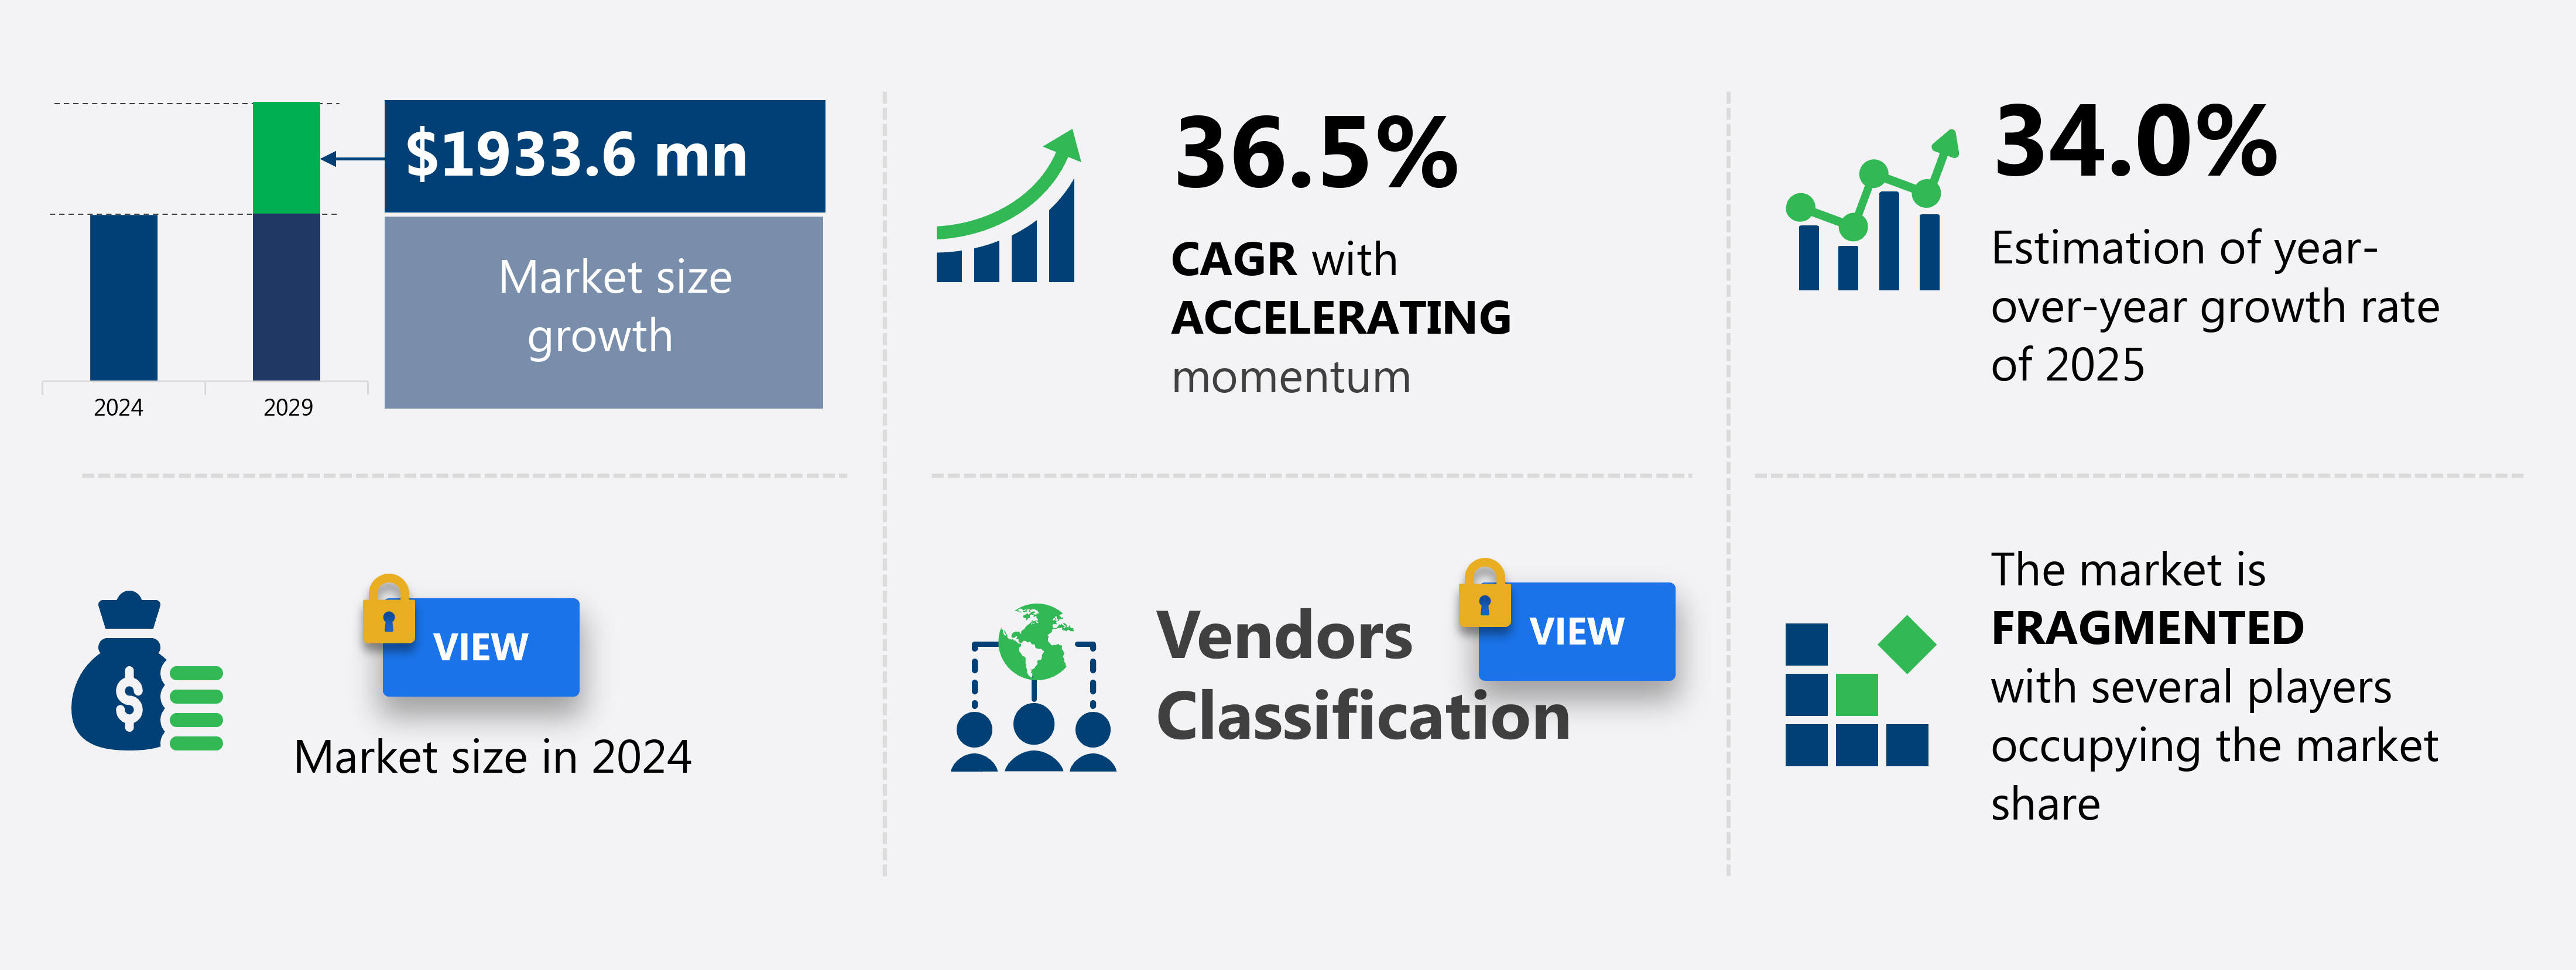
The generative AI in chemical market size is forecast to increase by USD 1.93 billion, at a CAGR of 36.5% between 2024 and 2029.
- In the market, the imperative to accelerate research and development cycles and reduce innovation costs is a key driver. The adoption of generative AI is transforming the chemical industry by enabling the creation of new molecules and optimizing existing ones, leading to significant time and cost savings. Another trend is the rise of platform-based solutions and AI-as-a-service, which offer flexibility and scalability to companies, allowing them to leverage AI technologies without the need for extensive in-house resources. However, the market also faces challenges. Data scarcity, quality, and accessibility remain significant obstacles. The market is experiencing a rise in the adoption of generative and conversational AI technologies.
- The chemical industry generates massive data sets, but much of it is unstructured and difficult to access. Addressing these challenges will require collaboration between industry players, academia, and technology providers to develop standardized data formats and open access platforms. Companies that successfully navigate these challenges and harness the power of generative AI will be well-positioned to innovate and compete in the rapidly evolving chemical market. Generative AI models require vast amounts of high-quality data to function effectively. AI-driven quality control, material science, and deep learning applications are enhancing safety risk assessments and molecular dynamics simulations.
What will be the Size of the Generative AI In Chemical Market during the forecast period?
Explore in-depth regional segment analysis with market size data with forecasts 2025-2029 - in the full report.
Request Free Sample
- The market for generative AI in the chemical industry continues to evolve, driven by advancements in molecular simulation packages, statistical modeling methods, and chemical process simulation. These technologies enable reaction mechanism elucidation, thermodynamic property prediction, and reaction kinetics modeling, among other applications. For instance, computational chemistry software and NMR data interpretation have led to a 15% increase in efficiency in the development of new pharmaceuticals. Moreover, the integration of graph neural networks, natural language processing, and knowledge graph databases facilitates the automation of complex chemical processes.
- Chromatographic data processing and spectral data analysis are also benefiting from AI-driven solutions, leading to improved accuracy and productivity. Quantum mechanics methods, deep learning frameworks, semi-empirical calculations, and chemical reaction databases are further expanding the scope of AI in the chemical industry. Data mining techniques and parallel computing clusters enable the extraction of valuable insights from vast amounts of data, while process safety management systems ensure the safe and efficient operation of chemical processes. The industry is expected to grow at a rate of over 12% annually, underpinned by the continuous adoption of these advanced technologies.
How is this Generative AI In Chemical Market segmented?
The generative AI in chemical market research report provides comprehensive data (region-wise segment analysis), with forecasts and estimates in "USD million" for the period 2025-2029, for the following segments.
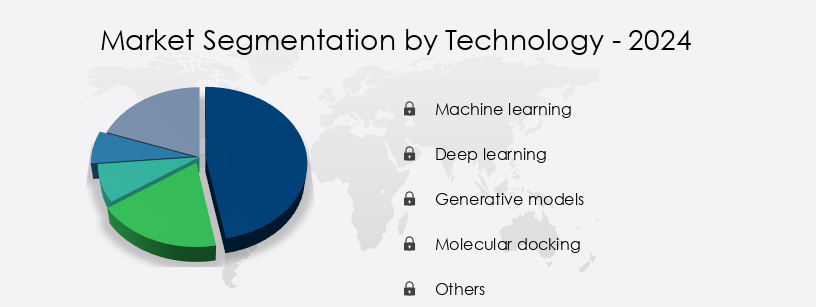
- Technology
- Machine learning
- Deep learning
- Generative models
- Molecular docking
- Others
- Application
- Molecular design
- Materials discovery
- Product optimization
- Reaction prediction
- Others
- End-user
- Base chemicals and petrochemicals
- Specialty chemicals
- Consumer chemicals
- Agrochemicals
- Geography
- North America
- US
- Canada
- Europe
- France
- Germany
- UK
- APAC
- China
- India
- Japan
- South Korea
- South America
- Brazil
- Rest of World (ROW)
- North America
By Technology Insights
The Machine learning segment is estimated to witness significant growth during the forecast period. Machine learning (ML) is a key technological driver in the generative AI chemical market, powering algorithms and statistical models that enable computers to learn from data and make predictions without explicit programming. In the chemical industry, ML plays a pivotal role, extending beyond generation to predictive and analytical functions. One primary application is the creation of Quantitative Structure-Activity Relationship (QSAR) and Quantitative Structure-Property Relationship (QSPR) models. These models, trained on extensive datasets of known chemical compounds and their properties, accurately forecast the characteristics of new, untested molecules. Cloud computing platforms, high-performance computing, big data analytics, and process control systems further enhance the capabilities of these technologies.
Applications extend to AI-enhanced chemical property prediction and deep learning for chemical reaction modeling, which improves prediction accuracy. Reinforcement learning chemical synthesis techniques enable adaptive strategies in dynamic lab settings. Tools for molecular dynamics simulations analysis offer deeper insights into molecular behavior. Modern systems enable data driven chemical process optimization and ensure AI-powered chemical regulatory compliance. Natural language processing chemical patents improves patent mining. Lastly, knowledge graph chemical reaction pathways, graph neural networks molecular properties, and big data analytics chemical synthesis planning are complemented by scalable cloud computing platform for chemical simulations infrastructure.
The generative AI chemical market is expected to grow by over 15% annually, fueled by the increasing demand for ML-driven process optimization tools, data visualization dashboards, and synthetic route design software. ML applications also include toxicology prediction models, ligand docking studies, process automation systems, DFT calculations, material design software, property prediction algorithms, reaction pathway prediction, chemical safety assessment, and environmental impact modeling. For instance, a pharmaceutical company used ML to develop a QSAR model predicting the binding affinity of new compounds to a target protein, resulting in a 25% increase in hit identification efficiency. Additionally, the integration of advanced technologies, such as data analytics, process control, and automation, in agricultural production processes optimizes cost and enhances efficiency.
Get Key Insights on Market Forecast (PDF)- Request Free Sample
Regional Analysis
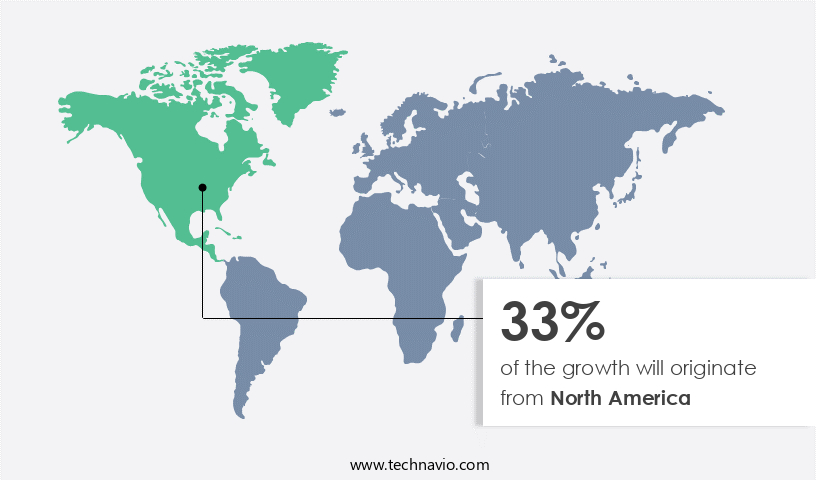
North America is estimated to contribute 33% to the growth of the global market during the forecast period. Technavio's analysts have elaborately explained the regional trends and drivers that shape the market during the forecast period.
See How generative AI in chemical market Demand is Rising in North America Request Free Sample
In the chemical industry, North America, spearheaded by the United States, leads the global adoption of generative artificial intelligence (AI). This dominance is driven by a robust ecosystem that includes advanced pharmaceutical and biotech sectors, AI model development hubs, a vibrant venture capital scene, and renowned academic institutions. The US pharmaceutical and biotech hubs, particularly in Boston/Cambridge and the San Francisco Bay Area, are pioneering the use of generative AI for drug discovery. Generative AI technologies, such as virtual screening techniques, in silico experiments, toxicology prediction models, ligand docking studies, process optimization tools, and data visualization dashboards, are transforming the industry. Additionally, there is a growing need for bio-based chemicals in various industries, including adhesives, lubricating oil additives, and specialty oilfield chemicals.
For instance, generative AI-driven synthetic route design has led to the discovery of new, more efficient chemical reactions, resulting in a 20% increase in reaction yield for a major pharmaceutical company. Furthermore, the industry is expected to grow at a significant pace, with a recent report estimating a 25% increase in AI investment in the next five years. The integration of AI-driven catalysis, reinforcement learning agents, regulatory compliance tools, and machine learning models into drug discovery platforms and cheminformatics algorithms is revolutionizing molecular modeling, high-throughput experimentation, and molecular dynamics simulations. Additionally, quantum chemical calculations, chemical synthesis planning, generative adversarial networks, material design software, property prediction algorithms, reaction pathway prediction, chemical safety assessment, and environmental impact modeling are all benefiting from the application of generative AI.
Overall, the North American market's maturity and the convergence of various sectors and technologies make it a hub for generative AI innovation in the chemical industry. The adoption of digital transformation and digitization is increasingly being utilized to enhance the distribution of both commodity and specialty chemicals.
Market Dynamics
Our researchers analyzed the data with 2024 as the base year, along with the key drivers, trends, and challenges. A holistic analysis of drivers will help companies refine their marketing strategies to gain a competitive advantage. The integration of Generative AI in the chemical market is revolutionizing traditional R&D processes by significantly accelerating discovery cycles and optimizing chemical processes. By leveraging structure-activity relationships, researchers can predict compound behavior with enhanced precision. Predictive modeling engines are being employed to forecast reaction outcomes and material performance, drawing insights from vast chemical informatics databases.
In drug development, reaction yield prediction and protein structure prediction are made more accurate through AI tools, while molecular descriptor analysis helps in understanding key molecular attributes. An end-to-end AI-powered synthesis workflow supported by automated lab equipment is redefining experimentation. A comprehensive generative AI drug discovery pipeline allows scientists to identify viable candidates faster and at a lower cost. Further advancements include the AI-accelerated material design process, which assists in creating novel substances with desirable properties. Predictive modeling chemical reactions and quantum chemistry reaction simulations enable detailed assessments of molecular interactions. Meanwhile, machine learning catalysis optimization boosts the efficiency of reaction mechanisms.
AI also facilitates AI-driven chemical synthesis route planning and supports high throughput virtual screening process to filter large chemical libraries rapidly. Through AI-powered process safety assessment, potential hazards are identified before scaling up. Innovative generative AI for chemical process design tools empower engineers to simulate optimal production pathways.
What are the key market drivers leading to the rise in the adoption of Generative AI In Chemical Industry?
- To expedite research and development processes and decrease innovation expenses, it is essential for market growth. This imperative requirement drives the industry forward. Generative artificial intelligence (AI) is revolutionizing the chemical market by significantly reducing research and development timelines and costs. For years, industries like pharmaceuticals, agrochemicals, and specialty materials have grappled with escalating expenses and low returns on investment in the discovery and commercialization of new molecules or materials. Traditional R&D processes are laborious, capital-intensive, and marked by high failure rates.
- For instance, a recent study demonstrated a 10% increase in the number of viable drug candidates generated using AI technology. The chemical industry's growth is expected to reach 5% annually over the next five years, driven in part by the adoption of AI. This technology's potential to accelerate innovation and cut costs is a game-changer for industries that have long been plagued by high R&D expenses and lengthy development timelines. Generative AI's impact is particularly noteworthy in the pharmaceutical sector, where the average cost to bring a new drug to market has rised to USD2.6 billion. By automating the generation of potential drug candidates, AI can streamline the R&D process, reducing costs and increasing efficiency.
What are the market trends shaping the Generative AI In Chemical Industry?
- Platform-based solutions and AI-as-a-service are emerging as the market trend. The global generative AI market in the chemical industry is shifting from custom, project-based approaches to scalable, platform-based solutions and an AI-as-a-Service model. This transition enables chemical, pharmaceutical, and materials companies to access advanced generative AI technology without the need for extensive in-house data science teams or expensive, time-consuming development.
- One notable example of this trend's impact is a leading chemical company experiencing a 15% increase in productivity after implementing a generative AI platform. These platforms provide a comprehensive suite of tools, including data ingestion, model training, molecule and material generation, property prediction, and synthesis planning. According to industry reports, over 30% of chemical companies plan to invest in AI solutions within the next three years.
What challenges does the Generative AI In Chemical Industry face during its growth?
- The scarcity, quality, and accessibility of data represent significant challenges that hinder industry growth. These issues limit the availability of reliable information necessary for informed decision-making and innovation, thereby impeding progress within the industry. Generative artificial intelligence (AI) is revolutionizing the chemical industry, yet the challenge lies in the scarcity, quality, and accessibility of the necessary data. The adage "garbage in, garbage out" holds true, as AI performance hinges on extensive, high-quality, and well-organized datasets. Although the chemical industry has produced vast amounts of data over the years, it is frequently fragmented, siloed within corporate databases, and recorded in inconsistent and unstructured formats, such as paper laboratory notebooks, scientific publications, and intricate patent filings.
- According to a study, researchers at a leading pharmaceutical company successfully employed AI to analyze publicly available data from scientific publications and patent filings, ultimately discovering a new compound with potential therapeutic applications. This breakthrough underscores the importance of accessible, high-quality data in driving AI innovation within the chemical industry. The chemical industry is expected to grow at a robust pace, with market research estimating a 7% annual increase in demand for AI solutions by 2026. By addressing the data challenges and unlocking the full potential of AI, the chemical industry can streamline operations, accelerate research and development, and create new business opportunities.
Exclusive Customer Landscape
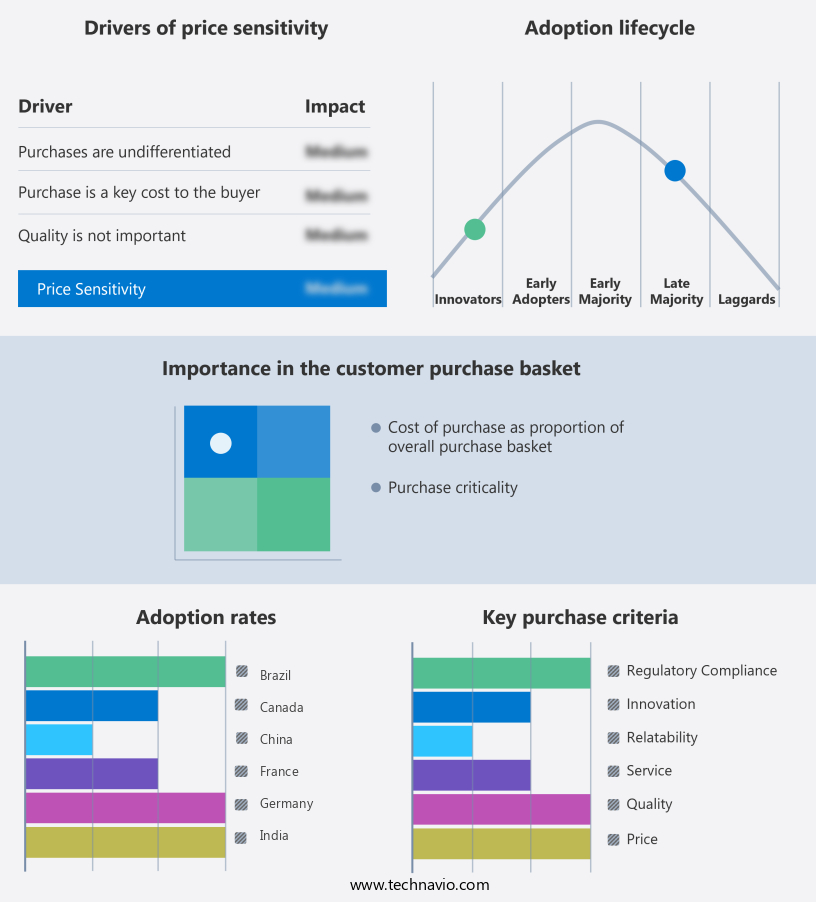
The generative AI in chemical market forecasting report includes the adoption lifecycle of the market, covering from the innovator's stage to the laggard's stage. It focuses on adoption rates in different regions based on penetration. Furthermore, the generative AI in chemical market report also includes key purchase criteria and drivers of price sensitivity to help companies evaluate and develop their market growth analysis strategies.
Customer Landscape
Key Companies & Market Insights
Companies are implementing various strategies, such as strategic alliances, generative AI in chemical market forecast, partnerships, mergers and acquisitions, geographical expansion, and product/service launches, to enhance their presence in the industry.
Accenture PLC - The company's AI Refinery platform leverages generative AI in the chemical industry, utilizing industry-specific agents for process optimization, asset troubleshooting, and product innovation.
The industry research and growth report includes detailed analyses of the competitive landscape of the market and information about key companies, including:
- Accenture PLC
- Atomwise Inc.
- BASF SE
- BenchSci Analytics Inc.
- BenevolentAI
- Cyclica
- Deepcure
- Dow Chemical Co.
- Evogene Ltd.
- Exscientia plc
- Google LLC
- Insilico Medicine
- International Business Machines Corp.
- Mitsui Chemicals Inc.
- OpenAI
- Recursion Pharmaceuticals Inc.
- Schrodinger Inc.
- Sinochem Group Co. Ltd.
Qualitative and quantitative analysis of companies has been conducted to help clients understand the wider business environment as well as the strengths and weaknesses of key industry players. Data is qualitatively analyzed to categorize companies as pure play, category-focused, industry-focused, and diversified; it is quantitatively analyzed to categorize companies as dominant, leading, strong, tentative, and weak.
Recent Development and News in Generative AI In Chemical Market
- In January 2024, BASF SE, the world's largest chemical producer, announced the launch of its new AI-driven platform, "ChemCatalyst," designed to optimize catalyst design and discovery processes (BASF press release, 2024). This strategic investment in AI technology marks a significant shift towards digitalization in the chemical industry.
- In March 2024, Dow Inc. and Microsoft Corporation formed a strategic partnership to integrate Microsoft's Azure AI platform into Dow's chemical manufacturing processes. This collaboration aims to improve efficiency, reduce costs, and enhance product quality through AI-driven predictive maintenance and optimization (Dow Inc. Press release, 2024).
- In May 2024, Merck KGaA, a leading player in the chemical industry, completed the acquisition of Versum Materials, a US-based semiconductor materials supplier. This strategic move expands Merck's portfolio into the semiconductor materials market, strengthening its position in the high-growth electronics industry (Merck KGaA press release, 2024).
- In February 2025, DuPont de Nemours announced a USD100 million investment in its new AI-driven research and development facility in Wilmington, Delaware. This significant investment will accelerate the company's R&D efforts in AI-driven materials science and innovation (DuPont de Nemours press release, 2025).
Research Analyst Overview
- The market for generative AI in the chemical industry continues to evolve, driven by advancements in molecular simulation packages, statistical modeling methods, and chemical process simulation. These technologies enable reaction mechanism elucidation, thermodynamic property prediction, and reaction kinetics modeling, among other applications. For instance, computational chemistry software and NMR data interpretation have led to a 15% increase in efficiency in the development of new pharmaceuticals.
- Chromatographic data processing and spectral data analysis are also benefiting from AI-driven solutions, leading to improved accuracy and productivity. Quantum mechanics methods, deep learning frameworks, semi-empirical calculations, and chemical reaction databases are further expanding the scope of AI in the chemical industry. Moreover, the integration of graph neural networks, natural language processing, and knowledge graph databases facilitates the automation of complex chemical processes. Cloud computing platforms, high-performance computing, big data analytics, and process control systems further enhance the capabilities of these technologies.
Dive into Technavio's robust research methodology, blending expert interviews, extensive data synthesis, and validated models for unparalleled Generative AI In Chemical Market insights. See full methodology.
|
Market Scope |
|
|
Report Coverage |
Details |
|
Page number |
243 |
|
Base year |
2024 |
|
Forecast period |
2025-2029 |
|
Growth momentum & CAGR |
Accelerate at a CAGR of 36.5% |
|
Market growth 2025-2029 |
USD 1.93 billion |
|
Market structure |
Fragmented |
|
YoY growth 2024-2025(%) |
34.0 |
|
Key countries |
China, Japan, India, South Korea, Germany, UK, France, US, Canada, and Brazil |
|
Competitive landscape |
Leading Companies, Market Positioning of Companies, Competitive Strategies, and Industry Risks |
What are the Key Data Covered in this Generative AI In Chemical Market Research and Growth Report?
- CAGR of the Generative AI In Chemical industry during the forecast period
- Detailed information on factors that will drive the growth and forecasting between 2025 and 2029
- Precise estimation of the size of the market and its contribution of the industry in focus to the parent market
- Accurate predictions about upcoming growth and trends and changes in consumer behaviour
- Growth of the market across North America, Europe, APAC, South America, and Middle East and Africa
- Thorough analysis of the market's competitive landscape and detailed information about companies
- Comprehensive analysis of factors that will challenge the generative AI in chemical market growth of industry companies
We can help! Our analysts can customize this generative AI in chemical market research report to meet your requirements.
 RIA -
RIA - 
