
Generative AI In Construction Market Size 2025-2029
The generative ai in construction market size is valued to increase by USD 3.57 billion, at a CAGR of 48.3% from 2024 to 2029. Radical enhancement of preconstruction, design, and planning efficiency will drive the generative ai in construction market.
Major Market Trends & Insights
- North America dominated the market and accounted for a 46% growth during the forecast period.
- By Technology - Machine learning segment was valued at USD 0.00 billion in 2023
- By Type - Commercial construction segment accounted for the largest market revenue share in 2023
Market Size & Forecast
- Market Opportunities: USD 617.14 million
- Market Future Opportunities: USD 3572.60 million
- CAGR from 2024 to 2029 : 48.3%
Market Summary
- Generative AI, a subset of artificial intelligence, is revolutionizing the construction industry by significantly enhancing preconstruction, design, and planning efficiency. This technology, which uses machine learning algorithms to generate new content, is increasingly being adopted to augment workforce productivity. However, the foundational barrier of data fragmentation and quality poses a challenge. According to recent studies, the global market value for generative AI in construction is projected to reach USD2.5 billion by 2025, underscoring its potential impact. By automating repetitive tasks, such as generating design options or creating building information models, generative AI frees up human resources for more complex problem-solving tasks.
- Despite these advancements, addressing data inconsistencies and ensuring data accuracy remain critical to realizing the full potential of generative AI in construction. This technology's ability to learn from vast amounts of data and generate innovative solutions is transforming the industry, offering significant benefits for businesses seeking to streamline operations and improve project outcomes.
What will be the Size of the Generative AI In Construction Market during the forecast period?
Get Key Insights on Market Forecast (PDF) Request Free Sample
How is the Generative AI In Construction Market Segmented ?
The generative ai in construction industry research report provides comprehensive data (region-wise segment analysis), with forecasts and estimates in "USD million" for the period 2025-2029, as well as historical data from 2019-2023 for the following segments.
- Technology
- Machine learning
- Natural language processing
- Others
- Type
- Commercial construction
- Residential construction
- Infrastructure construction
- Industrial construction
- Others
- Application
- Design and planning
- Construction optimization
- Project management
- Others
- Geography
- North America
- US
- Canada
- Mexico
- Europe
- France
- Germany
- UK
- APAC
- China
- India
- Japan
- South Korea
- Rest of World (ROW)
- North America
By Technology Insights
The machine learning segment is estimated to witness significant growth during the forecast period.
Generative AI is revolutionizing the construction industry with its advanced capabilities, particularly in the field of machine learning. This technology, which includes applications such as computer vision, building information modeling, and construction simulation software, is driving innovation in various areas. For instance, natural language processing is used for blueprint automation tools and design collaboration platforms, while defect detection AI and virtual reality construction enhance site safety and improve quality. Additionally, machine learning is employed for energy efficiency modeling, material selection, project scheduling optimization, progress tracking systems, equipment maintenance, and 3D printing construction. One notable example is the use of generative design algorithms, which can produce thousands of optimized design options based on specified constraints, such as structural integrity, material costs, and energy efficiency.
Machine learning also plays a crucial role in predictive modeling construction, enabling accurate forecasts of project timelines and budgets based on historical data. This technology's impact is substantial, with a recent study estimating that AI and machine learning could save the construction industry up to USD1.6 trillion by 2025.
The Machine learning segment was valued at USD 0.00 billion in 2019 and showed a gradual increase during the forecast period.
Regional Analysis
North America is estimated to contribute 46% to the growth of the global market during the forecast period.Technavio’s analysts have elaborately explained the regional trends and drivers that shape the market during the forecast period.
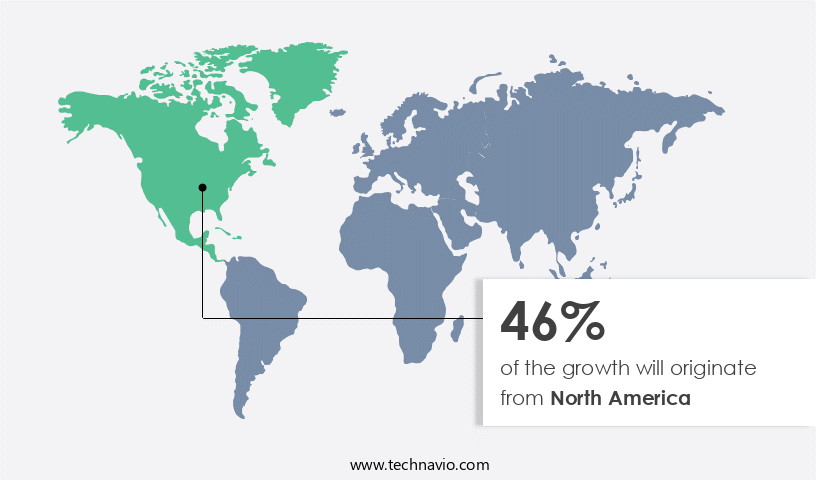
See How Generative AI In Construction Market Demand is Rising in North America Request Free Sample
Generative AI is making significant strides in the construction sector, with North America leading the charge. This region, home to advanced technological ecosystems in the United States and Canada, is driving innovation in the Architecture, Engineering, and Construction (AEC) industry. Fueled by substantial venture capital investment, global software companies like Autodesk, Trimble, and Bentley Systems are at the forefront of this transformation. They are integrating generative AI capabilities into their flagship products, enabling architects and urban planners to rapidly create and evaluate design options based on various criteria.
For instance, Autodesk's Forma platform, part of its Industry Cloud solutions, now features AI-powered predictive analysis tools. Introduced in September 2023, these tools allow users to generate numerous design options based on factors such as sunlight exposure, wind patterns, and noise levels. This integration of generative AI is revolutionizing the construction sector, offering increased efficiency, accuracy, and flexibility.
Market Dynamics
Our researchers analyzed the data with 2024 as the base year, along with the key drivers, trends, and challenges. A holistic analysis of drivers will help companies refine their marketing strategies to gain a competitive advantage.
The construction industry is experiencing a technological revolution, with generative AI emerging as a game-changer. This advanced technology is redefining various aspects of construction, from structural design to project management. Generative AI algorithms are revolutionizing structural design by automating the creation of innovative and efficient designs for prefabrication. By learning from vast datasets, these algorithms can generate unique designs that optimize materials and reduce costs. Machine learning is another AI technology making waves in construction, particularly for cost estimation. By analyzing historical data, these systems can accurately predict costs, ensuring more accurate budgeting and reducing the risk of cost overruns. Deep learning is transforming defect detection, enabling AI systems to identify defects in real-time, improving quality control and reducing rework. Robotics, integrated with generative AI, are automating construction processes, increasing productivity and reducing labor costs. BIM integration with generative AI is streamlining design and construction processes, while computer vision ensures site safety by detecting potential hazards and alerting workers in real-time. AI-powered project risk management systems use natural language processing to analyze project data, predicting potential risks and suggesting mitigation strategies. Predictive modeling is another application of AI in construction, helping to identify and mitigate construction delays. Reinforcement learning is being used to optimize robotics control, improving efficiency and reducing errors. Digital twins are providing real-time monitoring of construction projects, while 3D printing techniques are revolutionizing construction methods, enabling the creation of complex structures with minimal waste. Virtual and augmented reality are enhancing design collaboration, allowing teams to work together in a more immersive and efficient way. An AI-driven material selection process is optimizing the use of materials, reducing waste, and improving sustainability. Automated quantity takeoff techniques and AI-powered resource allocation strategies are improving productivity and reducing costs. Construction waste management AI solutions are enabling more effective waste reduction and recycling. In conclusion, generative AI is transforming the construction industry, from design to project management, enabling more efficient, cost-effective, and sustainable construction processes.
What are the key market drivers leading to the rise in the adoption of Generative AI In Construction Industry?
- Achieving a radical enhancement in preconstruction, design, and planning processes is essential for driving market efficiency and competitiveness.
- The market is experiencing significant growth and transformation, revolutionizing the architecture, engineering, and construction (AEC) industry. Traditional design processes in this sector have long been marked by extended design cycles, numerous revisions, and a disconnect between initial concepts and final constructability. Generative AI addresses these inefficiencies by automating and optimizing complex design processes, enabling architects and engineers to move beyond manual iteration.
- Instead, they define project constraints such as budget, material usage, energy performance, and spatial requirements, allowing the AI engine to generate numerous design permutations, typically in the thousands, that comply with these specifications. This innovative technology significantly improves efficiency during the preconstruction and design phases, making it an essential tool for the AEC industry's digital transformation.
What are the market trends shaping the Generative AI In Construction Industry?
- The emphasis on enhancing workforce productivity is a prevailing market trend. It is essential for organizations to focus on this area to remain competitive.
- The construction industry's reliance on generative AI is escalating due to the pressing requirement to augment workforce productivity. Globally, the industry grapples with a labor shortage, amplified by an aging workforce, high retirement rates, and a dwindling influx of new talent. This talent crunch leads to project delays, escalating labor costs, and potential risks for both public infrastructure and private development projects. Generative AI serves as an effective response, not as a labor replacement, but as an intelligent force multiplier.
- It complements existing teams by enhancing their capabilities and automating labor-intensive, repetitive tasks. According to recent studies, The market is projected to expand substantially, with an estimated 25% of construction firms expected to adopt AI technologies by 2025. This adoption rate underscores the industry's recognition of AI's potential to streamline operations, optimize resources, and boost overall efficiency.
What challenges does the Generative AI In Construction Industry face during its growth?
- The foundational barrier of data fragmentation and quality poses a significant challenge to industry growth, as effective data integration and maintenance are essential for businesses to make informed decisions and remain competitive.
- The construction industry's adoption of generative AI is a developing trend, driven by the need to streamline processes and enhance efficiency. However, the industry's fragmented data landscape poses a significant challenge. With stakeholders ranging from architects to materials suppliers, project data exists in various formats, including BIM files, CAD drawings, PDFs, spreadsheets, and even physical documents. According to recent studies, up to 80% of construction projects experience data loss or corruption, leading to project delays and cost overruns. Generative AI's potential to analyze and synthesize data from diverse sources can help mitigate these issues, enabling improved project planning, real-time progress tracking, and predictive maintenance.
- Additionally, AI can assist in optimizing resource allocation, reducing waste, and ensuring compliance with building codes and regulations. By integrating generative AI into the construction process, stakeholders can collaborate more effectively, ultimately leading to increased productivity and profitability.
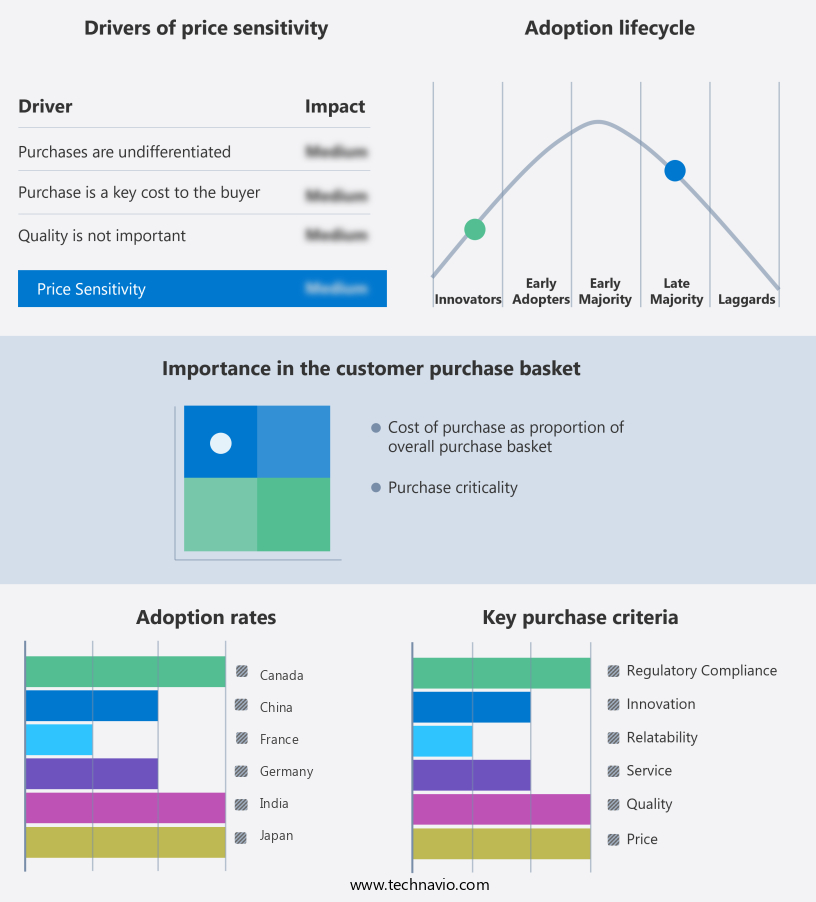
Exclusive Technavio Analysis on Customer Landscape
The generative ai in construction market forecasting report includes the adoption lifecycle of the market, covering from the innovator’s stage to the laggard’s stage. It focuses on adoption rates in different regions based on penetration. Furthermore, the generative ai in construction market report also includes key purchase criteria and drivers of price sensitivity to help companies evaluate and develop their market growth analysis strategies.
Customer Landscape of Generative AI In Construction Industry
Competitive Landscape
Companies are implementing various strategies, such as strategic alliances, generative ai in construction market forecast, partnerships, mergers and acquisitions, geographical expansion, and product/service launches, to enhance their presence in the industry.
ALICE Technologies - This company provides a platform for construction optioneering, enabling the generation and simulation of numerous potential schedules to optimize project planning. Through advanced technology, it offers a comprehensive solution for managing complex construction timelines.
The industry research and growth report includes detailed analyses of the competitive landscape of the market and information about key companies, including:
- ALICE Technologies
- ARK-BIM
- Augmenta
- Autodesk Inc.
- Bentley Systems Inc.
- Blackshark.ai GmbH
- Dassault Systemes SE
- Finch
- Microsoft Corp.
- Nemetschek SE
- nPlan Ltd.
- NVIDIA Corp.
- Open Space Labs Inc.
- Oracle Corp.
- Procore Technologies Inc.
- SWAPP.AI
- Togal.AI.
- Trimble Inc.
Qualitative and quantitative analysis of companies has been conducted to help clients understand the wider business environment as well as the strengths and weaknesses of key industry players. Data is qualitatively analyzed to categorize companies as pure play, category-focused, industry-focused, and diversified; it is quantitatively analyzed to categorize companies as dominant, leading, strong, tentative, and weak.
Recent Development and News in Generative AI In Construction Market
- In January 2024, Autodesk, a leading design software company, announced the launch of Dreamcatcher, an AI-driven design tool for architects and engineers, to streamline the design process in construction (Autodesk Press Release, 2024). In March 2024, Skanska, a global construction firm, partnered with Microsoft to integrate Microsoft's Azure-based AI solutions into Skanska's project management systems, aiming to enhance efficiency and productivity (Skanska Press Release, 2024).
- In April 2024, Procore, a leading construction management software provider, raised USD150 million in a Series E funding round, bringing its total funding to USD450 million. The investment will be used to expand its product offerings, including AI-driven solutions for project management and design coordination (Procore Press Release, 2024). In May 2025, the European Union passed the Digital Construction Twin Regulation, mandating the use of digital twins in all public construction projects starting from 2027. This regulatory push is expected to accelerate the adoption of generative AI in the European construction market (European Parliament Press Release, 2025).
Dive into Technavio’s robust research methodology, blending expert interviews, extensive data synthesis, and validated models for unparalleled Generative AI In Construction Market insights. See full methodology.
|
Market Scope |
|
|
Report Coverage |
Details |
|
Page number |
242 |
|
Base year |
2024 |
|
Historic period |
2019-2023 |
|
Forecast period |
2025-2029 |
|
Growth momentum & CAGR |
Accelerate at a CAGR of 48.3% |
|
Market growth 2025-2029 |
USD 3572.6 million |
|
Market structure |
Fragmented |
|
YoY growth 2024-2025(%) |
36.3 |
|
Key countries |
China, Japan, India, South Korea, Germany, UK, France, US, Canada, and Mexico |
|
Competitive landscape |
Leading Companies, Market Positioning of Companies, Competitive Strategies, and Industry Risks |
Research Analyst Overview
- The construction industry continues to embrace technological advancements, with generative AI emerging as a game-changer. Applications of computer vision, building information modeling (BIM), and construction simulation software are transforming design and planning processes. Natural language processing (NLP) is revolutionizing project communication, while defect detection AI and virtual reality construction enhance site safety and productivity. Material selection AI, energy efficiency modeling, and worker safety systems are optimizing operations and reducing waste. Blueprint automation tools, quantity takeoff software, and automated material estimation streamline project management. Project scheduling optimization, progress tracking systems, and equipment maintenance AI improve efficiency and reduce downtime.
- Generative design algorithms, digital twin technology, and design collaboration platforms enable real-time design iterations. Structural analysis software, AI-powered BIM software, augmented reality overlays, and prefabrication optimization are redefining construction processes. Risk assessment algorithms, predictive modeling construction, cost estimation AI, resource allocation AI, and reinforcement learning robotics are driving innovation and cost savings. According to recent market research, the global construction AI market is expected to grow by over 25% annually, underscoring the industry's commitment to digital transformation. For instance, a leading construction firm reported a 30% reduction in design time by implementing generative design algorithms, demonstrating the potential of AI in the sector.
What are the Key Data Covered in this Generative AI In Construction Market Research and Growth Report?
-
What is the expected growth of the Generative AI In Construction Market between 2025 and 2029?
-
USD 3.57 billion, at a CAGR of 48.3%
-
-
What segmentation does the market report cover?
-
The report is segmented by Technology (Machine learning, Natural language processing, and Others), Type (Commercial construction, Residential construction, Infrastructure construction, Industrial construction, and Others), Application (Design and planning, Construction optimization, Project management, and Others), and Geography (North America, APAC, Europe, Middle East and Africa, and South America)
-
-
Which regions are analyzed in the report?
-
North America, APAC, Europe, Middle East and Africa, and South America
-
-
What are the key growth drivers and market challenges?
-
Radical enhancement of preconstruction, design, and planning efficiency, Foundational barrier of data fragmentation and quality
-
-
Who are the major players in the Generative AI In Construction Market?
-
ALICE Technologies, ARK-BIM, Augmenta, Autodesk Inc., Bentley Systems Inc., Blackshark.ai GmbH, Dassault Systemes SE, Finch, Microsoft Corp., Nemetschek SE, nPlan Ltd., NVIDIA Corp., Open Space Labs Inc., Oracle Corp., Procore Technologies Inc., SWAPP.AI, Togal.AI., and Trimble Inc.
-
Market Research Insights
- The market for AI in construction is continuously evolving, integrating advanced technologies such as machine learning, safety compliance AI, structural design software, collaborative design tools, and deep learning construction. These innovations streamline processes, enhance productivity, and improve safety in the industry. For instance, the implementation of AI-driven project management and automated report generation has led to a 30% reduction in project reporting time for some firms. Furthermore, the construction industry is expected to grow at a rate of 10% annually over the next decade, driven by the adoption of data-driven decision-making tools, building performance analysis, and virtual site walkthroughs. These technologies enable real-time progress monitoring, automated quality control, and predictive maintenance, ultimately contributing to more efficient and cost-effective construction projects.
We can help! Our analysts can customize this generative ai in construction market research report to meet your requirements.
 RIA -
RIA - 
