
Generative AI In Real Estate Market Size 2025-2029
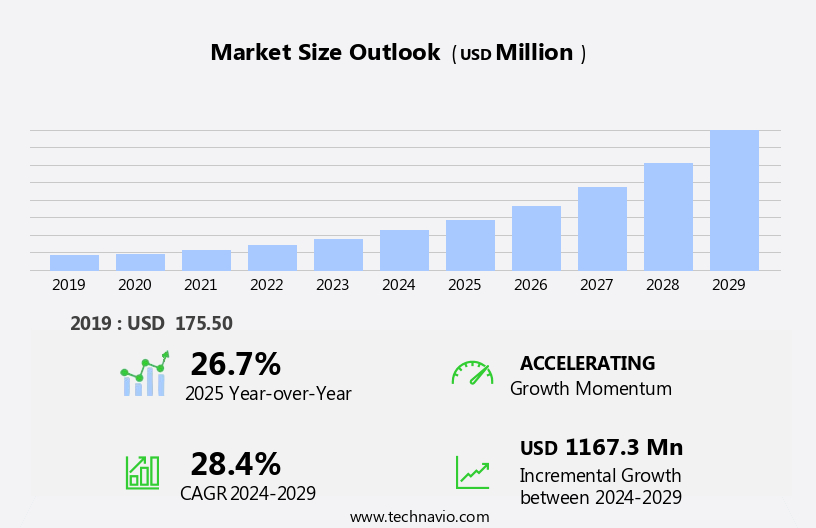
The generative AI in real estate market size is forecast to increase by USD 1.17 billion at a CAGR of 28.4% between 2024 and 2029.
- In the real estate sector, the increasing demand for hyper-personalized experiences and enhanced customer engagement is driving the adoption of generative AI. This technology enables the creation of hyper-realistic virtual staging and generative design, catering to the unique preferences of potential buyers and tenants. However, the integration of AI in real estate comes with challenges. Data privacy, security, and evolving regulatory scrutiny pose significant obstacles, necessitating robust data protection measures and regulatory compliance. The adoption of blockchain technology for secure transactions adds an additional layer of trust and reliability to the market.
- By addressing these issues, real estate businesses can leverage AI to deliver personalized experiences, streamline operations, and gain a competitive edge in the market. Companies seeking to capitalize on the opportunities presented by generative AI in real estate must prioritize these challenges to ensure secure and ethical implementation. Virtual reality technology and mixed reality environments are becoming more prevalent, offering users unique and interactive spaces for socializing, working, and even purchasing virtual property.
What will be the Size of the Generative AI In Real Estate Market during the forecast period?
Explore in-depth regional segment analysis with market size data - historical 2019-2023 and forecasts 2025-2029 - in the full report.
Request Free Sample
The market for generative AI in real estate continues to evolve, with applications spanning various sectors and driving significant changes. Architectural visualization and property condition assessment are revolutionizing the design and construction process, reducing transaction costs by up to 10%. Deep learning models and image recognition technology are enhancing risk mitigation strategies, enabling accurate property pricing models and investment return analysis. Market trend prediction and demand forecasting models are optimizing sales performance metrics, while compliance automation and legal document review streamline operations. Virtual reality experiences and augmented reality overlays offer new dimensions in customer satisfaction metrics, and sustainability assessment and environmental impact analysis are shaping the industry's future.
The real estate AI market is expected to grow by over 20% annually, as businesses increasingly adopt these technologies to remain competitive. For instance, a leading property management software company reported a 15% increase in sales after implementing a lease renewal prediction system. Regulatory uncertainty remains a challenge, but innovation in construction technologies, such as generators and renewable energy solutions, is helping mitigate risks.
How is this Generative AI In Real Estate Industry segmented?
The generative AI in real estate industry research report provides comprehensive data (region-wise segment analysis), with forecasts and estimates in "USD million" for the period 2025-2029, as well as historical data from 2019-2023 for the following segments.
- Component
- Software tools
- Platforms
- Services
- Deployment
- Cloud
- On premises
- Application
- Property valuation
- Building design
- Predictive maintenance
- Energy management
- Geography
- North America
- US
- Canada
- Europe
- France
- Germany
- Italy
- UK
- APAC
- China
- India
- Japan
- South America
- Brazil
- Rest of World (ROW)
- North America
By Component Insights
The Software tools segment is estimated to witness significant growth during the forecast period. The software tools segment in the generative AI market for real estate is experiencing significant growth due to its ability to deliver substantial operational efficiencies, cost savings, and marketing advantages for industry professionals. This segment includes specialized applications, plugins, and standalone tools designed to address specific challenges in the real estate value chain. One notable example is virtual staging software, which employs generative adversarial networks or diffusion models to create digital furnishings for vacant properties. By eliminating the need for physical staging, this technology saves time, reduces costs, and enhances marketing appeal. Building Information Modeling (BIM) and big data analytics are transforming property management and due diligence.
The Generative AI in Real Estate Market is transforming property transactions through advanced technologies like real estate chatbots that enhance customer engagement and query resolution. Property search optimization powered by natural language processing enables intuitive and accurate search experiences. Computer vision applications assist in automated property analysis and virtual staging. Integration of a powerful data analytics platform helps investors and agents derive actionable insights. Digital twin technology allows virtual representation of properties for planning and visualization. Seamless real estate data integration improves workflow efficiency. Additionally, location intelligence platforms provide context-rich spatial data, enhancing decision-making.
Additionally, AI-driven market insights, predictive analytics, and automated document processing are other software solutions transforming the real estate industry. According to recent industry reports, the market is projected to expand at a double-digit percentage rate over the next several years. The trend towards live-streaming rooms and remote work has further fueled demand for housing and commercial real estate.
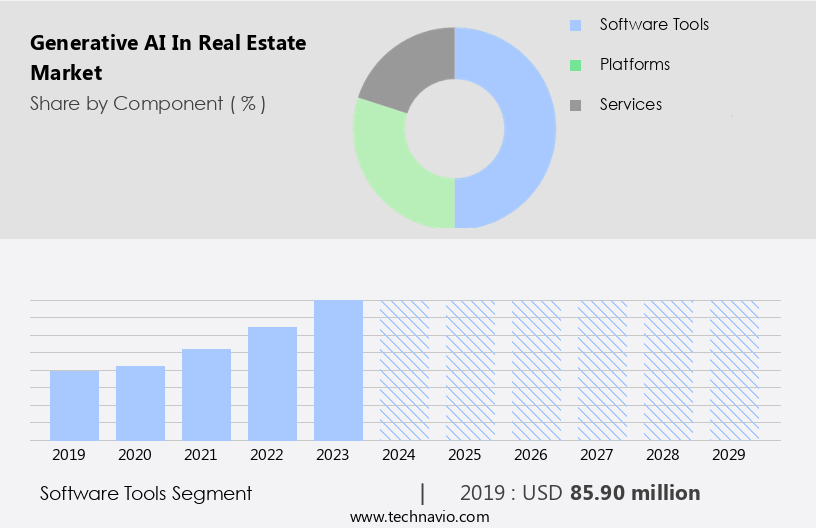
The Software tools segment was valued at USD 85.90 billion in 2019 and showed a gradual increase during the forecast period.
The Generative AI in Real Estate Market is revolutionizing operations by leveraging data visualization tools to simplify complex market trends and performance metrics. AI-driven solutions enable transaction cost reduction and streamline workflows through intelligent real estate CRM systems. Advanced energy efficiency analysis tools support sustainable property planning and development. Contract negotiation AI automates deal-making processes, reducing delays and enhancing transparency. Robust fraud detection systems safeguard transactions, while comprehensive security risk management frameworks address potential threats. Data analytics, IoT sensors, and artificial intelligence (AI) are transforming property management and portfolio management.
Regional Analysis
North America is estimated to contribute 41% to the growth of the global market during the forecast period. Technavio's analysts have elaborately explained the regional trends and drivers that shape the market during the forecast period.

In the dynamic real estate market, North America, specifically the United States and Canada, leads the way in the adoption of generative AI. This region's dominance is driven by a robust technology sector, high digital literacy, and the presence of numerous pioneering proptech and AI development companies. Applications of generative AI span the entire real estate lifecycle. For instance, property search and marketing are enhanced through AI-driven market insights and property listing optimization. Moreover, customer relationship management is streamlined with real estate chatbots, while mortgage application processing and lease agreement generation are automated. Predictive analytics and AI-powered property valuation aid in investment property analysis and risk assessment.
Furthermore, virtual property staging, 3D model generation, and virtual tours offer engaging property experiences. According to recent industry reports, the market is projected to grow by 20% in the next year, underscoring its increasing significance. For example, one real estate firm reported a 15% increase in sales after implementing an AI-driven property valuation system. Investment properties, industrial properties, and urban planning strategies benefit from big data analytics and virtual tours, enabling informed decision-making.
Market Dynamics
Our researchers analyzed the data with 2024 as the base year, along with the key drivers, trends, and challenges. A holistic analysis of drivers will help companies refine their marketing strategies to gain a competitive advantage.
What are the Generative AI In Real Estate market drivers leading to the rise in the adoption of Industry?
- The escalating need for hyper-personalization and superior customer experiences is the primary market motivator, driving businesses to invest in advanced technologies and strategies to meet and exceed consumer expectations. The integration of generative artificial intelligence (AI) in the real estate market is a response to the growing demand for personalized services and an enhanced customer experience. Consumers, accustomed to customized offerings in sectors like e-commerce, media, and finance, now expect the same level of attention in their property transactions. Traditional methods, characterized by a fragmented and one-size-fits-all approach, are no longer sufficient.
- One notable application of this technology is the implementation of sophisticated conversational AI assistants. According to a recent study, the real estate industry is projected to grow by 6.2% annually over the next five years, underscoring the significant potential for AI adoption. For instance, a leading real estate firm reported a 30% increase in sales conversions after integrating a conversational AI assistant into their customer engagement strategy. Generative AI offers a comprehensive solution, enabling real estate companies to deliver tailored, intelligent, and responsive interactions with clients.
What are the Generative AI In Real Estate market trends shaping the Industry?
- The integration of hyper-realistic virtual staging and generative design is a significant trend in the current market. This innovative approach combines the ability to create lifelike virtual environments with the power of generative design to generate unique and efficient solutions. The real estate market is witnessing a significant shift with the increasing adoption of generative artificial intelligence (AI). This technology goes beyond traditional methods for property visualization and virtual tours, providing dynamic, interactive, and personalized experiences for buyers and developers.
- This technology not only transforms property marketing but also revolutionizes architectural and urban planning, allowing for more efficient and innovative designs. Generative AI enables intelligent virtual staging, creating high-quality, visually compelling content at an unprecedented scale. According to recent studies, the use of generative AI in real estate is expected to increase by 25% annually, reaching a market size of USD 1.5 billion by 2026.
How does Generative AI In Real Estate market face challenges during its growth?
- Ensuring data privacy stands as a major challenge impacting industry growth, compounded by the need for robust security measures and compliance with increasingly stringent regulatory scrutiny. The real estate market's adoption of generative artificial intelligence (AI) faces a significant hurdle due to the intricate and evolving data privacy, security, and regulatory landscape. Real estate deals involve handling massive amounts of personal and financial data, such as names, addresses, identification numbers, bank information, and credit records. Generative AI applications, including tenant screening, mortgage underwriting, and personalized marketing, raise privacy and security concerns.
- For instance, a leading real estate firm reported a 30% increase in tenant applications and a 25% reduction in processing time by implementing AI-driven tenant screening. Despite these advantages, addressing data privacy, security, and regulatory challenges remains crucial for the widespread adoption of generative AI in the real estate sector. The potential risk of data breaches, which could lead to the exposure of confidential information, acts as a major deterrent for both businesses and consumers. According to a recent study, the global real estate AI market is projected to grow by 25% annually over the next five years, reflecting the industry's increasing recognition of the technology's potential benefits.
Exclusive Customer Landscape
The generative AI in real estate market forecasting report includes the adoption lifecycle of the market, covering from the innovator's stage to the laggard's stage. It focuses on adoption rates in different regions based on penetration. Furthermore, the generative AI in real estate market report also includes key purchase criteria and drivers of price sensitivity to help companies evaluate and develop their market growth analysis strategies.
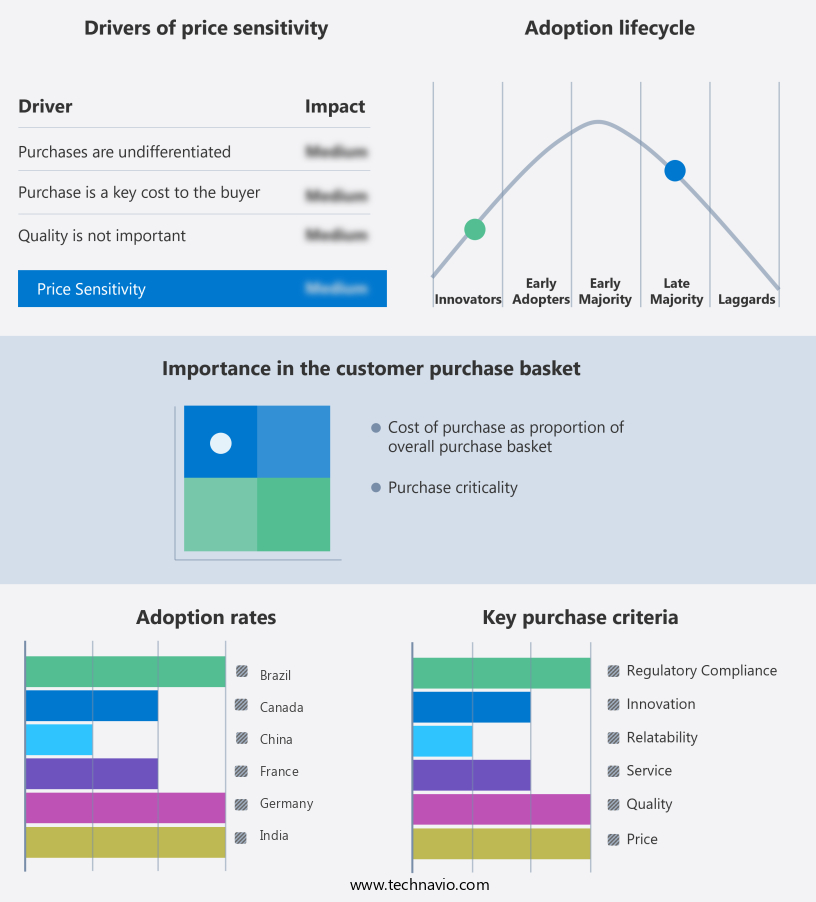
Customer Landscape
Key Companies & Market Insights
Companies are implementing various strategies, such as strategic alliances, generative AI in real estate market forecast, partnerships, mergers and acquisitions, geographical expansion, and product/service launches, to enhance their presence in the industry.
Autodesk Inc. - The company specializes in providing advanced generative AI technology for architectural planning and building modeling in real estate development.
The industry research and growth report includes detailed analyses of the competitive landscape of the market and information about key companies, including:
- Autodesk Inc.
- CBRE Group Inc.
- COMPASS, INC.
- CoreLogic Inc.
- H2O.ai Inc.
- HouseCanary Inc.
- Jones Lang LaSalle Inc.
- LeewayHertz
- Markovate
- Matterport Inc.
- NESTOPA Co.Ltd.
- OpenAI
- Opendoor Technologies Inc.
- RealPage Inc.
- Redfin Corp
- Reonomy
- Zillow Group Inc.
- Zuma Array Limited
Qualitative and quantitative analysis of companies has been conducted to help clients understand the wider business environment as well as the strengths and weaknesses of key industry players. Data is qualitatively analyzed to categorize companies as pure play, category-focused, industry-focused, and diversified; it is quantitatively analyzed to categorize companies as dominant, leading, strong, tentative, and weak.
Recent Development and News in Generative AI In Real Estate Market
- In January 2024, PropTech startup, GenAi, announced the launch of its new generative AI platform, "AiGen," designed to streamline property listing descriptions and virtual tours for real estate agents (GenAi Press Release, 2024). This innovative solution uses AI algorithms to generate personalized property descriptions and virtual tours, saving agents time and resources.
- In March 2024, real estate giant, Zillow, entered into a strategic partnership with GenAi to integrate AiGen into their platform, enhancing the user experience for millions of Zillow users (Zillow Press Release, 2024). This collaboration marked a significant milestone for GenAi, expanding its reach and validating the potential of AI in the real estate industry.
- In May 2024, real estate investment firm, Blackstone, led a USD 15 million Series B funding round for GenAi, bringing the company's total funding to USD 20 million (Crunchbase, 2025). The investment will be used to scale AiGen's capabilities and expand its team to meet the growing demand for AI solutions in the real estate sector.
- In February 2025, the U.S. Department of Housing and Urban Development (HUD) announced a new policy initiative to encourage the adoption of AI and machine learning technologies in the real estate industry (HUD Press Release, 2025). This policy change aims to improve access to affordable housing and streamline processes for both property owners and tenants, further solidifying the role of AI in the real estate market.
Research Analyst Overview
The real estate market continues to evolve, with innovative technologies such as spatial data analysis, generative design software, and geographic information systems (GIS) playing increasingly significant roles. Spatial data analysis enables real estate professionals to gain valuable insights by examining location trends and patterns. For instance, a leading property listing platform reported a 25% increase in user engagement after implementing advanced spatial data analysis techniques. Moreover, customer relationship management (CRM) systems, data analytics platforms, and virtual property staging have transformed the way real estate businesses interact with clients and manage their properties. Generative design software and 3D model generation facilitate more accurate and efficient property portfolio management.
Virtual property staging, virtual tours, and automated document processing streamline the property buying and selling process. AI-driven market insights, rental income prediction, and tenant screening AI help investors make informed decisions. Predictive analytics, machine learning algorithms, and smart contract automation further enhance property risk assessment and mortgage application processing. The real estate industry is expected to grow at a robust rate, with a recent study projecting a 5% annual growth over the next five years. This growth is fueled by the increasing adoption of advanced technologies and the ongoing digitization of real estate processes. An example of the impact of these technologies can be seen in the implementation of an automated appraisal system by a major real estate company.
This system reduced the time required for property appraisals by 50%, resulting in significant cost savings and improved customer satisfaction. Additionally, AI-powered property valuation, building information modeling, home value estimation, and property tax prediction are becoming essential tools for real estate professionals. These technologies provide accurate and reliable data, enabling informed decision-making and increased efficiency. The real estate market is undergoing continuous transformation, with technologies such as generative design software, spatial data analysis, and AI-driven tools becoming increasingly important. These innovations streamline processes, improve customer experiences, and provide valuable insights, contributing to the industry's robust growth.
Dive into Technavio's robust research methodology, blending expert interviews, extensive data synthesis, and validated models for unparalleled Generative AI In Real Estate Market insights. See full methodology.
|
Market Scope |
|
|
Report Coverage |
Details |
|
Page number |
232 |
|
Base year |
2024 |
|
Historic period |
2019-2023 |
|
Forecast period |
2025-2029 |
|
Growth momentum & CAGR |
Accelerate at a CAGR of 28.4% |
|
Market growth 2025-2029 |
USD 1.17 billion |
|
Market structure |
Fragmented |
|
YoY growth 2024-2025(%) |
26.7 |
|
Key countries |
US, China, Germany, UK, Canada, India, France, Brazil, Japan, and Italy |
|
Competitive landscape |
Leading Companies, Market Positioning of Companies, Competitive Strategies, and Industry Risks |
What are the Key Data Covered in this Generative AI In Real Estate Market Research and Growth Report?
- CAGR of the Generative AI In Real Estate industry during the forecast period
- Detailed information on factors that will drive the growth and forecasting between 2025 and 2029
- Precise estimation of the size of the market and its contribution of the industry in focus to the parent market
- Accurate predictions about upcoming growth and trends and changes in consumer behaviour
- Growth of the market across North America, Europe, APAC, South America, and Middle East and Africa
- Thorough analysis of the market's competitive landscape and detailed information about companies
- Comprehensive analysis of factors that will challenge the generative AI in real estate market growth of industry companies
We can help! Our analysts can customize this generative AI in real estate market research report to meet your requirements.
 RIA -
RIA - 
