Graphene Battery Market Size 2024-2028
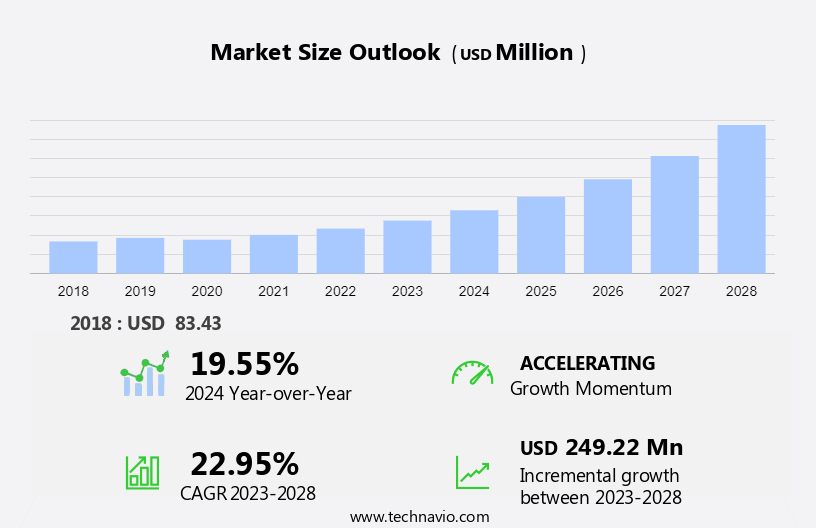
The graphene battery market size is forecast to increase by USD 249.22 million at a CAGR of 22.95% between 2023 and 2028.
- The market is experiencing significant growth due to several key factors. The increasing sales of passenger cars and the decline in lithium battery prices are major drivers propelling market expansion. Additionally, growing environmental concerns are pushing the demand for more eco-friendly energy storage solutions, making graphene batteries an attractive alternative. These trends are expected to continue, with the market poised for substantial growth in the coming years. Beyond consumer electronics, graphene batteries find applications in various sectors, including medical devices, military, aerospace, and renewable energy sources. However, challenges such as high production costs and a limited supply of high-quality graphene remain, which may hinder market progression. Despite these obstacles, the potential benefits of graphene batteries, including their superior energy density and faster charging capabilities, make them an intriguing prospect for the energy storage industry.
What will be the Size of the Market During the Forecast Period?
- Graphene, a single layer of carbon atoms arranged in a hexagonal lattice, has emerged as a promising material in various industries, including energy storage. The unique properties of graphene, such as high electrical conductivity, large surface area, and excellent thermal properties, make it an ideal candidate for developing advanced batteries. As the demand for high-performance batteries grows, advancements in battery management systems and battery charging efficiency are crucial for improving battery longevity and reducing battery cost, particularly in applications such as renewable energy storage. Strict battery safety regulations, evolving battery standards, and effective battery recycling methods are also essential to ensure compliance with battery regulations and to support the future of batteries, including innovations like lithium-titanate batteries.
- The consumer electronics industry is one of the primary sectors driving the demand for graphene batteries. With the increasing popularity of portable electronic devices, the need for high-performance and long-lasting batteries is paramount. Graphene batteries can cater to this demand by providing superior power density and faster charging capabilities. In medical devices, graphene batteries can power implantable devices for extended periods, ensuring patient comfort and safety. In military applications, they can provide reliable power sources for communication and surveillance equipment in harsh environments.
How is this market segmented and which is the largest segment?
The market research report provides comprehensive data (region-wise segment analysis), with forecasts and estimates in "USD million" for the period 2024-2028, as well as historical data from 2018-2022 for the following segments.
- Type
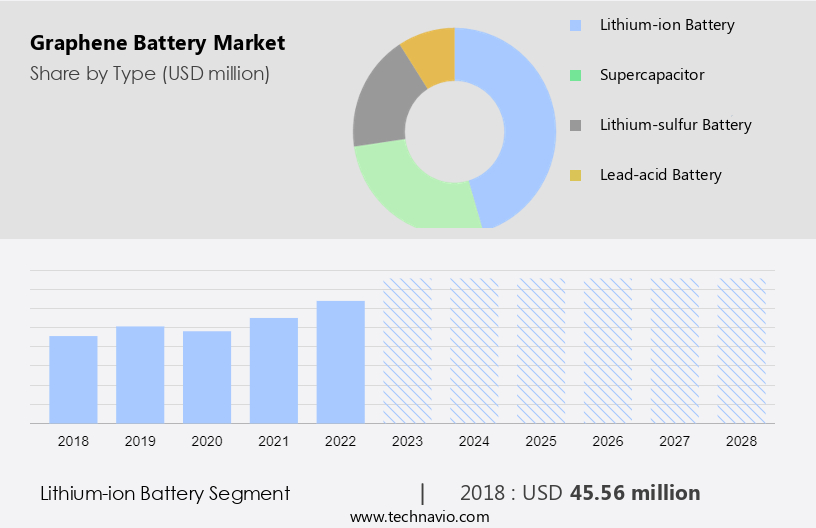
- Lithium-ion battery
- Supercapacitor
- Lithium-sulfur battery
- Lead-acid battery
- End-user
- Automotive
- Consumer electronics
- Energy and power
- Others
- Geography
- APAC
- China
- India
- Japan
- Europe
- Germany
- North America
- US
- South America
- Middle East and Africa
- APAC
By Type Insights
- The lithium-ion battery segment is estimated to witness significant growth during the forecast period.
The market for graphene batteries, specifically in the Li-ion segment, has experienced notable expansion in recent years. Li-ion batteries have emerged as the preferred power solution for both automotive applications and consumer electronics. Their high energy density, extended lifespan, and lightweight properties make them ideal for powering a wide range of devices. The increasing adoption of smart wearables, such as smartwatches, fitness trackers, and smart glasses, has driven the demand for Li-ion batteries in this sector. These portable devices necessitate dependable and long-lasting power sources to support their diverse features and capabilities. Li-ion batteries offer a significant advantage in terms of energy density.
Furthermore, they can store a substantial amount of energy in a compact and lightweight format. This makes them an excellent choice for powering devices that require extended battery life and minimal weight. Moreover, graphene supercapacitors, a promising alternative to traditional batteries, are expected to revolutionize the energy storage industry. These devices offer faster charging times and increased power density, making them suitable for use in various applications, including portable devices and electric vehicles. Additionally, the use of graphene coatings in batteries can enhance their chemical stability, further increasing their appeal. This technology is also being explored in the fields of life science and telecom, where reliable and efficient energy storage solutions are crucial.
Get a glance at the market report of share of various segments Request Free Sample
The lithium-ion battery segment was valued at USD 45.56 million in 2018 and showed a gradual increase during the forecast period.
Regional Analysis
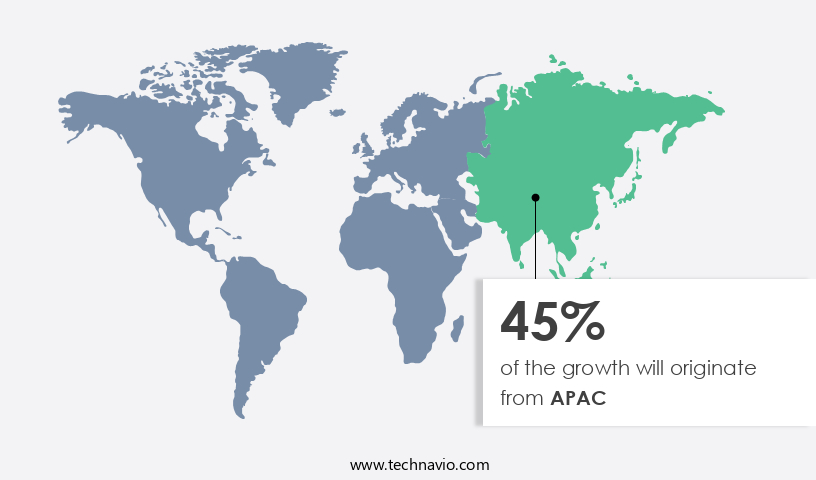
- APAC is estimated to contribute 45% to the growth of the global market during the forecast period.
Technavio's analysts have elaborately explained the regional trends and drivers that shape the market during the forecast period.
For more insights on the market share of various regions Request Free Sample
The market in North America is experiencing significant growth due to the increasing adoption of graphene batteries, particularly in the automotive sector. The demand for advanced energy storage solutions, such as lithium-sulfur batteries and lithium-ion batteries, is driving the market's expansion. Graphene's unique properties, including high conductivity, lightweight, and longevity, make it an ideal material for enhancing battery performance and increasing charge cycles. The automotive industry's shift towards electric and hybrid vehicles is a major factor contributing to the market's growth. In countries like the United States, Canada, and Mexico, the increasing focus on reducing carbon emissions and improving fuel efficiency is fueling the demand for graphene batteries.
Additionally, the growing trend of electrifying public transportation systems is expected to further boost the market's growth during the forecast period. China is a significant producer of graphene in the region, with the country being the largest consumer of graphene powder. Graphene powder is used in various applications, including battery conductive additives, lithium battery materials, and special coatings. Furthermore, graphene film is used for thermally conductive films, flexible displays, and sensors. As the demand for energy storage solutions continues to grow, the market in North America is poised for significant expansion.
Market Dynamics
Our researchers analyzed the data with 2023 as the base year, along with the key drivers, trends, and challenges. A holistic analysis of drivers will help companies refine their marketing strategies to gain a competitive advantage.
What are the key market drivers leading to the rise in the adoption of Graphene Battery Market?
The rise in sales of passenger cars is the key driver of the market.
- The market is experiencing significant growth due to the increasing demand for high-capacity batteries in various industries. Lithium-sulfur batteries, graphene supercapacitors, and lithium-ion batteries are among the types of batteries that are being researched and developed extensively using graphene technology. This advanced material offers several advantages, including longer battery life, faster charging times, and improved conductivity. Automotive applications, particularly in electric vehicles (EVs), represent a major market for graphene batteries. The automotive industry's shift towards sustainable solutions, driven by increasing environmental concerns and government regulations, is a key factor fueling the demand for graphene batteries.
Additionally, the lightweight and flexible nature of graphene batteries makes them ideal for use in aerospace, defense, and portable electronics. Graphene's high heat conductivity and chemical stability make it an excellent material for use in various industries, including energy storage, industrial robotics, and communication devices. Its large surface area and high energy output make it a promising solution for energy storage in renewable energy systems, water treatment, and sustainable solutions. Furthermore, the use of graphene composites and coatings in various applications, such as semiconductors and electronics, is expected to drive the market's growth. The longevity and charging capacity of graphene batteries are significant advantages over traditional batteries, such as lead-acid and lithium-ion batteries.
What are the market trends shaping the Graphene Battery Market?
The decline in lithium battery prices is the upcoming trend in the market.
- The global energy storage market is experiencing a significant shift towards advanced battery technologies, with lithium batteries gaining increasing popularity over traditional lead-acid batteries. Lithium batteries offer superior battery performance, longevity, and charging abilities, making them ideal for various applications, including electric vehicles, aerospace, defense, and portable electronics. Graphene battery technology, a promising advancement in the lithium battery space, is attracting significant attention due to its high energy output, faster charging times, and larger surface area. Graphene, a wonder material with a honeycomb lattice structure made of carbon atoms, possesses unique properties such as high conductivity, heat conductivity, and chemical stability.
These properties make graphene an excellent conductor for batteries, enabling faster charging times and longer battery life. Moreover, graphene batteries offer higher energy density, longer shelf life, and improved charging capacity compared to traditional lithium-ion batteries. The market for graphene batteries is expected to grow significantly during the forecast period, driven by the increasing demand for high-capacity batteries in various industries, including automotive, renewable energy, industrial robotics, and communication devices. Graphene technology is also being explored for sustainable solutions in areas such as water treatment, sustainable energy, and composites and coatings. Despite the high cost of graphene production, leading manufacturers are investing in research and development to reduce the cost and improve the scalability of graphene production.
What challenges does Graphene Battery Market face during its growth?
Growing environmental concerns regarding graphene batteries is a key challenge affecting the market growth.
- The market is experiencing significant growth due to the increasing demand for high-performance, eco-friendly energy storage solutions. Traditional batteries, such as lead acid and lithium-ion, have limitations in terms of longevity, charging capacity, and charging time. Graphene batteries, with their unique properties, offer potential solutions to these challenges. Graphene, a wonder material known for its honeycomb lattice structure and large surface area, exhibits excellent conductivity, heat conductivity, and mechanical qualities. These properties make graphene an ideal material for the development of high-capacity batteries, including lithium-sulfur and metal-air batteries. The automotive, aerospace, defense, telecom, and healthcare industries are expected to drive the demand for graphene batteries due to their lightweight nature, faster charging times, and longer shelf life.
- Graphene batteries also offer sustainable solutions for various applications, such as renewable energy, water treatment, and portable electronics. However, the high temperatures required for the production of graphene and the chemical stability of graphene batteries are challenges that need to be addressed. Research and development in the field of graphene technology is ongoing, with a focus on improving the scalability and affordability of graphene production. The potential applications of graphene batteries in electric vehicles, portable chargers, smartphones, laptops, and semiconductors & electronics are vast, making it an exciting area of scientific research. As the world moves towards sustainable energy solutions, the demand for graphene batteries is expected to grow, offering opportunities for businesses and investors in this emerging market.
Exclusive Customer Landscape
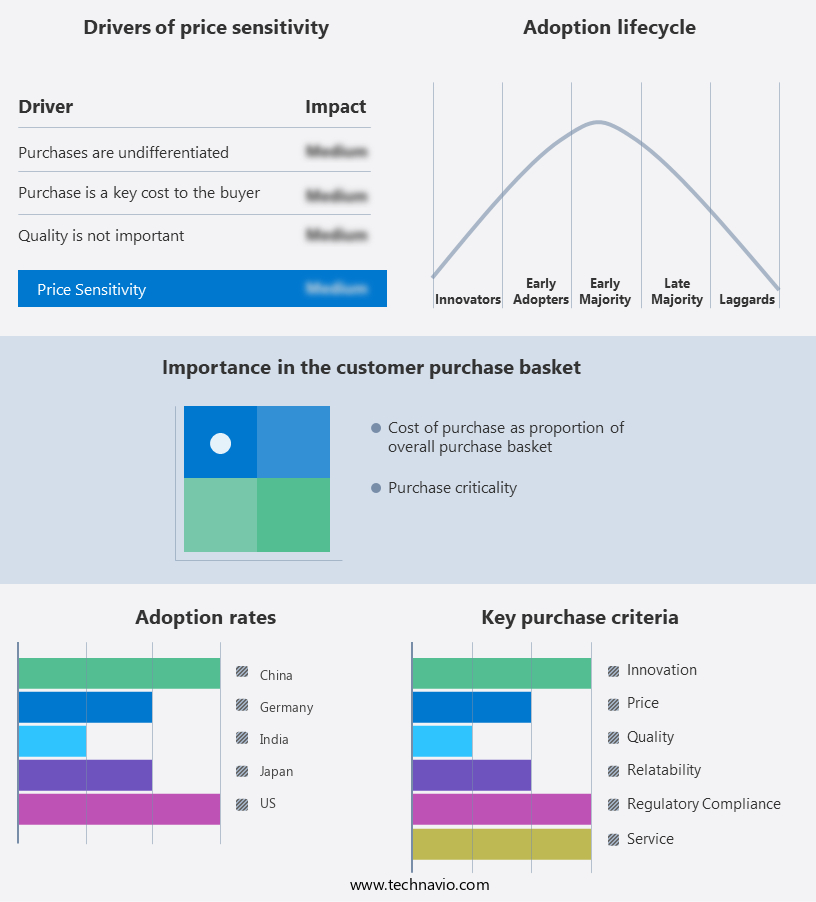
The market forecasting report includes the adoption lifecycle of the market, covering from the innovator's stage to the laggard's stage. It focuses on adoption rates in different regions based on penetration. Furthermore, the market report also includes key purchase criteria and drivers of price sensitivity to help companies evaluate and develop their market growth analysis strategies.
Customer Landscape
Key Companies & Market Insights
Companies are implementing various strategies, such as strategic alliances, market forecast, partnerships, mergers and acquisitions, geographical expansion, and product/service launches, to enhance their presence in the market.
The market research and growth report includes detailed analyses of the competitive landscape of the market and information about key companies, including:
- Cabot Corp.
- Global Graphene Group
- Graphenano Group
- Hybrid Kinetic Group Ltd.
- Log9 Materials
- Nanotech Energy
Qualitative and quantitative analysis of companies has been conducted to help clients understand the wider business environment as well as the strengths and weaknesses of key market players. Data is qualitatively analyzed to categorize companies as pure play, category-focused, industry-focused, and diversified; it is quantitatively analyzed to categorize companies as dominant, leading, strong, tentative, and weak.
Research Analyst Overview
The market is witnessing a significant shift towards advanced technologies that offer higher energy density, longer cycle life, and faster charging capabilities. Among these emerging technologies, graphene batteries have gained immense attention due to their unique properties and potential to revolutionize various industries. Graphene, a wonder material known for its honeycomb lattice structure, exhibits exceptional conductivity, mechanical qualities, and high surface area. These properties make it an ideal material for manufacturing high-capacity batteries with improved charging abilities and longer shelf life. Compared to traditional lead-acid and lithium-ion batteries, graphene batteries offer several advantages.
Furthermore, they are lightweight, flexible, and can operate at high temperatures, making them suitable for applications in automotive, aerospace, defense, and portable electronics. In the automotive sector, the demand for longer driving ranges and faster charging times is driving the adoption of graphene batteries in electric vehicles. These batteries can store more energy per unit weight, leading to increased driving range and reduced charging time. Furthermore, their durability and chemical stability make them an attractive option for the automotive industry. The aerospace and defense industries also stand to benefit from graphene batteries due to their high energy output and lightweight nature.
|
Market Scope |
|
|
Report Coverage |
Details |
|
Page number |
143 |
|
Base year |
2023 |
|
Historic period |
2018-2022 |
|
Forecast period |
2024-2028 |
|
Growth momentum & CAGR |
Accelerate at a CAGR of 22.95% |
|
Market Growth 2024-2028 |
USD 249.22 million |
|
Market structure |
Concentrated |
|
YoY growth 2023-2024(%) |
19.55 |
|
Key countries |
US, China, Japan, India, and Germany |
|
Competitive landscape |
Leading Companies, Market Positioning of Companies, Competitive Strategies, and Industry Risks |
What are the Key Data Covered in this Market Research and Growth Report?
- CAGR of the market during the forecast period
- Detailed information on factors that will drive the market growth and forecasting between 2024 and 2028
- Precise estimation of the size of the market and its contribution of the market in focus to the parent market
- Accurate predictions about upcoming market growth and trends and changes in consumer behaviour
- Growth of the market across APAC, Europe, North America, South America, and Middle East and Africa
- Thorough analysis of the market's competitive landscape and detailed information about companies
- Comprehensive analysis of factors that will challenge the growth of market companies
We can help! Our analysts can customize this market research report to meet your requirements. Get in touch
 RIA -
RIA - 
