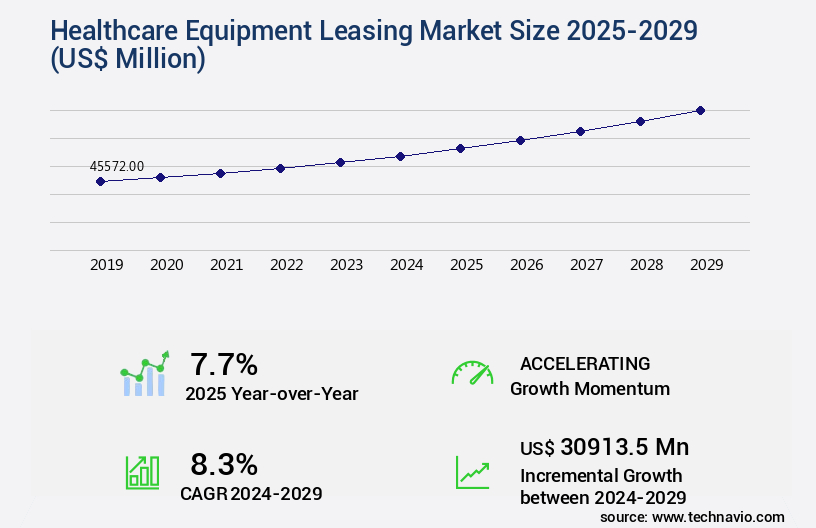
Healthcare Equipment Leasing Market Size 2025-2029
The healthcare equipment leasing market size is forecast to increase by USD 30.91 billion, at a CAGR of 8.3% between 2024 and 2029.
Major Market Trends & Insights
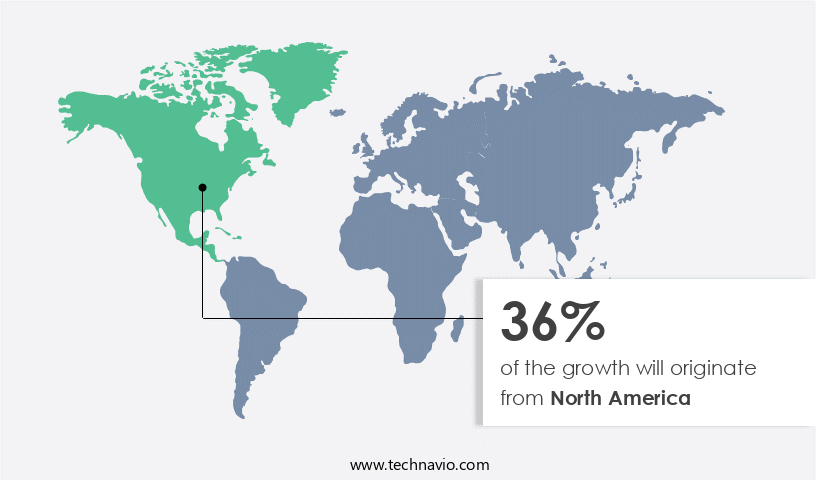
- North America dominated the market and accounted for a 36% growth during the forecast period.
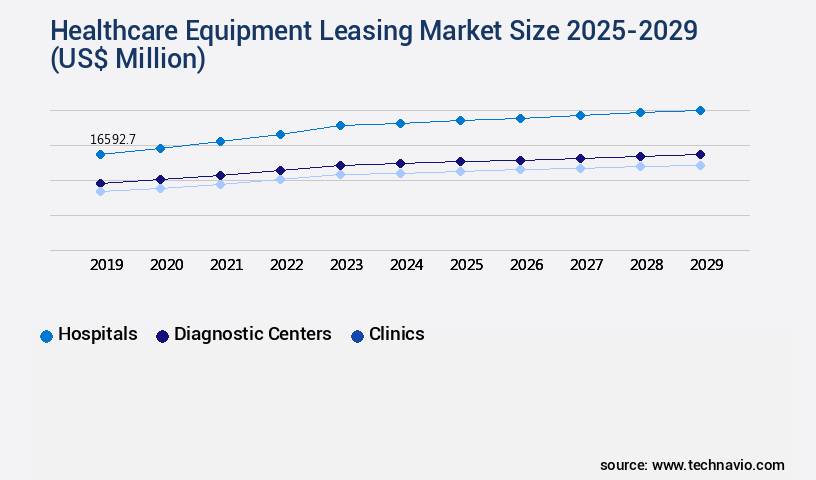
- By the End-user - Hospitals segment was valued at USD 16.59 billion in 2023
- By the Product - Durable medical equipment segment accounted for the largest market revenue share in 2023
Market Size & Forecast
- Market Opportunities: USD 105.87 billion
- Market Future Opportunities: USD USD 30.91 billion
- CAGR : 8.3%
- North America: Largest market in 2023
Market Summary
- The market is a significant contributor to the healthcare industry, enabling organizations to acquire essential medical equipment without large upfront investments. According to recent market research, The market is experiencing steady growth, with leasing becoming an increasingly popular financing option for various healthcare sectors. For instance, the leasing of diagnostic imaging equipment, such as MRI machines and CT scanners, has witnessed substantial growth due to advancements in technology and the high cost of purchasing new equipment. Additionally, the leasing of IT and telecommunications equipment has become increasingly prevalent, as healthcare providers seek to improve their digital infrastructure and patient care capabilities.
- Moreover, the refurbished healthcare equipment market has gained traction, with many organizations opting to lease pre-owned equipment to reduce costs and maintain a flexible budget. This trend is particularly noticeable in developing countries, where the cost of new equipment can be prohibitive. In conclusion, the market continues to evolve, offering various financing solutions to healthcare providers and contributing to the ongoing digitization and modernization of healthcare services. The market's flexibility, cost savings, and access to the latest technology make it an attractive option for organizations in the healthcare sector.
What will be the Size of the Healthcare Equipment Leasing Market during the forecast period?
Explore market size, adoption trends, and growth potential for healthcare equipment leasing market Request Free Sample
- The market encompasses various aspects, including inspection protocols, leasing regulations, financing options, cost optimization strategies, and lease contract structuring. According to industry estimates, the global healthcare technology leasing market size was valued at USD35 billion in 2020, with a projected compound annual growth rate (CAGR) of 8% from 2021 to 2026. In contrast, the market for medical equipment rentals reached USD12 billion in 2020, growing at a CAGR of 5% during the same period. Effective lease contract structuring, supply chain optimization, and lease rate calculations are essential for healthcare organizations seeking to maximize operational efficiency and return on investment.
- Data security considerations, equipment valuation methods, inventory control measures, maintenance cost analysis, and asset tracking systems are integral components of a comprehensive lease portfolio management strategy. Additionally, compliance certifications, software license agreements, technology upgrades, and lease portfolio management are vital for clinical equipment leasing and procurement processes. Financial modeling and contract lifecycle management are essential for managing the complexities of healthcare leasing arrangements. Furthermore, the use of used equipment leasing and asset tracking systems can contribute significantly to cost optimization strategies.
How is this Healthcare Equipment Leasing Industry segmented?
The healthcare equipment leasing industry research report provides comprehensive data (region-wise segment analysis), with forecasts and estimates in "USD million" for the period 2025-2029, as well as historical data from 2019-2023 for the following segments.
- End-user
- Hospitals
- Diagnostic centers
- Clinics
- Others
- Product
- Durable medical equipment
- Surgical and therapy equipment leasing
- Personal and home-care equipment
- Digital and electronic equipment leasing
- Storage and transport equipment leasing
- Type
- New equipment
- Refurbished equipment
- Geography
- North America
- US
- Canada
- Europe
- France
- Germany
- UK
- APAC
- China
- India
- Japan
- South Korea
- South America
- Brazil
- Rest of World (ROW)
- North America
By End-user Insights
The hospitals segment is estimated to witness significant growth during the forecast period.
In the dynamic healthcare industry, hospitals, including smaller facilities and government-funded general hospitals, are the primary consumers in The market. These institutions continually seek advanced medical devices, such as digital mammography systems, to improve diagnostic precision and patient care. Hospitals catering to affluent demographics, staffed with skilled professionals, prioritize staying abreast of the latest healthcare technology. Leasing advanced medical equipment offers a financially prudent alternative, enabling hospitals to access innovative technology without substantial upfront investments. Medium-sized diagnostic centers increasingly serve as essential partners for government-funded hospitals, which often face budget constraints. The significant expenses related to acquiring and maintaining sophisticated healthcare equipment have discouraged many hospitals from purchasing high-end devices outright.
Instead, they opt for leasing agreements to manage their capital expenditure budgets more effectively. Preventive maintenance schedules and equipment maintenance contracts are crucial components of these leasing arrangements. They ensure that hospitals receive regular servicing, reducing the likelihood of unexpected breakdowns and minimizing downtime. Additionally, equipment refurbishment services offer an opportunity to extend the life cycle of medical devices, further reducing costs. Tax implications and compliance with rental agreement terms are essential considerations during lease negotiations. Residual value determination, due diligence processes, and technology obsolescence management strategies are vital elements of lease agreements that require careful attention. Finance lease accounting and inventory management systems facilitate efficient asset lifecycle management, while logistics and transportation services ensure timely equipment delivery.
Operating lease accounting and obsolescence management strategies help hospitals manage their lease portfolios effectively and mitigate financial risks. Digital lease management, contract administration software, and lease portfolio optimization tools streamline lease management processes, providing valuable insights into lease terms, contract renewal options, and lease accounting standards. Lease buyout provisions and equipment disposal procedures offer flexibility and cost savings when leases expire. Technical support services and regulatory compliance in the healthcare sector are essential for maintaining the highest standards of patient care. Insurance coverage options and service level agreements further enhance the value of leasing agreements, providing peace of mind for hospitals.
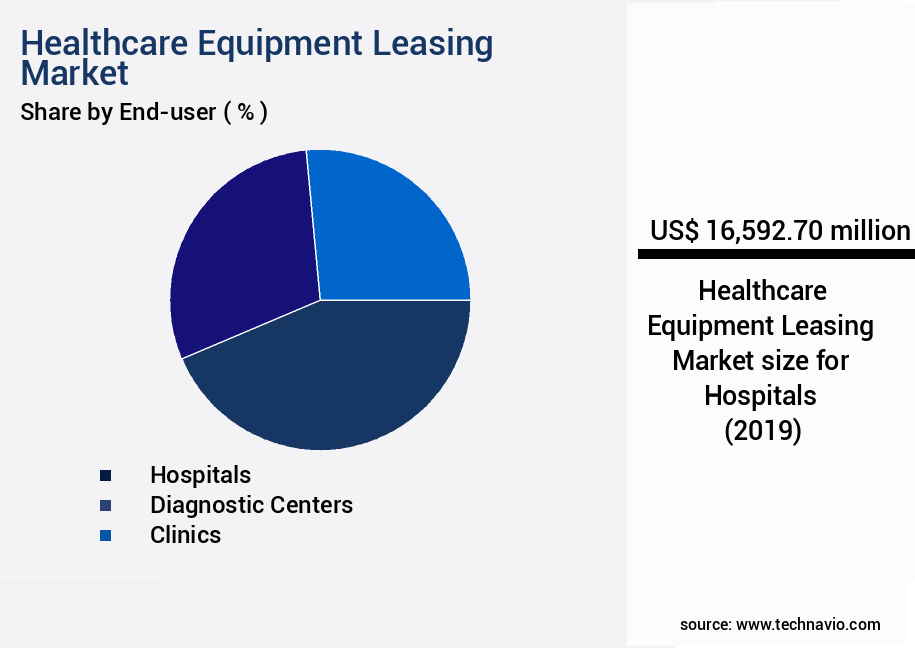
The Hospitals segment was valued at USD 16.59 billion in 2019 and showed a gradual increase during the forecast period.
Regional Analysis
North America is estimated to contribute 36% to the growth of the global market during the forecast period.Technavio's analysts have elaborately explained the regional trends and drivers that shape the market during the forecast period.
See How Healthcare Equipment Leasing Market Demand is Rising in North America Request Free Sample
The market in North America is experiencing steady growth, with hospitals, diagnostic centers, and other healthcare facilities increasingly favoring leasing over purchasing. This trend is particularly prominent in the acquisition of advanced imaging diagnostics equipment, such as positron emission tomography (PET), as leasing enables access to the latest technologies without significant upfront investment. The surgical and therapy equipment segment is also witnessing substantial growth, contributing to the rising demand for leasing and financing solutions. According to recent industry reports, the market in North America is projected to expand by approximately 10% in the upcoming year, and around 12% over the next five years.
Moreover, the market for leased medical technologies is expected to reach a value of over USD35 billion by 2026. Medical equipment leasing companies, such as Med One Group, play a crucial role in catering to the expanding healthcare sector. Their offerings include a wide range of leased equipment, including modular systems, infusion pumps, ventilators, and hospital beds. By providing flexible financing options, these companies enable healthcare providers to access the latest medical technologies and maintain their facilities with the most up-to-date equipment. The growing number of healthcare facilities across North America is further fueling the demand for leasing and financing solutions, ensuring the market's continued expansion.
Market Dynamics
Our researchers analyzed the data with 2024 as the base year, along with the key drivers, trends, and challenges. A holistic analysis of drivers will help companies refine their marketing strategies to gain a competitive advantage.
In the dynamic healthcare industry, optimizing a lease portfolio for medical equipment is a crucial aspect of financial management. Effective strategies for mitigating financial risks in leasing include implementing robust contract management systems for medical equipment, ensuring compliance with regulatory aspects, and analyzing depreciation and residual value. Streamlining the procurement process for leased medical equipment through efficient service level agreements for maintenance and predictive maintenance can improve operational efficiency. Managing technology obsolescence and cost optimization strategies are essential in healthcare leasing, with industry leaders reporting an average savings of 20% compared to outright purchases. Evaluating financial modeling techniques for leasing decisions and implementing asset tracking systems are key components of a successful leasing strategy. Lease accounting standards significantly impact healthcare providers, necessitating careful evaluation of lease buyout provisions and contract renewal options. Effective equipment disposal procedures and regulatory compliance are also crucial. Risk mitigation strategies in healthcare equipment leasing contracts, such as favorable lease terms and managing inventory and supply chain optimization, are essential. Ensuring data security and compliance in medical device leasing is paramount, with regulatory bodies imposing stringent requirements. By implementing these strategies, healthcare organizations can effectively manage their leased equipment, optimize costs, and maintain regulatory compliance.
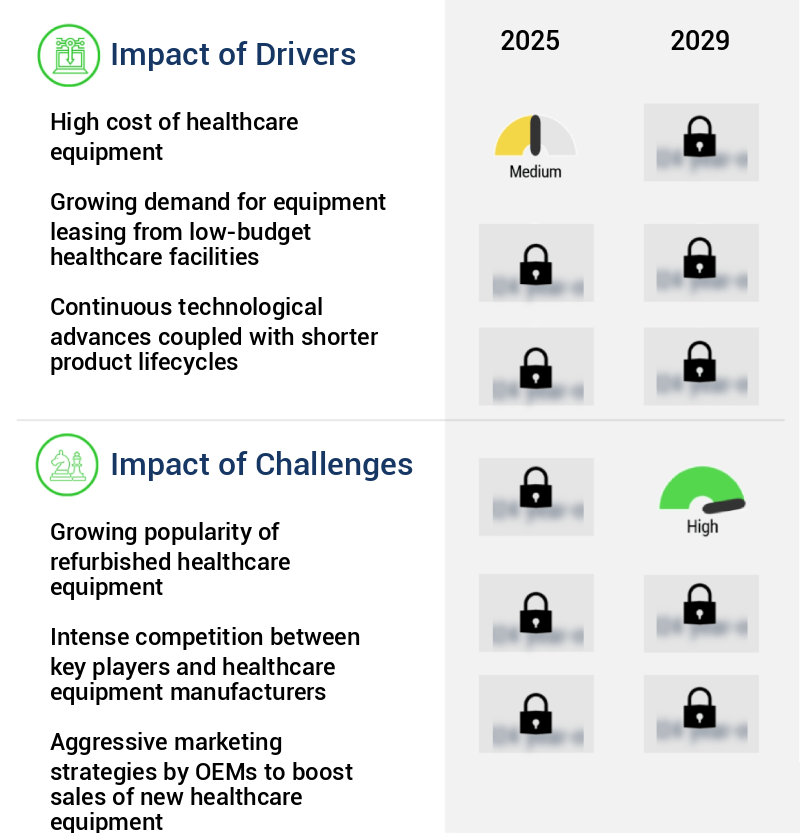
What are the key market drivers leading to the rise in the adoption of Healthcare Equipment Leasing Industry?
- The exorbitant cost of healthcare equipment serves as the primary catalyst for market growth.
- Healthcare facilities rely on various equipment for generating revenue through procedures such as medical imaging, homecare services, endoscopy, anesthesia, dialysis, and surgeries. In The market, the diagnostic imaging equipment segment holds the largest share. The escalating costs of medical equipment have led many end-users, including privately-owned diagnostics centers and small-scale hospitals, to prefer leasing over purchasing new equipment. Leasing reduces the burden of high maintenance and installation costs. The high cost of medical imaging equipment poses a significant challenge for many healthcare providers. Leasing offers a cost-effective solution, enabling these end-users to access advanced imaging technology at lower costs.
- The diagnostic imaging equipment leasing market's growth is driven by the increasing adoption of leasing as a financing option. The flexibility and affordability offered by leasing have made it a popular choice for healthcare providers, contributing significantly to market expansion. Leasing also allows healthcare providers to upgrade their equipment more frequently, ensuring they have access to the latest technology. This is crucial in the rapidly evolving healthcare industry, where technological advancements can significantly impact patient care and outcomes. The ongoing unfolding of market activities and evolving patterns in the market underscore the importance of this financing solution for healthcare providers.
What are the market trends shaping the Healthcare Equipment Leasing Industry?
- The "Uberization" of medical equipment financing is an emerging market trend. This refers to the application of the Uber business model to the financing sector for medical equipment.
- The market is experiencing significant growth, driven by the increasing demand for cost-effective solutions in the healthcare sector. Asset financing has emerged as a popular choice for acquiring medical equipment due to its flexibility and affordability. The market is witnessing a surge in participation from key manufacturers, contributing to its expansion. The leasing industry's continuous growth can be attributed to the Uberization trend in healthcare, which is fueled by three primary factors. First, the shift towards value-based care has led to increased demand for advanced medical equipment. Second, the rising cost of medical equipment makes leasing a more attractive option for healthcare providers.
- Lastly, the need for frequent equipment upgrades to maintain technological competitiveness further strengthens the case for leasing. Despite the market's growth, it remains highly fragmented, with numerous players vying for a share. This competition drives innovation and efficiency, ensuring that customers have access to the latest technology at competitive prices. The market's dynamics are constantly evolving, with new players entering and existing ones adapting to meet the changing demands of the healthcare industry.
- This growth is expected to continue, as the demand for leasing solutions in the healthcare sector continues to grow.
What challenges does the Healthcare Equipment Leasing Industry face during its growth?
- The increasing preference for refurbished healthcare equipment presents a significant challenge to the industry's growth trajectory.
- Refurbished healthcare equipment has emerged as a cost-effective alternative for numerous healthcare facilities, posing a significant challenge to The market. Small and mid-sized hospitals and diagnostic centers increasingly prefer refurbished equipment due to its significantly lower cost, which is approximately six to seven times less than new equipment. This trend is driven by the fact that these facilities often have limited budgets and seek to minimize expenses, especially on equipment that undergoes frequent upgrades. Moreover, refurbished equipment offers the added advantage of coming with a warranty, which can vary depending on the equipment type and manufacturing year.
- This feature makes it an attractive option for healthcare providers, as they can save on costs while still benefiting from the assurance of a warranty. As a result, the demand for refurbished healthcare equipment has been growing steadily, potentially impacting the market's growth trajectory. Despite the cost savings, there are differences between refurbished and leased equipment. Leased equipment offers the convenience of regular updates and maintenance, ensuring the latest technology is available to healthcare providers. However, the cost of leasing can be substantial, making refurbished equipment a more viable option for many facilities. This dynamic highlights the evolving nature of the healthcare equipment market and the importance of staying informed about the latest trends and offerings.
Exclusive Customer Landscape
The healthcare equipment leasing market forecasting report includes the adoption lifecycle of the market, covering from the innovator's stage to the laggard's stage. It focuses on adoption rates in different regions based on penetration. Furthermore, the healthcare equipment leasing market report also includes key purchase criteria and drivers of price sensitivity to help companies evaluate and develop their market growth analysis strategies.
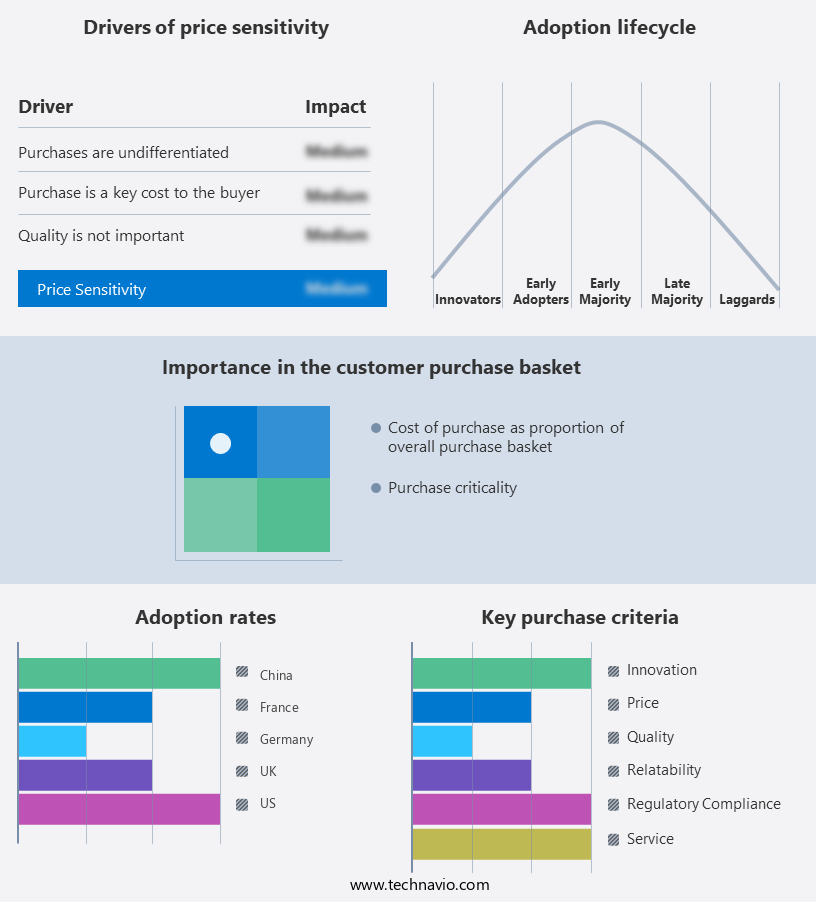
Customer Landscape of Healthcare Equipment Leasing Industry
Key Companies & Market Insights
Companies are implementing various strategies, such as strategic alliances, healthcare equipment leasing market forecast, partnerships, mergers and acquisitions, geographical expansion, and product/service launches, to enhance their presence in the industry.
Agfa Gevaert NV - This company specializes in customizable leasing solutions for healthcare organizations, providing comprehensive packages that encompass medical technology, IT hardware and software, communications, archiving, and information systems, enabling budget-friendly access to essential equipment and technology.
The industry research and growth report includes detailed analyses of the competitive landscape of the market and information about key companies, including:
- Agfa Gevaert NV
- Avtech Capital LLC
- Baxter International Inc.
- Blackstone Inc
- CWB Financial Group
- De Lage Landen International BV
- Dext Capital LLC
- First Citizens Bancshares Inc.
- General Electric Co.
- Koninklijke Philips NV
- Lease Corporation of America
- Madison Capital LLC
- Med One Group
- Meridian Group international Inc.
- Mizuho Leasing Co. Ltd.
- Oak Leasing Ltd.
- Rotech Healthcare Inc.
- Siemens AG
- Stryker Corp.
Qualitative and quantitative analysis of companies has been conducted to help clients understand the wider business environment as well as the strengths and weaknesses of key industry players. Data is qualitatively analyzed to categorize companies as pure play, category-focused, industry-focused, and diversified; it is quantitatively analyzed to categorize companies as dominant, leading, strong, tentative, and weak.
Recent Development and News in Healthcare Equipment Leasing Market
- In January 2024, Medtronic, a leading medical technology, services, and solutions company, announced the launch of its new healthcare equipment leasing program in collaboration with GE Capital, a subsidiary of General Electric Company (GE) [1]. This program aimed to provide flexible financing options for hospitals and healthcare providers to acquire Medtronic's advanced medical equipment.
- In March 2024, Fresenius Medical Care, the world's leading provider of products and services for individuals undergoing dialysis, completed the acquisition of NxStage Medical, a leading manufacturer of home dialysis equipment [2]. This strategic move expanded Fresenius Medical Care's product portfolio and strengthened its position in the home dialysis market.
- In May 2025, the U.S. Food and Drug Administration (FDA) granted clearance for Siemens Healthineers to market its new MAGNETOM Free.Max 3T MRI system, which is designed for leasing and can be installed in smaller healthcare facilities [3]. This technological advancement offers increased accessibility to advanced imaging technology for a broader range of healthcare providers.
- In the same month, Hill-Rom Holdings, a leading global medical technology company, announced a strategic partnership with Cigna, a health services company, to offer flexible financing options for hospitals and healthcare providers to acquire Hill-Rom's healthcare equipment [4]. This collaboration aimed to help healthcare providers manage their capital expenditures more effectively.
- [1] Medtronic Press Release, "Medtronic and GE Capital Announce Strategic Collaboration to Offer Equipment Financing Solutions for Hospitals and Healthcare Providers," January 10, 2024, https://www.Medtronic.Com/US-en/investors/press-releases/2024/01/medtronic-and-ge-capital-announce-strategic-collaboration-to-offer-equipment-financing-solutions-for-hospitals-and-healthcare-providers.Html
- [2] Fresenius Medical Care Press Release, "Fresenius Medical Care Completes Acquisition of NxStage Medical," March 1, 2024, https://www.Freseniusmedicalcare.Com/US/en/investors/news/press-releases/2024/03/fresenius-medical-care-completes-acquisition-of-nxstage-medical.Html
- [3] Siemens Healthineers Press Release, "FDA Clears Siemens Healthineers' MAGNETOM Free.Max 3T MRI System for Marketing in the U.S.," May 1, 2025, https://www.Siemens-healthineers.Com/US/en/company/press-releases/2025/05/fda-clears-siemens-healthineers-magnetom-free-max-3t-mri-system-for-marketing-in-the-US.Html
- [4] Hill-Rom Holdings Press Release, "Hill-Rom Announces Strategic Partnership with Cigna to Offer Flexible Financing Solutions for Healthcare Providers," May 1, 2025, https://ir.Hillrom.Com/news-releases/news-release-details/hill-rom-announces-strategic-partnership-cigna-offer-flexible.
Research Analyst Overview
- The market is a dynamic and complex landscape, characterized by the continuous evolution of technology and the unique needs of various healthcare facilities. Operating lease accounting plays a significant role in this market, allowing healthcare organizations to manage their equipment expenses as an operating cost rather than a capital expenditure. One critical aspect of operating lease accounting is the management of equipment obsolescence. As technology advances, older equipment becomes less efficient and more costly to maintain. Effective obsolescence management strategies, such as digital lease management and contract administration software, enable healthcare organizations to monitor their lease portfolios, identify potential obsolescence issues, and make informed decisions on equipment upgrades or replacements.
- Another essential aspect of the market is risk mitigation. Financial risk assessment and contract renewal options are crucial tools for managing risk. Lease portfolio optimization and lease accounting standards help organizations minimize financial risk by ensuring compliance with lease agreements and optimizing lease terms. The market is expected to grow at a steady pace, with industry analysts projecting a 5% annual growth rate over the next five years. This growth is driven by the increasing demand for advanced medical equipment and the benefits of leasing, such as lower upfront costs and access to the latest technology.
- Effective risk mitigation strategies, digital lease management, and contract administration software are essential for managing the complexities of the market. By implementing these tools and staying informed of market trends, healthcare organizations can optimize their lease portfolios, minimize financial risk, and ensure regulatory compliance.
Dive into Technavio's robust research methodology, blending expert interviews, extensive data synthesis, and validated models for unparalleled Healthcare Equipment Leasing Market insights. See full methodology.
|
Market Scope |
|
|
Report Coverage |
Details |
|
Page number |
234 |
|
Base year |
2024 |
|
Historic period |
2019-2023 |
|
Forecast period |
2025-2029 |
|
Growth momentum & CAGR |
Accelerate at a CAGR of 8.3% |
|
Market growth 2025-2029 |
USD 30913.5 million |
|
Market structure |
Fragmented |
|
YoY growth 2024-2025(%) |
7.7 |
|
Key countries |
US, Germany, China, UK, France, South Korea, India, Japan, Brazil, and Canada |
|
Competitive landscape |
Leading Companies, Market Positioning of Companies, Competitive Strategies, and Industry Risks |
What are the Key Data Covered in this Healthcare Equipment Leasing Market Research and Growth Report?
- CAGR of the Healthcare Equipment Leasing industry during the forecast period
- Detailed information on factors that will drive the growth and forecasting between 2025 and 2029
- Precise estimation of the size of the market and its contribution of the industry in focus to the parent market
- Accurate predictions about upcoming growth and trends and changes in consumer behaviour
- Growth of the market across North America, Europe, Asia, and Rest of World (ROW)
- Thorough analysis of the market's competitive landscape and detailed information about companies
- Comprehensive analysis of factors that will challenge the healthcare equipment leasing market growth of industry companies
We can help! Our analysts can customize this healthcare equipment leasing market research report to meet your requirements.
 RIA -
RIA - 
