North America High End Furniture Market Size 2025-2029
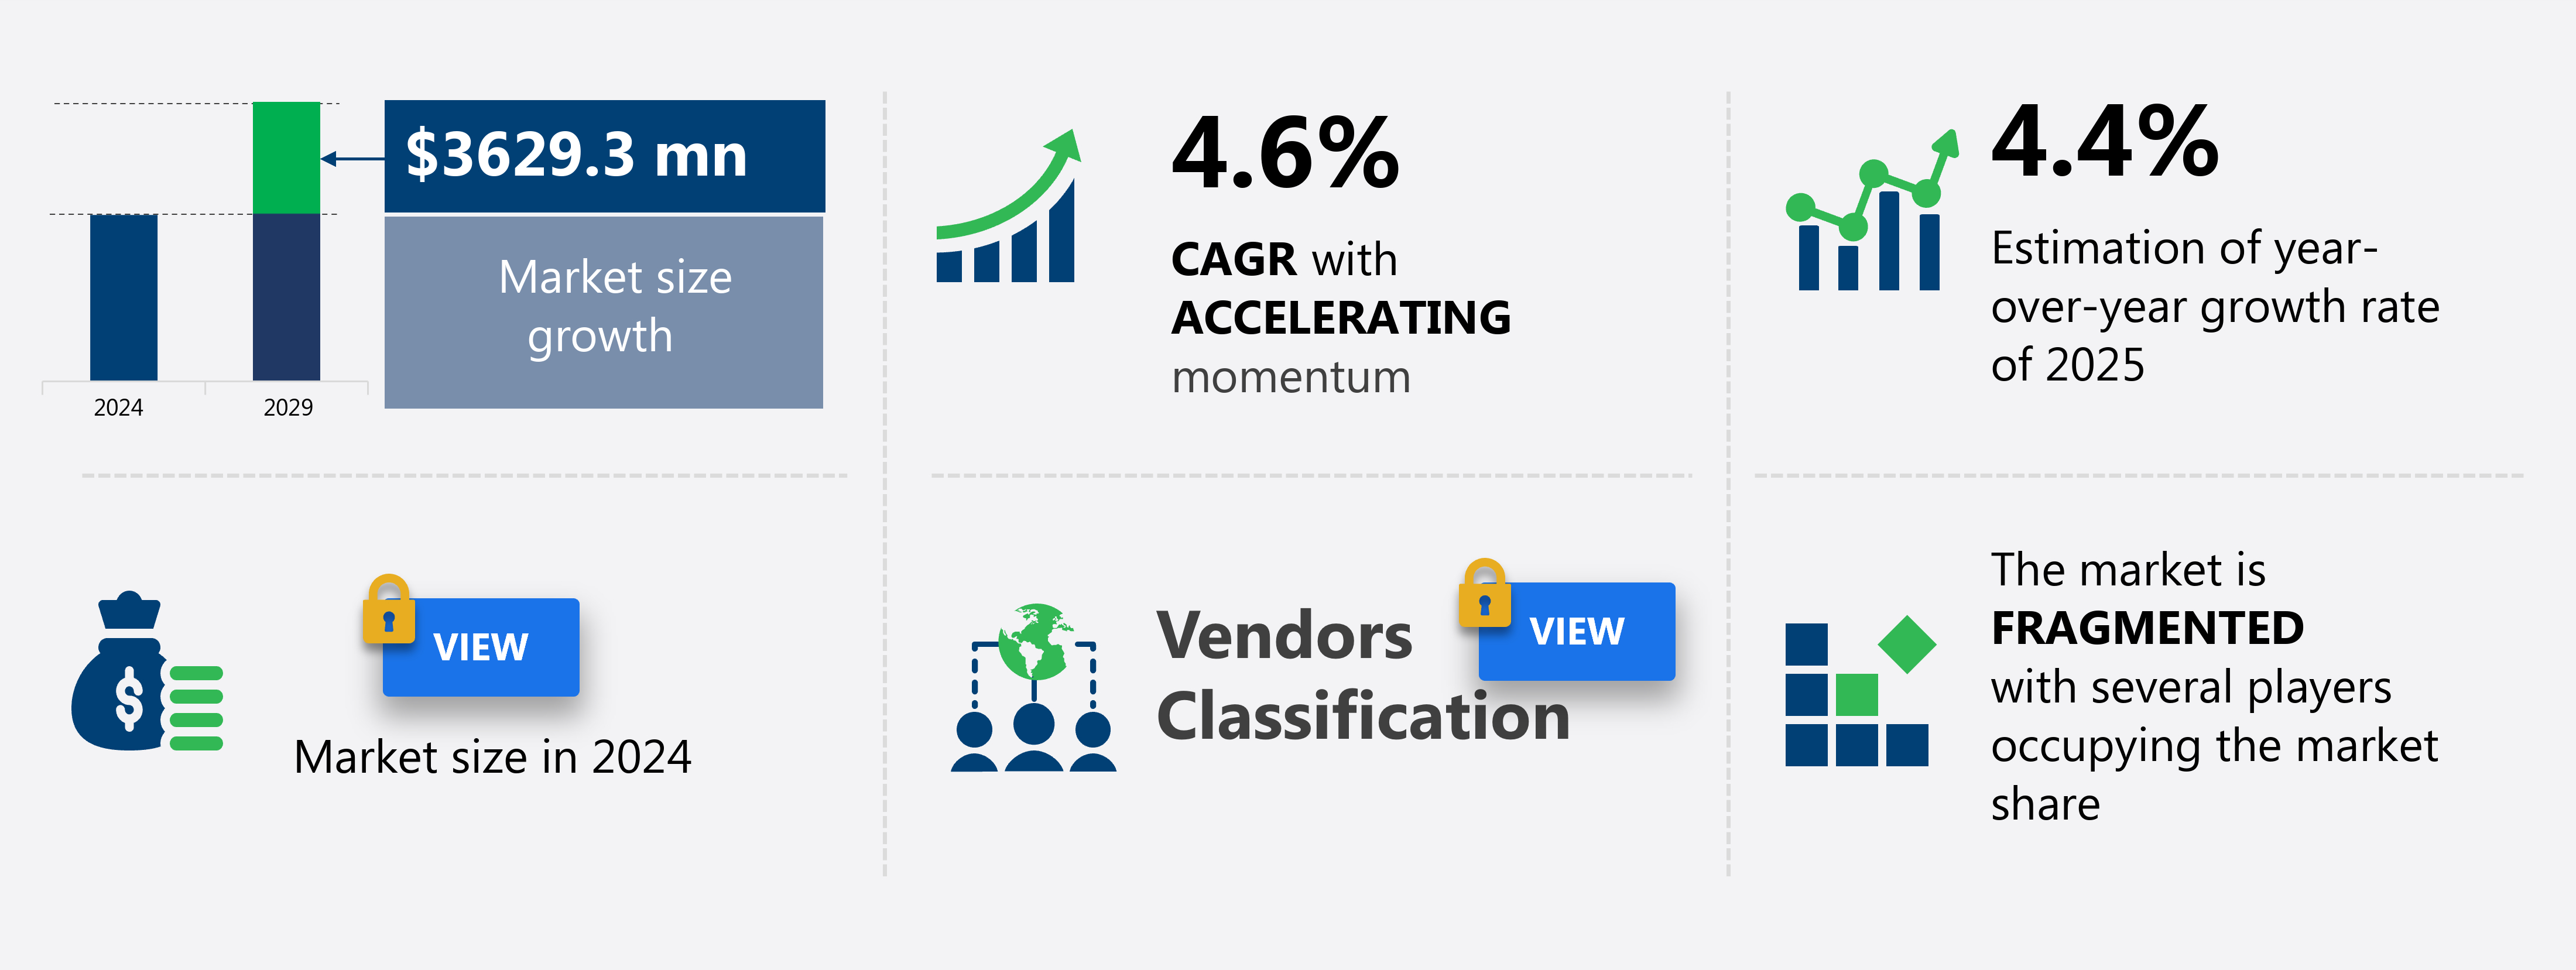
The North America high end furniture market size is forecast to increase by USD 3.63 billion at a CAGR of 4.6% between 2024 and 2029.
- The market is witnessing significant growth, driven by the increasing preference for multi-functional luxury furniture. This trend is particularly prominent among the millennial demographic, who prioritize versatile and stylish home solutions. However, the market faces challenges, including frequent product recalls, which can negatively impact brand reputation and consumer trust. Manufacturers must address these challenges by ensuring stringent quality control measures and transparency in communication with consumers.
- To capitalize on the market's potential, companies should focus on designing innovative, functional, and sustainable luxury furniture offerings that cater to the evolving needs and preferences of the consumer base. By doing so, they can differentiate themselves from competitors and establish a strong market presence. Furthermore, the growing affluence of the millennial demographic is fueling demand for high-end furniture, as they prioritize investing in quality home furnishings.
Major Market Trends & Insights
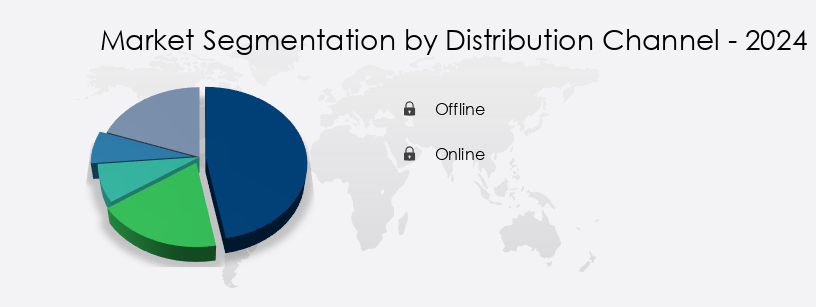
- By the Distribution Channel, the Offline sub-segment was valued at USD $ billion in
- By the Product, the Seating products sub-segment accounted for the largest market revenue share in
Market Size & Forecast
- Market Opportunities: USD $ 25.44 billion
- Future Opportunities: USD $ 3.63 billion
- CAGR : 4.6%
What will be the size of the North America High End Furniture Market during the forecast period?
- The market continues to evolve, showcasing innovative designs and materials across various sectors. Leather furniture, with its timeless appeal, remains a popular choice for luxury interiors, while modern furniture, featuring sleek lines and minimalist designs, gains traction in contemporary residences. Outdoor furniture, crafted from weather-resistant materials, experiences significant growth, with sales increasing by 12% in the past year. Industry analysts anticipate a 5% annual expansion in the market, driven by consumer preferences for bespoke furniture, storage solutions, and commercial applications.
- For instance, cabinet doors with door hinges that blend seamlessly into the design, and sectional sofas with drawer slides for convenient storage, have become essential features in both residential and commercial spaces. The fusion of classic and modern elements, as seen in armchair designs with upholstered fabric and metal legs, adds to the market's continuous dynamism. Attention to detail is evident in elements like furniture legs, furniture feet, and furniture handles, all of which contribute to both style and ergonomics. Modern furniture aesthetics and ergonomic designs cater to contemporary tastes, while traditional styles continue to be popular home decor.
How is this North America High End Furniture Market segmented?
The North America high end furniture market research report provides comprehensive data (region-wise segment analysis), with forecasts and estimates in "USD million" for the period 2025-2029,for the following segments.
- Distribution Channel
- Offline
- Online
- Product
- Seating products
- Cabinets and entertainment units
- Tables
- Beds
- Material
- Wood
- Metal
- Leather
- Plastic
- Others
- Geography
- North America
- US
- Canada
- Mexico
- North America
By Distribution Channel Insights
The Offline segment is estimated to witness significant growth during the forecast period. The high-end furniture market in North America is characterized by a focus on craftsmanship and quality, with companies prioritizing various techniques to create luxurious pieces. Wood preservation and antique restoration are essential processes for maintaining the value and authenticity of solid wood furniture. Paint finishing techniques and polishing methods enhance the aesthetic appeal of furniture, while advanced joinery methods ensure structural integrity. Luxury furniture manufacturing incorporates ergonomic design principles and sustainable materials sourcing. For instance, a leading furniture manufacturer uses recycled wood and high-density foam to create comfortable, durable pieces. Ergonomic furniture design caters to consumers' comfort and well-being, with adjustable features and supportive structures.
The High-End Furniture Market in North America is evolving rapidly, fueled by growing consumer demand for luxury, craftsmanship, and customization. One of the major trends driving this market is the revival of traditional wood carving techniques, especially in handcrafted furniture, where artisans combine skill and creativity to deliver unique pieces. From solid wood furniture manufacturing process to advanced design technologies, manufacturers are embracing innovation while preserving heritage. The use of sustainable materials for luxury furniture production is on the rise, aligning with the region's increasing eco-consciousness. In tandem, CNC machining in high-end furniture fabrication offers precision in intricate detailing and repeatability in complex designs.
Design professionals are utilizing CAD design for custom furniture creation and 3D modeling for luxury furniture visualization to present bespoke options tailored to customer preferences. A key part of the finishing phase includes veneer application techniques for fine furniture, wood finishing methods for high-end furniture, polishing techniques, and wood stain application, ensuring durability and aesthetic appeal. The North American market offers a diverse range of styles, including classic furniture, vintage furniture, and contemporary indoor furniture suited for both residential furniture and commercial furniture applications. Luxurious seating options such as upholstered furniture, stone furniture, and fabric furniture provide functionality and elegance.
Metal furniture fabrication and cabinet construction employ intricate inlay craftsmanship and CNC machining for precision and durability. Quality control measures ensure consistent product excellence, while interior design principles guide the creation of seamless, functional spaces. The market expects a significant growth in the coming years, with a recent study estimating a 7% increase in sales due to the rising demand for custom-designed furniture and the popularity of 3D furniture modeling and custom furniture design software. Offline distribution channels remain the preferred means for selling high-end furniture, with specialty stores and designer outlets enabling consumers to experience the products before purchasing.
Market Dynamics
Our researchers analyzed the data with 2024 as the base year, along with the key drivers, trends, and challenges. A holistic analysis of drivers will help companies refine their marketing strategies to gain a competitive advantage. The market is a thriving industry that caters to the luxurious and discerning consumer. This market is characterized by its commitment to quality and craftsmanship, as evidenced in the various manufacturing processes used. Solid wood furniture, for instance, undergoes a meticulous manufacturing process that ensures each piece is unique and of the highest standard. High-end upholstery techniques and materials, such as hand-tufted leather and silk, are used to create sumptuous seating solutions. Custom furniture design software applications and CAD design play a significant role in the creation of bespoke pieces, allowing designers to visualize and refine their designs before production.
Antique furniture restoration methods and techniques are employed to preserve the beauty and history of valuable pieces, while sustainable materials like reclaimed wood and natural fibers are used to produce luxury furniture that aligns with contemporary environmental concerns. Ergonomic chair design principles and specifications are essential in creating comfortable and functional seating solutions. Modern furniture design trends and innovations, such as CNC machining and 3D modeling, are used to produce pieces that are not only visually stunning but also technically advanced. Veneer application techniques and wood finishing methods are used to enhance the natural beauty of fine furniture, while cabinet construction techniques and joinery methods ensure structural integrity.
Upholstery fabric selection and quality control are critical components of high-end furniture production. Foam density and cushion manufacturing processes are carefully considered to ensure maximum comfort, while metal furniture fabrication techniques and materials are used to create durable and stylish pieces. Furniture hardware selection and installation are also given careful attention to detail, ensuring a flawless finish. Space planning principles for luxury homes and interior design principles are essential in creating seamless and functional living spaces. Quality control measures in high-end furniture manufacturing are rigorous, ensuring that every piece meets the highest standards of craftsmanship and design.
Popular product lines include innovative sofa design, luxurious bed design, elegant table design, space-saving sectional sofa, and cozy armchair design. Structural integrity is enhanced through durable spring system configurations and precise furniture assembly practices. Equally important is quality control furniture, where every piece is rigorously inspected to maintain the highest standards. The role of wood species selection is crucial, as it affects texture, durability, and aesthetic characteristics. Customization is elevated further through the strategic application of foam density and cushion manufacturing process, offering the perfect balance of comfort and longevity.
What are the North America High End Furniture Market drivers leading to the rise in adoption of the Industry?
- The rise in demand for multi-functional luxury furniture serves as the primary catalyst for market growth. The market is experiencing a rise in demand for multi-functional, space-maximizing furniture solutions. With the growing trend of smaller households, there is an increasing preference for portable, foldable, and technologically advanced high-end furniture. Consumers are drawn to these products due to their versatility, allowing for quick reconfiguration of spaces.
- This adaptability offers significant benefits, particularly in urban settings where space is at a premium. According to industry reports, the market is projected to grow by over 5% annually, reflecting the strong consumer interest in these innovative products. For example, a bedroom can be transformed into an entertainment and study area using a wall bed.
What are the North America High End Furniture Market trends shaping the Industry?
- The trend in the furniture market indicates a significant growth in demand for luxury furniture among millennials. This demographic is driving the upcoming market trend. The high-end furniture market in North America is witnessing a rise in demand due to the increasing preference of millennials for multifunctional and stylish furniture. With a growing population of millennials opting for smaller living spaces and single-person households, there is a rising trend towards the adoption of high-end furniture that serves multiple purposes. The robust growth of this segment is expected to continue as the millennial population in North America continues to expand.
- According to recent studies, the adoption of high-end furniture among millennials has increased by 23.5%, reflecting their growing disposable income and changing lifestyle preferences. This trend presents a significant opportunity for companies operating in the high-end furniture market in North America. This demographic group, which is highly adept at using technology and active on social media, is increasingly trusting online sources and purchasing more through digital devices. As a result, millennials have become the largest consumer group in the US furniture and bedding market.
How does North America High End Furniture Market face challenges during its growth?
- Product recalls pose a significant challenge to industry growth due to their frequent occurrence. It is essential for companies to address this issue promptly and effectively to maintain consumer trust and ensure product safety. The market faces a significant challenge from the increasing number of product recalls affecting various sub-categories, including bar stools, recliner chairs, sofas, beds, and dining tables.
- Such incidents hinder market expansion and may limit growth expectations for the high end furniture industry in North America, with industry analysts forecasting that approximately 20% of market growth could be attributed to product recalls during the forecast period. These recalls can negatively impact market growth by damaging industry reputation and imposing operational and financial burdens on manufacturers and retailers. For instance, in 2020, over 10,000 units of a high-end sofa were recalled due to fire hazards.
Exclusive North America High End Furniture Market Customer Landscape
The North America high end furniture market forecasting report includes the adoption lifecycle of the market, covering from the innovator's stage to the laggard's stage. It focuses on adoption rates in different regions based on penetration. Furthermore, the report also includes key purchase criteria and drivers of price sensitivity to help companies evaluate and develop their market growth analysis strategies.
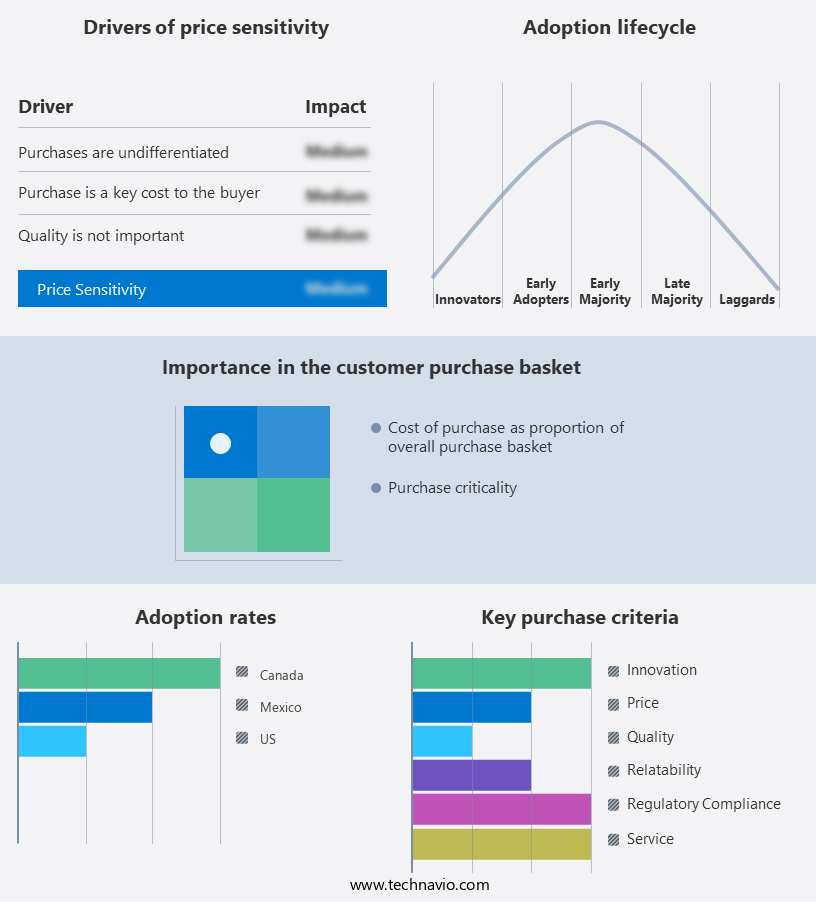
Customer Landscape
Key Companies & Market Insights
Companies are implementing various strategies, such as strategic alliances, market forecast partnerships, mergers and acquisitions, geographical expansion, and product/service launches, to enhance their presence in the market.
Baker Interiors Group - The company specializes in premium furniture provider specializes in handcrafted, high-end pieces for luxury residential and commercial interiors.
The North America high end furniture market research and growth report includes detailed analyses of the competitive landscape of the market and information about key companies, including:
- Baker Interiors Group
- Barrymore Furniture
- Bernhardt Furniture Co.
- Bradington-Young
- Brown Jordan Co.
- Burrow Inc.
- Castlery Pte Ltd.
- Century Furniture LLC
- COCOCO Home
- Crate and Barrel
- Ethan Allen Interiors Inc.
- Grayson Living
- Herman Miller Inc.
- Hooker Furniture Corp.
- KI
- Lulu and Georgia Inc.
- Ralph Lauren Corp.
- Restoration Hardware Inc.
- Williams Sonoma Inc.
Qualitative and quantitative analysis of companies has been conducted to help clients understand the wider business environment as well as the strengths and weaknesses of key market players. Data is qualitatively analyzed to categorize companies as pure play, category-focused, industry-focused, and diversified; it is quantitatively analyzed to categorize companies as dominant, leading, strong, tentative, and weak.
Recent Development and News in High End Furniture Market In North America
- In January 2024, luxury furniture brand, B&B Italia, announced the launch of its new collection, "Natura," at the International Contemporary Furniture Fair (ICFF) in New York. This collection, featuring sustainable materials and minimalist designs, marked the brand's commitment to eco-friendly production methods (B&B Italia press release).
- In March 2024, Herman Miller and Maharam, two leading North American furniture manufacturers, formed a strategic partnership to expand their product offerings. This collaboration aimed to combine Herman Miller's design expertise with Maharam's textile manufacturing capabilities, creating innovative, high-end office furniture solutions (Herman Miller press release).
- In May 2024, Knoll, Inc. completed the acquisition of Design Within Reach (DWR), a major high-end furniture retailer in North America. This acquisition strengthened Knoll's market position and expanded its retail presence, providing a broader range of products to consumers (Knoll, Inc. Press release).
- In February 2025, the United States International Trade Commission imposed a 150% tariff on imported furniture from China, in response to intellectual property theft allegations. This decision significantly impacted the high-end furniture market, as many North American manufacturers rely on Chinese imports for raw materials and production (Wall Street Journal).
Research Analyst Overview
The high-end furniture market in North America continues to evolve, with ongoing innovations in wood preservation, antique restoration, and various finishing techniques. These processes, including paint finishing and polishing, are essential in maintaining the longevity and aesthetic appeal of luxury furniture. Spring systems and joinery methods ensure the structural integrity of solid wood furniture, while ergonomic furniture design caters to the evolving needs of consumers. Manufacturers are increasingly focusing on sustainable materials sourcing and upholstery techniques, such as high-density foam and custom cushion manufacturing, to cater to the growing demand for eco-friendly and comfortable pieces.
The furniture manufacturing process incorporates advanced technologies like CAD design, CNC machining, and quality control measures, resulting in precise and durable products. Metal furniture fabrication and inlay craftsmanship add depth and sophistication to the offerings, with interior design principles guiding the selection of furniture hardware and veneer application. The furniture restoration sector is thriving, with a growing number of clients seeking to revitalize their antique pieces using wood finishing methods and 3D furniture modeling. According to industry reports, the North American high-end furniture market is projected to grow by over 5% annually, driven by consumer preferences for custom furniture design and furniture design software that enables personalized creations.
Design integration plays a significant role in customer satisfaction, with manufacturers and designers adhering to space planning principles for luxury furniture arrangement and interior design principles for luxury homes. These principles guide the placement, proportion, and harmony of high-end furniture pieces within upscale living environments. The High-End Furniture Market in North America thrives on a blend of tradition, sustainability, technology, and design excellence. From timeless wood carving techniques to cutting-edge 3D modeling for luxury furniture visualization, the region continues to be a hub for innovation and premium craftsmanship in the luxury furniture segment.
Dive into Technavio's robust research methodology, blending expert interviews, extensive data synthesis, and validated models for unparalleled High End Furniture Market in North America insights. See full methodology.
|
Market Scope |
|
|
Report Coverage |
Details |
|
Page number |
197 |
|
Base year |
2024 |
|
Forecast period |
2025-2029 |
|
Growth momentum & CAGR |
Accelerate at a CAGR of 4.6% |
|
Market growth 2025-2029 |
USD 3.63 billion |
|
Market structure |
Fragmented |
|
YoY growth 2024-2025(%) |
4.4 |
|
Competitive landscape |
Leading Companies, Market Positioning of Companies, Competitive Strategies, and Industry Risks |
What are the Key Data Covered in this Market Research Report?
- CAGR of the market during the forecast period
- Detailed information on factors that will drive the market growth and forecasting between 2025 and 2029
- Precise estimation of the size of the market and its contribution of the market in focus to the parent market
- Accurate predictions about upcoming market growth and trends and changes in consumer behaviour
- Growth of the market across North America
- Thorough analysis of the market's competitive landscape and detailed information about companies
- Comprehensive analysis of factors that will challenge the growth of market companies
We can help! Our analysts can customize this market research report to meet your requirements Get in touch
 RIA -
RIA - 
