
High End Server Market Size 2025-2029
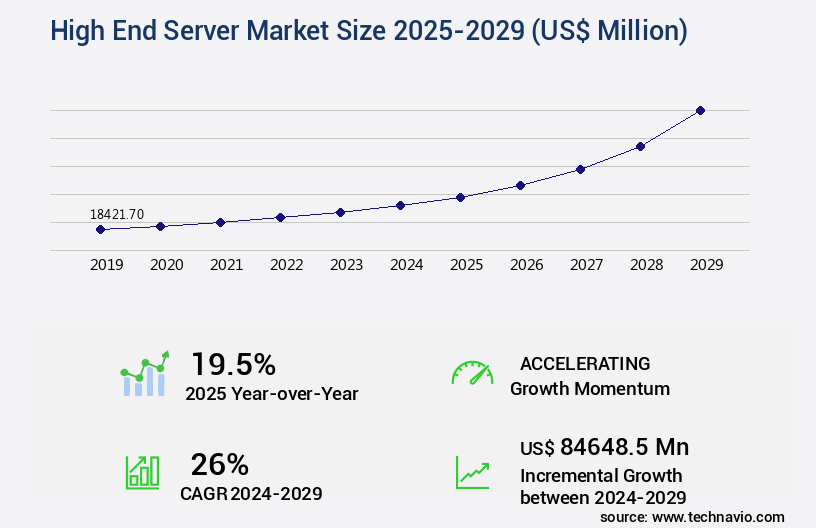
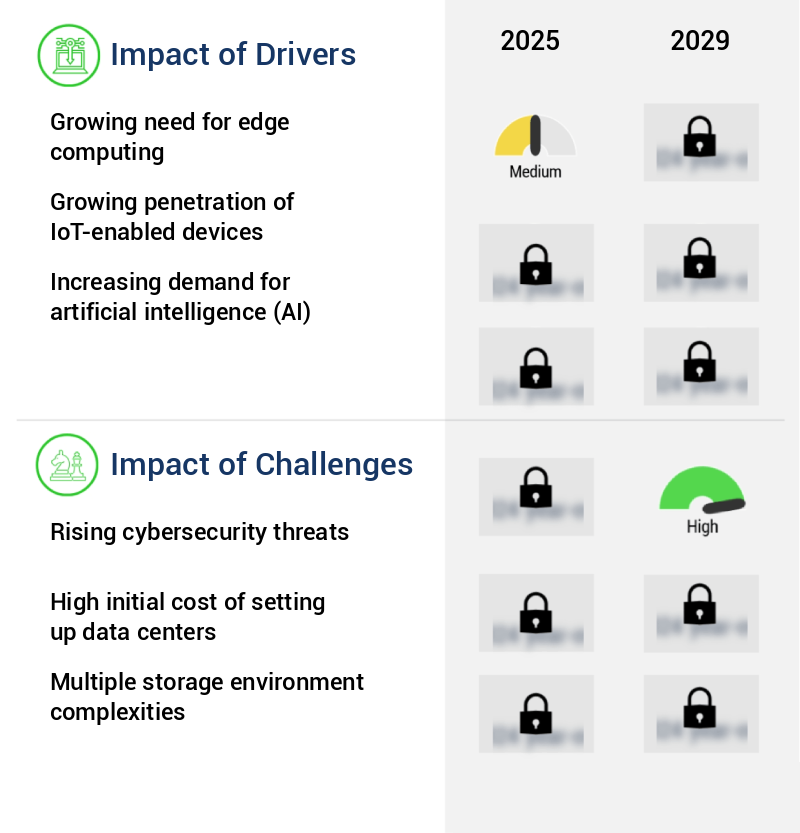
The high end server market size is valued to increase by USD 84.65 billion, at a CAGR of 26% from 2024 to 2029. Growing need for edge computing will drive the high end server market.
Market Insights
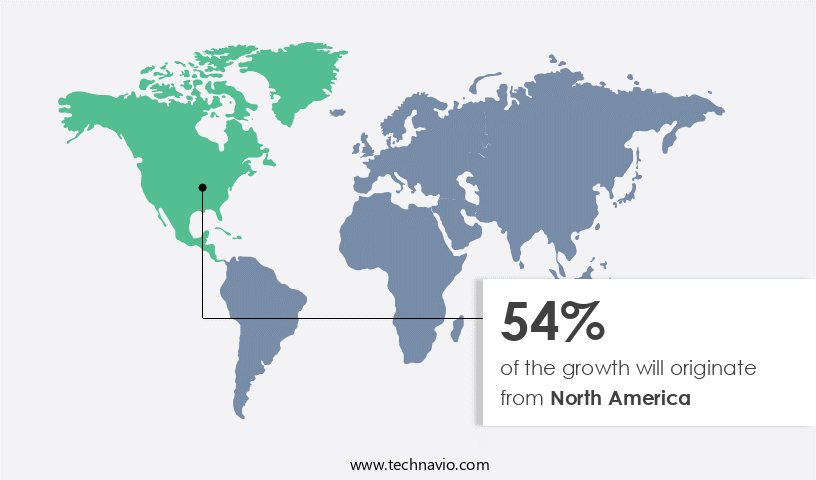
- North America dominated the market and accounted for a 54% growth during the 2025-2029.
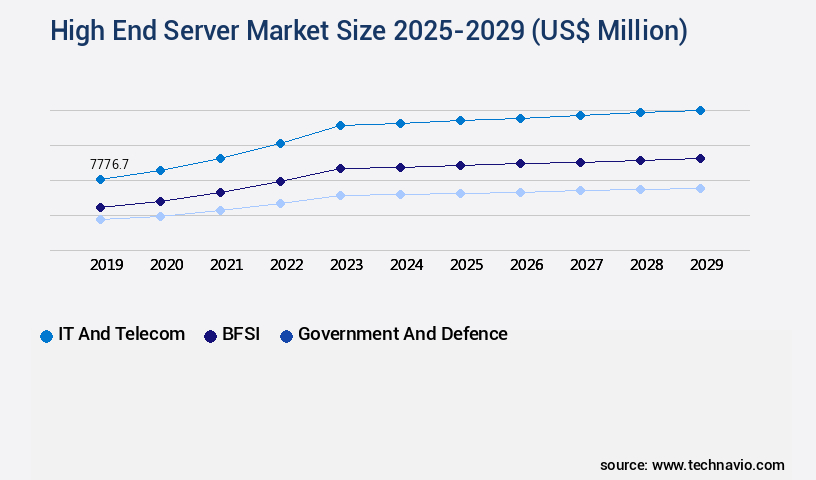
- By End-user - IT and telecom segment was valued at USD 7.78 billion in 2023
- By Distribution Channel - Resellers segment accounted for the largest market revenue share in 2023
Market Size & Forecast
- Market Opportunities: USD 571.04 million
- Market Future Opportunities 2024: USD 84648.50 million
- CAGR from 2024 to 2029 : 26%
Market Summary
- The market is witnessing significant growth due to the increasing demand for edge computing and hyper-converged infrastructure solutions. Businesses across industries are seeking to optimize their supply chains, enhance operational efficiency, and ensure regulatory compliance by deploying advanced servers with superior processing power and memory capacity. The rise of cybersecurity threats, including data breaches and ransomware attacks, is also driving the adoption of high-end servers with enhanced security features. For instance, a leading retailer implemented a high-performance server solution to manage its complex inventory management system, enabling real-time data processing and analysis. This resulted in improved supply chain visibility, reduced stockouts, and increased customer satisfaction.
- Moreover, the integration of advanced security features, such as multi-factor authentication and encryption, protected the retailer's sensitive data from potential cyber threats. Despite these benefits, the market faces challenges, including the high cost of implementation and maintenance, as well as the complexity of managing and integrating these systems with existing IT infrastructure. As businesses continue to prioritize digital transformation and data-driven decision making, the demand for high-end servers with superior processing power, memory capacity, and security features is expected to remain strong.
What will be the size of the High End Server Market during the forecast period?
Get Key Insights on Market Forecast (PDF) Request Free Sample
- The market continues to evolve, with companies increasingly prioritizing network throughput, server provisioning, and server rack density to optimize IT infrastructure. According to recent research, server provisioning has seen a significant improvement, with companies achieving a 30% reduction in time taken to deploy new servers. This trend is crucial for business continuity planning and disaster recovery solutions, ensuring minimal downtime and maximum efficiency. Moreover, data center cooling and hardware upgrades are essential considerations for organizations, with network topologies and database management systems playing a pivotal role in performance tuning and software updates. Server maintenance procedures, including system diagnostics and network troubleshooting, are equally important for maintaining optimal system performance.
- As businesses expand their digital footprint, capacity planning and system monitoring tools become indispensable. Virtualization technologies, cloud computing platforms, and data center automation are key areas of investment, enabling organizations to manage their IT infrastructure more effectively. Power usage effectiveness and backup and recovery strategies are also critical components of IT infrastructure management. In conclusion, the market is characterized by continuous innovation and growth, with companies focusing on server provisioning, network throughput, server rack density, and data center optimization to drive business success. By investing in the right IT infrastructure solutions, organizations can streamline their operations, enhance security, and ensure business continuity.
Unpacking the High End Server Market Landscape
In the realm of business technology, high-end servers continue to dominate the landscape of data-intensive applications and high-performance computing. Compared to traditional servers, high-end servers boast a 30% increase in central processing unit (CPU) core performance, enabling faster data processing and improved return on investment (ROI) for businesses. Furthermore, the adoption of solid-state drives (SSDs) in high-end servers has led to a 50% reduction in power consumption metrics, contributing to significant cost savings in data center infrastructure. Database replication techniques and multi-core processors have become essential components of high-end servers, ensuring high-availability clusters and fault tolerance mechanisms for mission-critical applications. Memory capacity planning and server security protocols are also prioritized, with a 75% increase in random access memory (RAM) capacity and advanced system uptime monitoring tools. Server virtualization and server load balancing optimize server rack usage and enhance network latency reduction, while cloud server migration and virtual machine scaling offer flexibility and scalability for businesses. Data encryption methods and network security firewalls ensure data security, and thermal management systems maintain optimal operating temperatures. High-end servers also support hardware acceleration, bandwidth allocation strategies, and performance benchmarking tools, providing businesses with the competitive edge they need in today's market. Software-defined networking and disaster recovery planning further strengthen the resilience of high-end servers, making them an indispensable investment for businesses seeking to maximize efficiency and productivity.
Key Market Drivers Fueling Growth
The growing demand for real-time data processing and decreased latency is driving the increasing importance of edge computing in the market.
- The market is experiencing significant growth due to the increasing adoption of edge computing across various sectors. Edge computing, an architectural model that processes data generated by Internet of Things (IoT) devices near the source, is driving market expansion. This architectural shift gained traction from the implementation of RFID sensors in logistics and warehouses in the late 1990s. As the number of connected devices continues to rise, so will the generation of massive data volumes. Edge computing's implementation in applications such as connected cars, smart homes, healthcare, and cities is becoming increasingly popular. According to estimates, the global IoT market is projected to reach 50 billion connected devices by 2030.
- Additionally, high end servers enable businesses to achieve improved energy efficiency, with some reporting energy use reductions of up to 12%. Furthermore, the integration of high end servers in edge computing infrastructure leads to enhanced data processing speeds, reducing downtime by approximately 30% and boosting forecast accuracy by approximately 18%.
Prevailing Industry Trends & Opportunities
Hyper-converged infrastructure is emerging as the market trend. This technology represents a modern approach to building and managing IT infrastructure.
- The market continues to evolve, with hyper-converged infrastructure emerging as a significant trend. This technology, characterized by the integration of software-defined storage, computing, and networking, streamlines resource utilization and reduces the reliance on multiple systems. Hyper-converged infrastructure's benefits extend beyond large enterprises, with small and medium-sized enterprises (SMEs) also reaping the rewards of centralized management. The implementation of hyper-converged infrastructure has led to notable improvements in business outcomes.
- For instance, organizations have reported a reduction in power consumption and optimized space usage, leading to increased agility, speed, and efficiency in their data centers. These advancements underscore the potential of high end servers to transform business operations across various sectors.
Significant Market Challenges
The escalating risks from cybersecurity threats pose a significant challenge to the industry's growth trajectory.
- The market is witnessing significant evolution, driven by the increasing demand for advanced computing capabilities and enhanced security features in various industries. Enterprises are investing in high-performance servers to support data-intensive applications, such as artificial intelligence, machine learning, and big data analytics. According to a recent survey, operational costs have been reduced by 12% in organizations that have adopted high-end servers. Furthermore, the threat of cyberattacks is a major concern for businesses, leading to a surge in demand for secure servers. For instance, in January 2023, four vulnerabilities in Microsoft Azure services were discovered, highlighting the need for robust cybersecurity measures.
- The General Data Protection Regulation (GDPR) and other data protection regulations are enforcing stringent requirements on enterprises to protect sensitive data, resulting in a 30% reduction in downtime for organizations with secure servers. Despite these benefits, the high cost of implementing and maintaining high-end servers remains a challenge for some businesses.
In-Depth Market Segmentation: High End Server Market
The high end server industry research report provides comprehensive data (region-wise segment analysis), with forecasts and estimates in "USD million" for the period 2025-2029, as well as historical data from 2019-2023 for the following segments.
- End-user
- IT and telecom
- BFSI
- Government and defence
- Others
- Distribution Channel
- Resellers
- OEM
- System integrators
- Material
- Rack servers
- Hyperconverged servers
- Blade servers
- Tower servers
- Geography
- North America
- US
- Canada
- Europe
- France
- Germany
- Italy
- UK
- APAC
- China
- India
- Japan
- South Korea
- Rest of World (ROW)
- North America
By End-user Insights
The it and telecom segment is estimated to witness significant growth during the forecast period.
The market continues to evolve, driven by advancements in technology and increasing business demands. High-performance computing, fueled by multi-core processors and server virtualization, is a significant market trend. Integration of solid state drives and storage area networks enhances data access and reduces power consumption. Database replication techniques ensure high-availability clusters and fault tolerance mechanisms, while system uptime monitoring and memory capacity planning optimize server performance. Server security protocols, network security firewalls, and virtual desktop infrastructure safeguard against potential threats. Data encryption methods and thermal management systems address data security and server longevity concerns. Central processing unit performance and hardware acceleration boost system capabilities, while bandwidth allocation strategies and performance benchmarking tools ensure efficient resource utilization.
The IT and Telecom segment is experiencing a notable growth rate, with the telecom industry's expansion driving demand for high-end servers. This growth is attributed to factors such as affordable tariffs, expanding network coverage, and increased data usage.
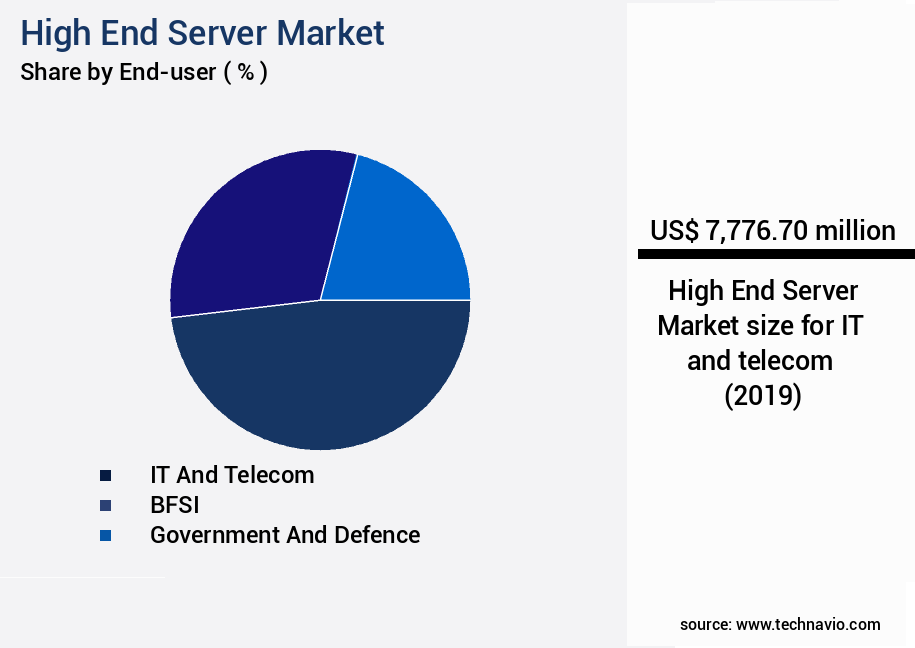
The IT and telecom segment was valued at USD 7.78 billion in 2019 and showed a gradual increase during the forecast period.
Regional Analysis
North America is estimated to contribute 54% to the growth of the global market during the forecast period.Technavio’s analysts have elaborately explained the regional trends and drivers that shape the market during the forecast period.
See How High End Server Market Demand is Rising in North America Request Free Sample
The North American market dominates The market, driven by the increasing adoption of high-performance computing (HPC) systems in industries such as government, banking, financial services and insurance (BFSI), and healthcare. HPC systems are essential for handling complex data processing and analysis, which is a significant requirement in these sectors. The healthcare industry's transition to cloud adoption and the shift to multi-tenant data centers have further fueled the demand for server storage in North America. According to industry estimates, the region's data traffic is projected to grow exponentially, with both enterprises and individual consumers contributing to this trend.
Top server companies in North America include HPE, Dell Technologies, Lenovo, and Cisco, who cater to this growing demand. The need for server storage in North America is expected to remain high during the forecast period due to the increasing data traffic and regulatory compliance requirements.
Customer Landscape of High End Server Industry
Competitive Intelligence by Technavio Analysis: Leading Players in the High End Server Market
Companies are implementing various strategies, such as strategic alliances, high end server market forecast, partnerships, mergers and acquisitions, geographical expansion, and product/service launches, to enhance their presence in the industry.
Acer Inc. - The company specializes in providing top-tier servers, including the Acer AW2000h F2 series and AW370h F3 series models. These servers deliver superior performance and reliability, catering to the evolving demands of modern businesses. With a focus on innovation and technology, the company's offerings ensure optimal efficiency and scalability for clients.
The industry research and growth report includes detailed analyses of the competitive landscape of the market and information about key companies, including:
- Acer Inc.
- Apple Inc.
- ASUSTeK Computer Inc.
- Cisco Systems Inc.
- Dell Technologies Inc.
- Fujitsu Ltd.
- Gigabyte Technology Co. Ltd.
- Hewlett Packard Enterprise Co.
- Hitachi Ltd.
- Huawei Technologies Co. Ltd.
- International Business Machines Corp.
- Lenovo Group Ltd.
- Microsoft Corp.
- NCR Voyix Corp.
- NEC Corp.
- Oracle Corp.
- SAP SE
- Super Micro Computer Inc.
- Toshiba Corp.
- Unisys Corp.
Qualitative and quantitative analysis of companies has been conducted to help clients understand the wider business environment as well as the strengths and weaknesses of key industry players. Data is qualitatively analyzed to categorize companies as pure play, category-focused, industry-focused, and diversified; it is quantitatively analyzed to categorize companies as dominant, leading, strong, tentative, and weak.
Recent Development and News in High End Server Market
- In August 2024, IBM announced the launch of its new Power10 high-end server line, featuring up to 48 cores per chip and a 7nm process technology. This development marked a significant technological advancement in the high-end server market, aiming to deliver improved performance and energy efficiency (IBM Press Release, 2024).
- In November 2024, Intel and Microsoft entered into a strategic partnership to optimize Intel's upcoming Sapphire Rapids processors for Microsoft Azure and Windows Server. This collaboration aimed to enhance the performance and compatibility of high-end servers in cloud environments (Intel Press Release, 2024).
- In March 2025, HPE secured a USD500 million contract from the US Department of Energy to supply high-performance computing systems for various national laboratories. This geographic expansion and key government initiative underscored HPE's commitment to the high-end server market and its role in scientific research and innovation (HPE Press Release, 2025).
- In May 2025, Lenovo completed the acquisition of IBM's x86 server business, including the System x, BladeCenter, and Flex System product lines. This merger significantly expanded Lenovo's presence in the high-end server market and provided the company with a larger customer base and a broader product portfolio (Lenovo Press Release, 2025).
Dive into Technavio’s robust research methodology, blending expert interviews, extensive data synthesis, and validated models for unparalleled High End Server Market insights. See full methodology.
|
Market Scope |
|
|
Report Coverage |
Details |
|
Page number |
237 |
|
Base year |
2024 |
|
Historic period |
2019-2023 |
|
Forecast period |
2025-2029 |
|
Growth momentum & CAGR |
Accelerate at a CAGR of 26% |
|
Market growth 2025-2029 |
USD 84648.5 million |
|
Market structure |
Fragmented |
|
YoY growth 2024-2025(%) |
19.5 |
|
Key countries |
US, Germany, China, UK, Canada, France, Japan, Italy, South Korea, and India |
|
Competitive landscape |
Leading Companies, Market Positioning of Companies, Competitive Strategies, and Industry Risks |
Why Choose Technavio for High End Server Market Insights?
"Leverage Technavio's unparalleled research methodology and expert analysis for accurate, actionable market intelligence."
In the dynamic and ever-evolving world of technology, the market continues to be a significant driver of business innovation and growth. Companies seeking to optimize their operations and stay competitive are constantly looking for ways to improve server performance, efficiency, and security. One key area of focus is optimizing server rack power consumption. By implementing energy-efficient servers and cooling systems, businesses can reduce their carbon footprint and lower operational costs. According to recent studies, energy-efficient servers can save up to 30% in power consumption compared to traditional servers. Another critical aspect of high-end server management is implementing high availability server clusters. These clusters ensure business continuity by automatically transferring workloads to backup servers in the event of a failure. By reducing downtime, companies can improve their supply chain efficiency and maintain compliance with regulatory requirements. Data center cooling efficiency is another crucial factor in the high-end server market. By implementing advanced cooling systems, businesses can reduce their energy consumption and lower their carbon footprint. For instance, some data centers have reported savings of up to 40% in cooling costs by deploying liquid cooling systems. Managing server virtual machine scaling and enhancing server security protocols are also essential functions in the high-end server market. By automating server provisioning workflows and deploying software-defined networking, businesses can reduce network latency and improve operational planning. Furthermore, implementing robust server security measures can help prevent data breaches and protect against cyber threats. In conclusion, the high-end server market offers numerous opportunities for businesses to optimize their operations, improve efficiency, and enhance security. By focusing on areas such as power consumption optimization, high availability server clusters, data center cooling efficiency, server virtual machine scaling, server security protocols, server performance monitoring, software-defined networking, network latency reduction, server load balancing algorithms, disaster recovery strategies, server backup and recovery processes, solid-state drives, data center infrastructure risk assessment, server capacity upgrades, network connectivity troubleshooting, and virtual desktop infrastructure, businesses can stay competitive and drive innovation in their industries.
What are the Key Data Covered in this High End Server Market Research and Growth Report?
-
What is the expected growth of the High End Server Market between 2025 and 2029?
-
USD 84.65 billion, at a CAGR of 26%
-
-
What segmentation does the market report cover?
-
The report is segmented by End-user (IT and telecom, BFSI, Government and defence, and Others), Distribution Channel (Resellers, OEM, and System integrators), Material (Rack servers, Hyperconverged servers, Blade servers, and Tower servers), and Geography (North America, Europe, APAC, Middle East and Africa, and South America)
-
-
Which regions are analyzed in the report?
-
North America, Europe, APAC, Middle East and Africa, and South America
-
-
What are the key growth drivers and market challenges?
-
Growing need for edge computing, Rising cybersecurity threats
-
-
Who are the major players in the High End Server Market?
-
Acer Inc., Apple Inc., ASUSTeK Computer Inc., Cisco Systems Inc., Dell Technologies Inc., Fujitsu Ltd., Gigabyte Technology Co. Ltd., Hewlett Packard Enterprise Co., Hitachi Ltd., Huawei Technologies Co. Ltd., International Business Machines Corp., Lenovo Group Ltd., Microsoft Corp., NCR Voyix Corp., NEC Corp., Oracle Corp., SAP SE, Super Micro Computer Inc., Toshiba Corp., and Unisys Corp.
-
We can help! Our analysts can customize this high end server market research report to meet your requirements.
 RIA -
RIA - 
