High-performance Computing (HPC) For AI Market Analysis, Size, and Forecast 2026-2030: APAC (China, Japan, and India), North America (US, Canada, and Mexico), Europe (Germany, UK, and France), South America (Brazil and Argentina), Middle East and Africa (Saudi Arabia, UAE, and South Africa), and Rest of World (ROW)

High-performance Computing (HPC) For AI Market Analysis, Size, and Forecast 2026-2030:
APAC (China, Japan, and India), North America (US, Canada, and Mexico), Europe (Germany, UK, and France), South America (Brazil and Argentina), Middle East and Africa (Saudi Arabia, UAE, and South Africa), and Rest of World (ROW)

Published: Apr 2026 307 Pages SKU: IRTNTR80674

Market Overview at a Glance

$146.83 B
Market Opportunity
27.6%
CAGR 2025 - 2030
41.5%
APAC Growth
$23.43 B
Hardware segment 2024

High-performance Computing (HPC) For AI Market Size 2026-2030

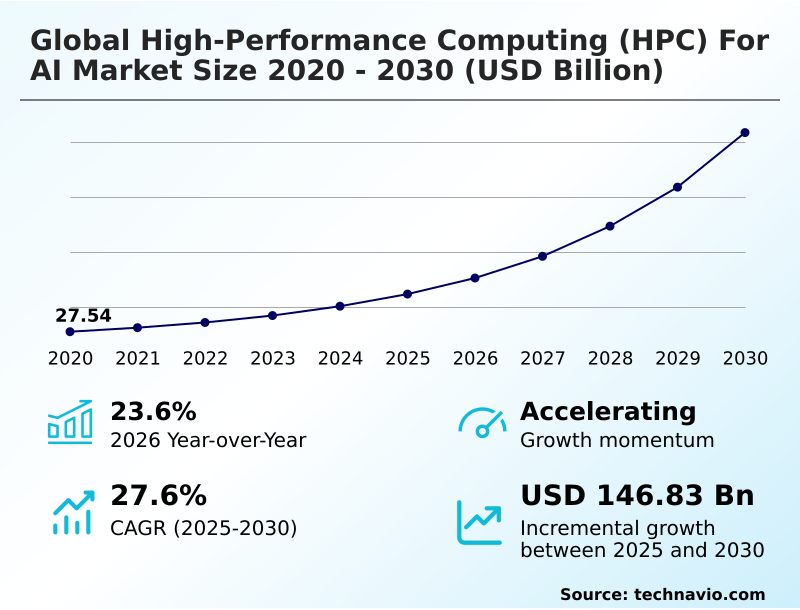
The high-performance computing (hpc) for ai market size is valued to increase by USD 146.83 billion, at a CAGR of 27.6% from 2025 to 2030. Escalating computational demands of generative AI will drive the high-performance computing (hpc) for ai market.

Major Market Trends & Insights

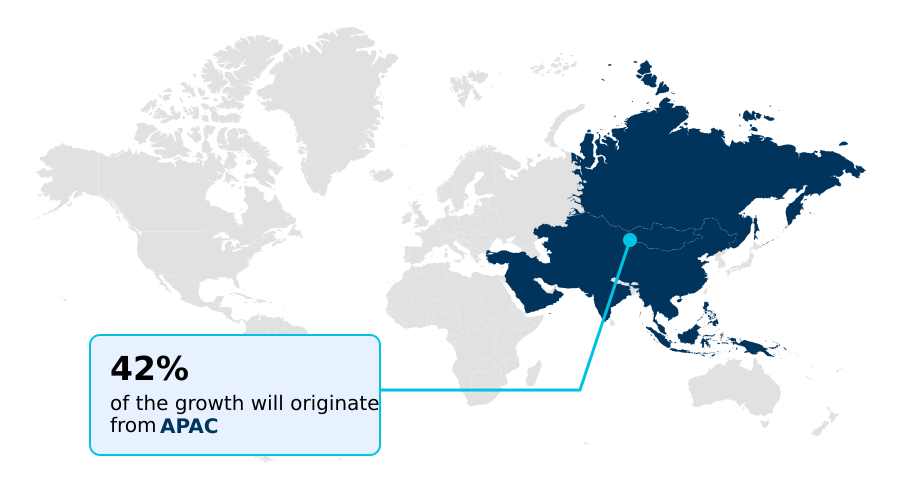
  • APAC dominated the market and accounted for a 41.5% growth during the forecast period.
  • By Component - Hardware segment was valued at USD 23.43 billion in 2024
  • By Deployment - On-premises segment accounted for the largest market revenue share in 2024

Market Size & Forecast

  • Market Opportunities: USD 181.02 billion
  • Market Future Opportunities: USD 146.83 billion
  • CAGR from 2025 to 2030 : 27.6%

Market Summary

  • The high-performance computing for AI market is defined by the integration of massive computational power with advanced algorithms to process complex datasets at exceptional speeds. This involves parallel processing architectures, such as graphics processing units and specialized AI accelerators, to enable deep learning, neural network training, and large-scale analytics.
  • Unlike standard computing, it leverages high-speed interconnects and extensive memory bandwidth to execute trillions of calculations per second. This capability is essential for innovation in fields like genomic sequencing, climate modeling, and autonomous vehicle development. For instance, in pharmaceutical research, it facilitates complex molecular docking simulations, drastically reducing the time required to identify viable drug candidates.
  • By accelerating both model training and inference, high-performance computing for AI provides a critical strategic advantage, enabling organizations to solve intricate problems that were previously computationally infeasible and forming the foundational backbone for modern scientific and industrial advancement.

What will be the Size of the High-performance Computing (HPC) For AI Market during the forecast period?

Get Key Insights on Market Forecast (PDF) Request Free Sample

How is the High-performance Computing (HPC) For AI Market Segmented?

The high-performance computing (hpc) for ai industry research report provides comprehensive data (region-wise segment analysis), with forecasts and estimates in "USD million" for the period 2026-2030, as well as historical data from 2020-2024 for the following segments.

  • Component
    • Hardware
    • Software
    • Services
  • Deployment
    • On-premises
    • Cloud
  • Industry application
    • Manufacturing
    • Industrial
    • Energy and utilities
    • Pharmaceuticals
    • Others
  • Geography
    • APAC
      • China
      • Japan
      • India
    • North America
      • US
      • Canada
      • Mexico
    • Europe
      • Germany
      • UK
      • France
    • South America
      • Brazil
      • Argentina
    • Middle East and Africa
      • Saudi Arabia
      • UAE
      • South Africa
    • Rest of World (ROW)

By Component Insights

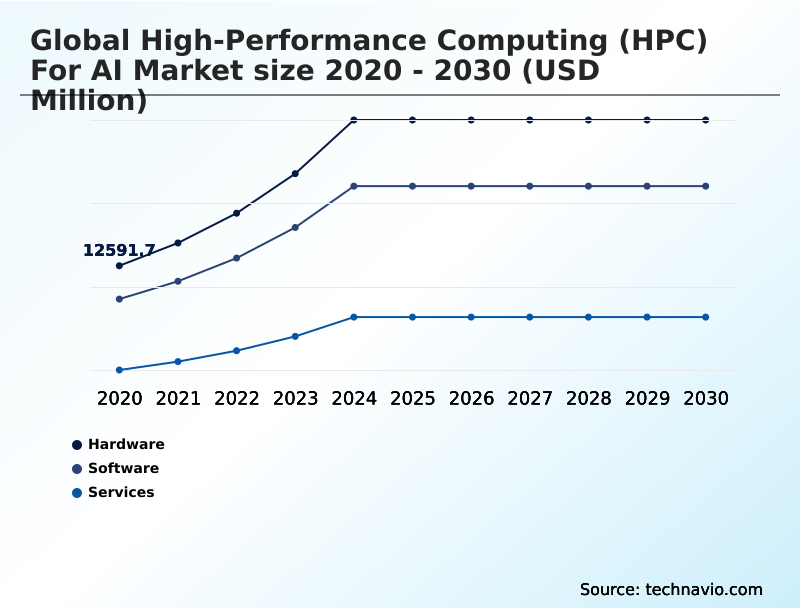
The hardware segment is estimated to witness significant growth during the forecast period.

The hardware segment forms the foundation of high-performance computing for AI, encompassing specialized accelerators and high-density servers. This category includes high-speed interconnects, advanced storage, and sophisticated thermal management systems like direct-to-chip liquid cooling.

The demand for next-generation silicon offering superior performance-per-watt is driven by a shift to heterogeneous computing environments that utilize parallel processing.

These infrastructure components are critical for real-time data analysis in autonomous systems and genomic research, with AI-driven data center infrastructure enabling a 30% reduction in thermal management costs.

As neural network complexity increases, high-bandwidth memory and low-latency networking become key differentiators, driving investment in AI inference stacks and exascale computing platforms to support advanced AI factory operations and complex digital twin simulations.

Request Free Sample

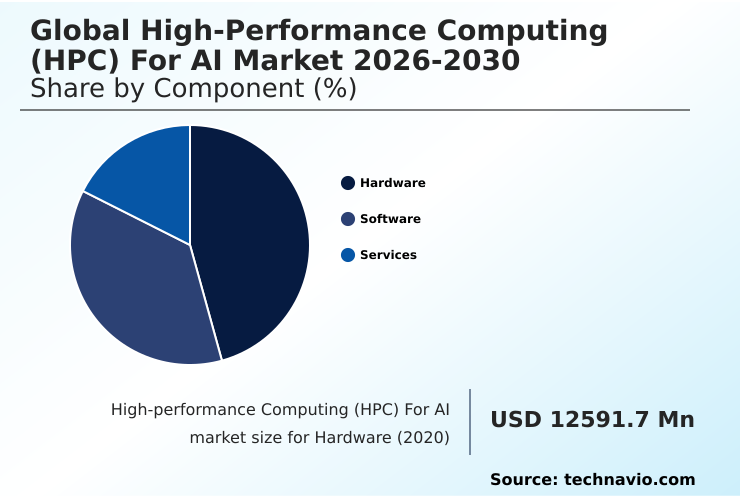
The Hardware segment was valued at USD 23.43 billion in 2024 and showed a gradual increase during the forecast period.

Request Free Sample

Regional Analysis

APAC is estimated to contribute 41.5% to the growth of the global market during the forecast period.Technavio’s analysts have elaborately explained the regional trends and drivers that shape the market during the forecast period.

See How High-performance Computing (HPC) For AI Market Demand is Rising in APAC Request Free Sample

The geographic landscape is led by North America, which is the epicenter for hyperscale data centers and semiconductor innovation, contributing over 32% of the market's incremental growth.

The APAC region is the fastest-growing, driven by national AI strategies and digital transformation, projected to account for 41.5% of market expansion. This growth is supported by a vibrant semiconductor base and the deployment of sovereign AI clouds.

In Europe, the focus is on technological sovereignty and sustainable practices, with many facilities repurposing waste heat and adopting direct-to-chip liquid cooling, which can reduce server energy use by 15%.

South America and the Middle East are emerging regions, leveraging high-performance resources for the energy sector and ambitious smart city projects, using hybrid quantum-HPC workflows for complex optimization tasks.

Market Dynamics

Our researchers analyzed the data with 2025 as the base year, along with the key drivers, trends, and challenges. A holistic analysis of drivers will help companies refine their marketing strategies to gain a competitive advantage.

  • The strategic implementation of high-performance computing for AI is increasingly focused on optimizing specific, high-value workloads, moving beyond general-purpose capabilities. For enterprises, on-premises HPC for AI security remains a primary concern, driving investment in private clusters that ensure data sovereignty and control.
  • Concurrently, the appeal of cloud-based HPC for AI scalability allows organizations to manage fluctuating computational demands without massive capital outlay. A key area of development is large-scale model training infrastructure, where innovations in high-speed interconnects and distributed file systems are critical for reducing training times.
  • In a direct comparison, businesses using optimized AI supercomputing energy efficiency protocols have reported up to a 40% reduction in power-related operational expenditures compared to those with legacy systems. This is particularly relevant in the context of AI factory operational cost reduction, where every watt saved translates to significant savings.
  • Furthermore, specialized accelerated computing for drug discovery and sovereign AI data residency solutions are becoming distinct market segments. Successfully navigating this landscape requires addressing the HPC for AI talent gap through automated cluster management tools and managed services, ensuring that the sophisticated infrastructure delivers tangible business value and a competitive edge.

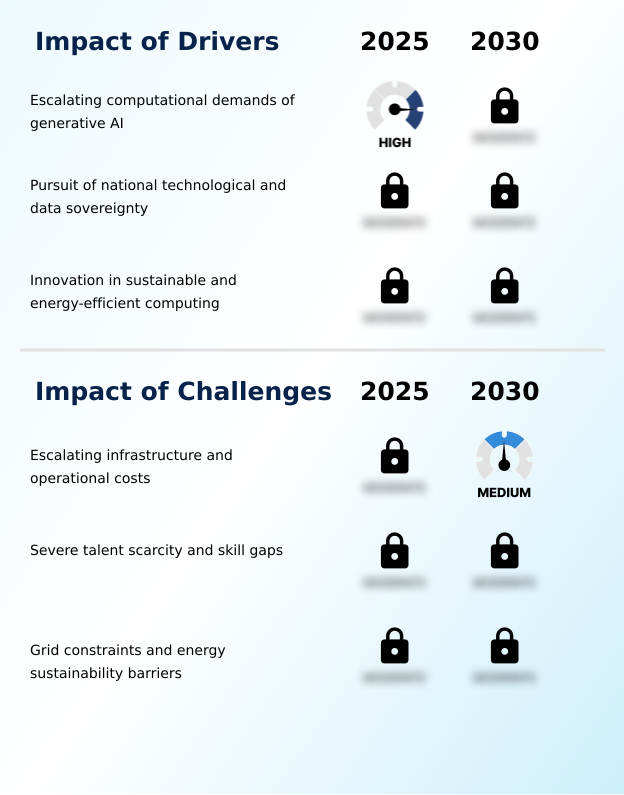
What are the key market drivers leading to the rise in the adoption of High-performance Computing (HPC) For AI Industry?

  • The primary market driver is the escalating computational demand of generative AI and large language models, which require specialized, massively parallel infrastructure.

  • The primary market driver is the unprecedented computational demand of generative artificial intelligence and large language models, necessitating a shift toward specialized AI factories.
  • These facilities utilize high-density GPU clusters and advanced interconnects to maintain competitive model performance, reducing time-to-market for new AI applications by over 50% in some sectors.
  • A second key driver is the pursuit of technological sovereignty, leading to massive investments in domestic supercomputing infrastructure and sovereign AI clouds. This trend fosters localized innovation and addresses supply chain volatility.
  • Lastly, the critical need for energy efficiency and sustainable operations has become a major driver.
  • The adoption of advanced cooling technologies and energy-optimized accelerators helps manage operational costs, as power consumption for some AI data centers can be reduced by 30% through such innovations.

What are the market trends shaping the High-performance Computing (HPC) For AI Industry?

  • A defining market trend is the structural convergence of traditional high-performance computing, neural network training, and quantum systems into a unified, hybrid computational stack. This approach addresses multidimensional problems by combining classical and quantum processing.

  • The market is defined by the convergence of traditional supercomputing, neural network training, and emerging quantum processors into a unified computational stack. This trend fosters heterogeneous architectures and hybrid quantum-HPC workflows, enabling the solution of complex problems in drug discovery and climate modeling, reducing simulation times by up to 60%.
  • The proliferation of sovereign AI clouds is another major trend, as nations invest in domestic high-performance infrastructure to ensure data residency and technological independence, supported by open-source hardware like RISC-V. Concurrently, sustainability has become a core technical requirement, driving the adoption of advanced thermal management solutions such as direct-to-chip liquid cooling.
  • This focus on green computing has led to new metrics like Power Compute Effectiveness, with some systems achieving a 40% improvement in performance-per-watt.

What challenges does the High-performance Computing (HPC) For AI Industry face during its growth?

  • A significant market challenge is the escalating capital and operational costs associated with building and maintaining cutting-edge high-performance computing infrastructure.

  • The market faces the significant challenge of escalating capital and operational expenditure, as the hardware required for trillion-parameter AI models, including AI accelerators, becomes increasingly expensive. High energy consumption and the need for advanced cooling systems create a high barrier to entry.
  • This is compounded by a severe talent shortage in niche areas like parallel programming and large-scale cluster orchestration, with reports indicating AI-related skills are the most difficult for employers to find, widening the skills gap by an estimated 25% annually. Furthermore, physical grid-scale power availability has emerged as a primary bottleneck.
  • The power density of AI-optimized racks can destabilize regional grids, transforming site selection into a critical search for available megawatts and hindering expansion despite technologies like performance-per-watt metrics.

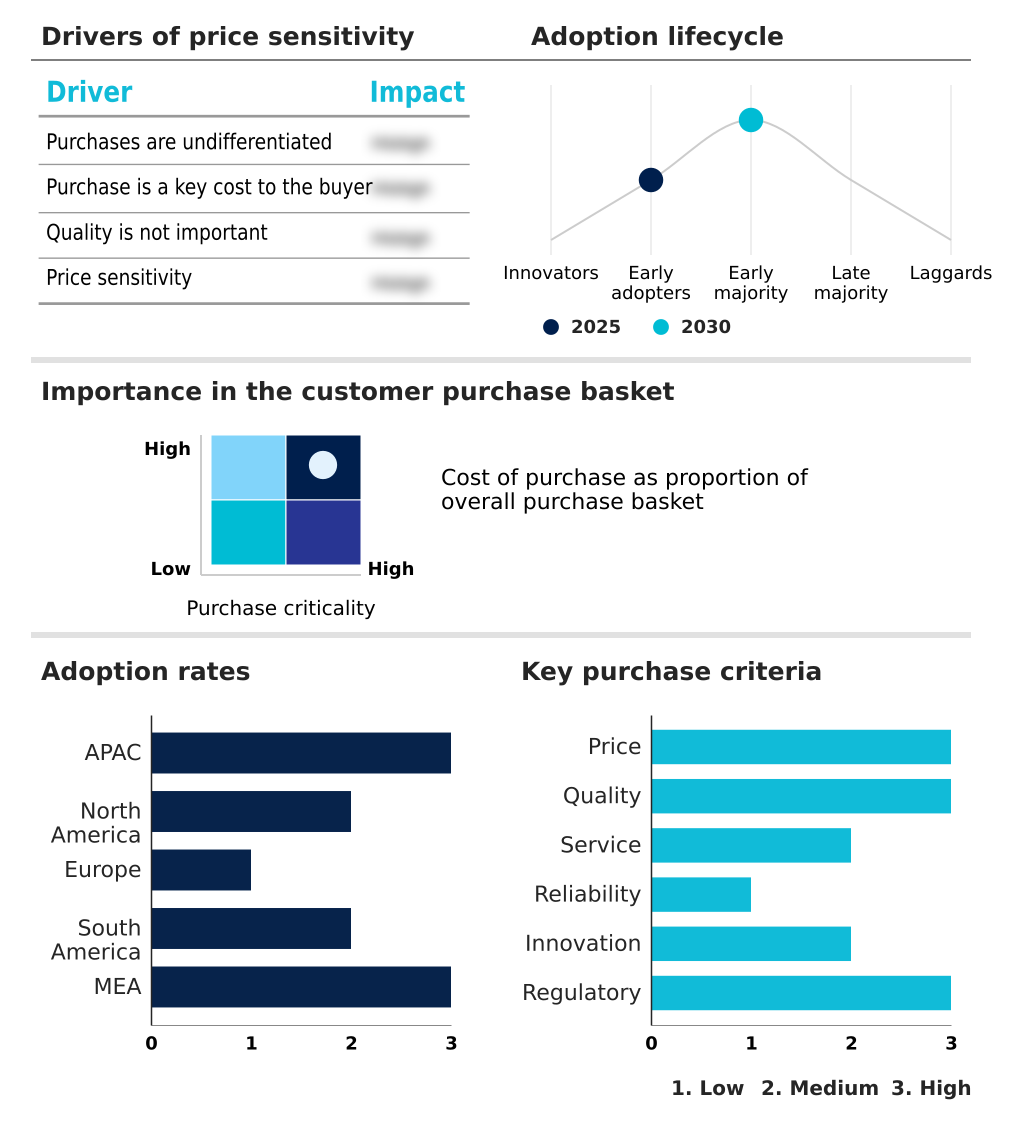
Exclusive Technavio Analysis on Customer Landscape

The high-performance computing (hpc) for ai market forecasting report includes the adoption lifecycle of the market, covering from the innovator’s stage to the laggard’s stage. It focuses on adoption rates in different regions based on penetration. Furthermore, the high-performance computing (hpc) for ai market report also includes key purchase criteria and drivers of price sensitivity to help companies evaluate and develop their market growth analysis strategies.

Customer Landscape of High-performance Computing (HPC) For AI Industry

Competitive Landscape

Companies are implementing various strategies, such as strategic alliances, high-performance computing (hpc) for ai market forecast, partnerships, mergers and acquisitions, geographical expansion, and product/service launches, to enhance their presence in the industry.

Advanced Micro Devices Inc. - Offerings center on specialized hardware and scalable infrastructure, including advanced processors, AI accelerators, and comprehensive supercomputing systems designed for complex, high-performance AI and simulation workloads.

The industry research and growth report includes detailed analyses of the competitive landscape of the market and information about key companies, including:

  • Advanced Micro Devices Inc.
  • Amazon Web Services Inc.
  • Atos SE
  • Cerebras Systems Inc.
  • Cisco Systems Inc.
  • DataDirect Networks Inc.
  • Dell Technologies Inc.
  • Fujitsu Ltd.
  • Google LLC
  • Hewlett Packard Enterprise Co.
  • IBM Corp.
  • Intel Corp.
  • Lenovo Group Ltd.
  • Microsoft Corp.
  • NEC Corp.
  • NVIDIA Corp.
  • Oracle Corp.
  • Penguin Solutions Inc.
  • SambaNova Systems Inc.
  • Super Micro Computer Inc.

Qualitative and quantitative analysis of companies has been conducted to help clients understand the wider business environment as well as the strengths and weaknesses of key industry players. Data is qualitatively analyzed to categorize companies as pure play, category-focused, industry-focused, and diversified; it is quantitatively analyzed to categorize companies as dominant, leading, strong, tentative, and weak.

Recent Development and News in High-performance computing (hpc) for ai market

  • In April, 2025, Compu Dynamics established a dedicated High-Performance Computing and Artificial Intelligence Services division to provide specialized design-build and operational support for organizations adopting data-intensive AI strategies.
  • In February, 2025, The National Oceanic and Atmospheric Administration (NOAA) highlighted its use of a unified High Performance Computing and Communications (HPCC) program to support large-scale data processing and AI-driven modeling for critical weather and climate research.
  • In October, 2025, Altair released Altair HPCWorks 2026, a significant platform update focused on enhancing AI and GPU-accelerated workloads through new features like Jupyter Notebook integration and AI-powered memory resource prediction for optimized job scheduling.
  • In November, 2025, Equinix, in collaboration with Lenovo and Merck KGaA, Darmstadt, Germany, launched a new high-performance supercomputer designed to accelerate AI-driven scientific discovery in sectors like life sciences and healthcare, hosted in an AI-ready data center in Germany.

Dive into Technavio’s robust research methodology, blending expert interviews, extensive data synthesis, and validated models for unparalleled High-performance Computing (HPC) For AI Market insights. See full methodology.

Market Scope
Page number 307
Base year 2025
Historic period 2020-2024
Forecast period 2026-2030
Growth momentum & CAGR Accelerate at a CAGR of 27.6%
Market growth 2026-2030 USD 146827.9 million
Market structure Fragmented
YoY growth 2025-2026(%) 23.6%
Key countries China, Japan, India, South Korea, Australia, Indonesia, US, Canada, Mexico, Germany, UK, France, Italy, Spain, The Netherlands, Brazil, Argentina, Chile, Saudi Arabia, UAE, South Africa, Israel and Turkey
Competitive landscape Leading Companies, Market Positioning of Companies, Competitive Strategies, and Industry Risks

Request Free Sample

Research Analyst Overview

  • The market's evolution is driven by the convergence of exascale computing capabilities with the demands of generative artificial intelligence, creating a need for specialized AI factories. These environments rely on massive parallel processing and high-density GPU clusters to handle multi-modal data streams and train large language models.
  • A key development is the shift toward heterogeneous architectures that combine traditional CPUs with AI accelerators and, in experimental cases, quantum processors. This move is supported by advanced interconnects and high-bandwidth memory to overcome communication bottlenecks.
  • For boardroom consideration, the adoption of sustainability-first designs, such as direct-to-chip liquid cooling and immersion systems, is now a critical budgetary and compliance factor, as organizations have demonstrated a 40% reduction in data center cooling energy.
  • The pursuit of sovereign AI clouds also reflects a strategic pivot toward data residency and technological independence, requiring modular infrastructure and domestically designed chips to foster secure, localized innovation ecosystems.

What are the Key Data Covered in this High-performance Computing (HPC) For AI Market Research and Growth Report?

  • What is the expected growth of the High-performance Computing (HPC) For AI Market between 2026 and 2030?

    • USD 146.83 billion, at a CAGR of 27.6%

  • What segmentation does the market report cover?

    • The report is segmented by Component (Hardware, Software, and Services), Deployment (On-premises, and Cloud), Industry Application (Manufacturing, Industrial, Energy and utilities, Pharmaceuticals, and Others) and Geography (APAC, North America, Europe, South America, Middle East and Africa)

  • Which regions are analyzed in the report?

    • APAC, North America, Europe, South America and Middle East and Africa

  • What are the key growth drivers and market challenges?

    • Escalating computational demands of generative AI, Escalating infrastructure and operational costs

  • Who are the major players in the High-performance Computing (HPC) For AI Market?

    • Advanced Micro Devices Inc., Amazon Web Services Inc., Atos SE, Cerebras Systems Inc., Cisco Systems Inc., DataDirect Networks Inc., Dell Technologies Inc., Fujitsu Ltd., Google LLC, Hewlett Packard Enterprise Co., IBM Corp., Intel Corp., Lenovo Group Ltd., Microsoft Corp., NEC Corp., NVIDIA Corp., Oracle Corp., Penguin Solutions Inc., SambaNova Systems Inc. and Super Micro Computer Inc.

Market Research Insights

  • Market dynamics are shaped by the dual demands for computational power and operational efficiency, leading to the adoption of heterogeneous computing and innovative modular data center designs. The development of AI-driven data center management tools has improved power usage effectiveness by over 35% in some deployments.
  • As organizations prioritize sustainability, the use of low-latency networking and energy-aware job scheduling has become standard. This focus is not just on raw processing speed but also on achieving superior performance-per-watt, a metric where advanced immersion systems can reduce cooling energy consumption by up to 90% compared to traditional air-based methods.
  • This shift toward sustainability-first architectures, including AI inference stacks optimized for low power, is crucial for managing the escalating energy needs of modern AI factories.

We can help! Our analysts can customize this high-performance computing (hpc) for ai market research report to meet your requirements.

Get in touch

1. Executive Summary

1.1 Market overview

Executive Summary - Chart on Market Overview
Executive Summary - Data Table on Market Overview
Executive Summary - Chart on Global Market Characteristics
Executive Summary - Chart on Market by Geography
Executive Summary - Chart on Market Segmentation by Component
Executive Summary - Chart on Market Segmentation by Deployment
Executive Summary - Chart on Market Segmentation by Industry Application
Executive Summary - Chart on Incremental Growth
Executive Summary - Data Table on Incremental Growth
Executive Summary - Chart on Company Market Positioning

2. Technavio Analysis

2.1 Analysis of price sensitivity, lifecycle, customer purchase basket, adoption rates, and purchase criteria

2.2 Criticality of inputs and Factors of differentiation

Chart on Overview on criticality of inputs and factors of differentiation

2.3 Factors of disruption

Chart on Overview on factors of disruption

2.4 Impact of drivers and challenges

Chart on Impact of drivers and challenges in 2025 and 2030

3. Market Landscape

3.1 Market ecosystem

Chart on Parent Market
Data Table on - Parent Market

3.2 Market characteristics

Chart on Market characteristics analysis

3.3 Value chain analysis

Chart on Value chain analysis

4. Market Sizing

4.1 Market definition

Data Table on Offerings of companies included in the market definition

4.2 Market segment analysis

Market segments

4.3 Market size 2025

4.4 Market outlook: Forecast for 2025-2030

Chart on Global - Market size and forecast 2025-2030 ($ million)
Data Table on Global - Market size and forecast 2025-2030 ($ million)
Chart on Global Market: Year-over-year growth 2025-2030 (%)
Data Table on Global Market: Year-over-year growth 2025-2030 (%)

5. Historic Market Size

5.1 Global High-Performance Computing (HPC) For AI Market 2020 - 2024

Historic Market Size - Data Table on Global High-Performance Computing (HPC) For AI Market 2020 - 2024 ($ million)

5.2 Component segment analysis 2020 - 2024

Historic Market Size - Component Segment 2020 - 2024 ($ million)

5.3 Deployment segment analysis 2020 - 2024

Historic Market Size - Deployment Segment 2020 - 2024 ($ million)

5.4 Industry Application segment analysis 2020 - 2024

Historic Market Size - Industry Application Segment 2020 - 2024 ($ million)

5.5 Geography segment analysis 2020 - 2024

Historic Market Size - Geography Segment 2020 - 2024 ($ million)

5.6 Country segment analysis 2020 - 2024

Historic Market Size - Country Segment 2020 - 2024 ($ million)

6. Qualitative Analysis

6.1 Impact of Geopolitical Conflict for Global High-Performance Computing (HPC) for AI Market

7. Five Forces Analysis

7.1 Five forces summary

Five forces analysis - Comparison between 2025 and 2030

7.2 Bargaining power of buyers

Bargaining power of buyers - Impact of key factors 2025 and 2030

7.3 Bargaining power of suppliers

Bargaining power of suppliers - Impact of key factors in 2025 and 2030

7.4 Threat of new entrants

Threat of new entrants - Impact of key factors in 2025 and 2030

7.5 Threat of substitutes

Threat of substitutes - Impact of key factors in 2025 and 2030

7.6 Threat of rivalry

Threat of rivalry - Impact of key factors in 2025 and 2030

7.7 Market condition

Chart on Market condition - Five forces 2025 and 2030

8. Market Segmentation by Component

8.1 Market segments

Chart on Component - Market share 2025-2030 (%)
Data Table on Component - Market share 2025-2030 (%)

8.2 Comparison by Component

Chart on Comparison by Component
Data Table on Comparison by Component

8.3 Hardware - Market size and forecast 2025-2030

Chart on Hardware - Market size and forecast 2025-2030 ($ million)
Data Table on Hardware - Market size and forecast 2025-2030 ($ million)
Chart on Hardware - Year-over-year growth 2025-2030 (%)
Data Table on Hardware - Year-over-year growth 2025-2030 (%)

8.4 Software - Market size and forecast 2025-2030

Chart on Software - Market size and forecast 2025-2030 ($ million)
Data Table on Software - Market size and forecast 2025-2030 ($ million)
Chart on Software - Year-over-year growth 2025-2030 (%)
Data Table on Software - Year-over-year growth 2025-2030 (%)

8.5 Services - Market size and forecast 2025-2030

Chart on Services - Market size and forecast 2025-2030 ($ million)
Data Table on Services - Market size and forecast 2025-2030 ($ million)
Chart on Services - Year-over-year growth 2025-2030 (%)
Data Table on Services - Year-over-year growth 2025-2030 (%)

8.6 Market opportunity by Component

Market opportunity by Component ($ million)
Data Table on Market opportunity by Component ($ million)

9. Market Segmentation by Deployment

9.1 Market segments

Chart on Deployment - Market share 2025-2030 (%)
Data Table on Deployment - Market share 2025-2030 (%)

9.2 Comparison by Deployment

Chart on Comparison by Deployment
Data Table on Comparison by Deployment

9.3 On-premises - Market size and forecast 2025-2030

Chart on On-premises - Market size and forecast 2025-2030 ($ million)
Data Table on On-premises - Market size and forecast 2025-2030 ($ million)
Chart on On-premises - Year-over-year growth 2025-2030 (%)
Data Table on On-premises - Year-over-year growth 2025-2030 (%)

9.4 Cloud - Market size and forecast 2025-2030

Chart on Cloud - Market size and forecast 2025-2030 ($ million)
Data Table on Cloud - Market size and forecast 2025-2030 ($ million)
Chart on Cloud - Year-over-year growth 2025-2030 (%)
Data Table on Cloud - Year-over-year growth 2025-2030 (%)

9.5 Market opportunity by Deployment

Market opportunity by Deployment ($ million)
Data Table on Market opportunity by Deployment ($ million)

10. Market Segmentation by Industry Application

10.1 Market segments

Chart on Industry Application - Market share 2025-2030 (%)
Data Table on Industry Application - Market share 2025-2030 (%)

10.2 Comparison by Industry Application

Chart on Comparison by Industry Application
Data Table on Comparison by Industry Application

10.3 Manufacturing - Market size and forecast 2025-2030

Chart on Manufacturing - Market size and forecast 2025-2030 ($ million)
Data Table on Manufacturing - Market size and forecast 2025-2030 ($ million)
Chart on Manufacturing - Year-over-year growth 2025-2030 (%)
Data Table on Manufacturing - Year-over-year growth 2025-2030 (%)

10.4 Industrial - Market size and forecast 2025-2030

Chart on Industrial - Market size and forecast 2025-2030 ($ million)
Data Table on Industrial - Market size and forecast 2025-2030 ($ million)
Chart on Industrial - Year-over-year growth 2025-2030 (%)
Data Table on Industrial - Year-over-year growth 2025-2030 (%)

10.5 Energy and utilities - Market size and forecast 2025-2030

Chart on Energy and utilities - Market size and forecast 2025-2030 ($ million)
Data Table on Energy and utilities - Market size and forecast 2025-2030 ($ million)
Chart on Energy and utilities - Year-over-year growth 2025-2030 (%)
Data Table on Energy and utilities - Year-over-year growth 2025-2030 (%)

10.6 Pharmaceuticals - Market size and forecast 2025-2030

Chart on Pharmaceuticals - Market size and forecast 2025-2030 ($ million)
Data Table on Pharmaceuticals - Market size and forecast 2025-2030 ($ million)
Chart on Pharmaceuticals - Year-over-year growth 2025-2030 (%)
Data Table on Pharmaceuticals - Year-over-year growth 2025-2030 (%)

10.7 Others - Market size and forecast 2025-2030

Chart on Others - Market size and forecast 2025-2030 ($ million)
Data Table on Others - Market size and forecast 2025-2030 ($ million)
Chart on Others - Year-over-year growth 2025-2030 (%)
Data Table on Others - Year-over-year growth 2025-2030 (%)

10.8 Market opportunity by Industry Application

Market opportunity by Industry Application ($ million)
Data Table on Market opportunity by Industry Application ($ million)

11. Customer Landscape

11.1 Customer landscape overview

Analysis of price sensitivity, lifecycle, customer purchase basket, adoption rates, and purchase criteria

12. Geographic Landscape

12.1 Geographic segmentation

Chart on Market share by geography 2025-2030 (%)
Data Table on Market share by geography 2025-2030 (%)

12.2 Geographic comparison

Chart on Geographic comparison
Data Table on Geographic comparison

12.3 APAC - Market size and forecast 2025-2030

Chart on APAC - Market size and forecast 2025-2030 ($ million)
Data Table on APAC - Market size and forecast 2025-2030 ($ million)
Chart on APAC - Year-over-year growth 2025-2030 (%)
Data Table on APAC - Year-over-year growth 2025-2030 (%)
Chart on Regional Comparison - APAC
Data Table on Regional Comparison - APAC

12.3.1 China - Market size and forecast 2025-2030

Chart on China - Market size and forecast 2025-2030 ($ million)
Data Table on China - Market size and forecast 2025-2030 ($ million)
Chart on China - Year-over-year growth 2025-2030 (%)
Data Table on China - Year-over-year growth 2025-2030 (%)

12.3.2 Japan - Market size and forecast 2025-2030

Chart on Japan - Market size and forecast 2025-2030 ($ million)
Data Table on Japan - Market size and forecast 2025-2030 ($ million)
Chart on Japan - Year-over-year growth 2025-2030 (%)
Data Table on Japan - Year-over-year growth 2025-2030 (%)

12.3.3 India - Market size and forecast 2025-2030

Chart on India - Market size and forecast 2025-2030 ($ million)
Data Table on India - Market size and forecast 2025-2030 ($ million)
Chart on India - Year-over-year growth 2025-2030 (%)
Data Table on India - Year-over-year growth 2025-2030 (%)

12.3.4 South Korea - Market size and forecast 2025-2030

Chart on South Korea - Market size and forecast 2025-2030 ($ million)
Data Table on South Korea - Market size and forecast 2025-2030 ($ million)
Chart on South Korea - Year-over-year growth 2025-2030 (%)
Data Table on South Korea - Year-over-year growth 2025-2030 (%)

12.3.5 Australia - Market size and forecast 2025-2030

Chart on Australia - Market size and forecast 2025-2030 ($ million)
Data Table on Australia - Market size and forecast 2025-2030 ($ million)
Chart on Australia - Year-over-year growth 2025-2030 (%)
Data Table on Australia - Year-over-year growth 2025-2030 (%)

12.3.6 Indonesia - Market size and forecast 2025-2030

Chart on Indonesia - Market size and forecast 2025-2030 ($ million)
Data Table on Indonesia - Market size and forecast 2025-2030 ($ million)
Chart on Indonesia - Year-over-year growth 2025-2030 (%)
Data Table on Indonesia - Year-over-year growth 2025-2030 (%)

12.4 North America - Market size and forecast 2025-2030

Chart on North America - Market size and forecast 2025-2030 ($ million)
Data Table on North America - Market size and forecast 2025-2030 ($ million)
Chart on North America - Year-over-year growth 2025-2030 (%)
Data Table on North America - Year-over-year growth 2025-2030 (%)
Chart on Regional Comparison - North America
Data Table on Regional Comparison - North America

12.4.1 US - Market size and forecast 2025-2030

Chart on US - Market size and forecast 2025-2030 ($ million)
Data Table on US - Market size and forecast 2025-2030 ($ million)
Chart on US - Year-over-year growth 2025-2030 (%)
Data Table on US - Year-over-year growth 2025-2030 (%)

12.4.2 Canada - Market size and forecast 2025-2030

Chart on Canada - Market size and forecast 2025-2030 ($ million)
Data Table on Canada - Market size and forecast 2025-2030 ($ million)
Chart on Canada - Year-over-year growth 2025-2030 (%)
Data Table on Canada - Year-over-year growth 2025-2030 (%)

12.4.3 Mexico - Market size and forecast 2025-2030

Chart on Mexico - Market size and forecast 2025-2030 ($ million)
Data Table on Mexico - Market size and forecast 2025-2030 ($ million)
Chart on Mexico - Year-over-year growth 2025-2030 (%)
Data Table on Mexico - Year-over-year growth 2025-2030 (%)

12.5 Europe - Market size and forecast 2025-2030

Chart on Europe - Market size and forecast 2025-2030 ($ million)
Data Table on Europe - Market size and forecast 2025-2030 ($ million)
Chart on Europe - Year-over-year growth 2025-2030 (%)
Data Table on Europe - Year-over-year growth 2025-2030 (%)
Chart on Regional Comparison - Europe
Data Table on Regional Comparison - Europe

12.5.1 Germany - Market size and forecast 2025-2030

Chart on Germany - Market size and forecast 2025-2030 ($ million)
Data Table on Germany - Market size and forecast 2025-2030 ($ million)
Chart on Germany - Year-over-year growth 2025-2030 (%)
Data Table on Germany - Year-over-year growth 2025-2030 (%)

12.5.2 UK - Market size and forecast 2025-2030

Chart on UK - Market size and forecast 2025-2030 ($ million)
Data Table on UK - Market size and forecast 2025-2030 ($ million)
Chart on UK - Year-over-year growth 2025-2030 (%)
Data Table on UK - Year-over-year growth 2025-2030 (%)

12.5.3 France - Market size and forecast 2025-2030

Chart on France - Market size and forecast 2025-2030 ($ million)
Data Table on France - Market size and forecast 2025-2030 ($ million)
Chart on France - Year-over-year growth 2025-2030 (%)
Data Table on France - Year-over-year growth 2025-2030 (%)

12.5.4 Italy - Market size and forecast 2025-2030

Chart on Italy - Market size and forecast 2025-2030 ($ million)
Data Table on Italy - Market size and forecast 2025-2030 ($ million)
Chart on Italy - Year-over-year growth 2025-2030 (%)
Data Table on Italy - Year-over-year growth 2025-2030 (%)

12.5.5 Spain - Market size and forecast 2025-2030

Chart on Spain - Market size and forecast 2025-2030 ($ million)
Data Table on Spain - Market size and forecast 2025-2030 ($ million)
Chart on Spain - Year-over-year growth 2025-2030 (%)
Data Table on Spain - Year-over-year growth 2025-2030 (%)

12.5.6 The Netherlands - Market size and forecast 2025-2030

Chart on The Netherlands - Market size and forecast 2025-2030 ($ million)
Data Table on The Netherlands - Market size and forecast 2025-2030 ($ million)
Chart on The Netherlands - Year-over-year growth 2025-2030 (%)
Data Table on The Netherlands - Year-over-year growth 2025-2030 (%)

12.6 South America - Market size and forecast 2025-2030

Chart on South America - Market size and forecast 2025-2030 ($ million)
Data Table on South America - Market size and forecast 2025-2030 ($ million)
Chart on South America - Year-over-year growth 2025-2030 (%)
Data Table on South America - Year-over-year growth 2025-2030 (%)
Chart on Regional Comparison - South America
Data Table on Regional Comparison - South America

12.6.1 Brazil - Market size and forecast 2025-2030

Chart on Brazil - Market size and forecast 2025-2030 ($ million)
Data Table on Brazil - Market size and forecast 2025-2030 ($ million)
Chart on Brazil - Year-over-year growth 2025-2030 (%)
Data Table on Brazil - Year-over-year growth 2025-2030 (%)

12.6.2 Argentina - Market size and forecast 2025-2030

Chart on Argentina - Market size and forecast 2025-2030 ($ million)
Data Table on Argentina - Market size and forecast 2025-2030 ($ million)
Chart on Argentina - Year-over-year growth 2025-2030 (%)
Data Table on Argentina - Year-over-year growth 2025-2030 (%)

12.6.3 Chile - Market size and forecast 2025-2030

Chart on Chile - Market size and forecast 2025-2030 ($ million)
Data Table on Chile - Market size and forecast 2025-2030 ($ million)
Chart on Chile - Year-over-year growth 2025-2030 (%)
Data Table on Chile - Year-over-year growth 2025-2030 (%)

12.7 Middle East and Africa - Market size and forecast 2025-2030

Chart on Middle East and Africa - Market size and forecast 2025-2030 ($ million)
Data Table on Middle East and Africa - Market size and forecast 2025-2030 ($ million)
Chart on Middle East and Africa - Year-over-year growth 2025-2030 (%)
Data Table on Middle East and Africa - Year-over-year growth 2025-2030 (%)
Chart on Regional Comparison - Middle East and Africa
Data Table on Regional Comparison - Middle East and Africa

12.7.1 Saudi Arabia - Market size and forecast 2025-2030

Chart on Saudi Arabia - Market size and forecast 2025-2030 ($ million)
Data Table on Saudi Arabia - Market size and forecast 2025-2030 ($ million)
Chart on Saudi Arabia - Year-over-year growth 2025-2030 (%)
Data Table on Saudi Arabia - Year-over-year growth 2025-2030 (%)

12.7.2 UAE - Market size and forecast 2025-2030

Chart on UAE - Market size and forecast 2025-2030 ($ million)
Data Table on UAE - Market size and forecast 2025-2030 ($ million)
Chart on UAE - Year-over-year growth 2025-2030 (%)
Data Table on UAE - Year-over-year growth 2025-2030 (%)

12.7.3 South Africa - Market size and forecast 2025-2030

Chart on South Africa - Market size and forecast 2025-2030 ($ million)
Data Table on South Africa - Market size and forecast 2025-2030 ($ million)
Chart on South Africa - Year-over-year growth 2025-2030 (%)
Data Table on South Africa - Year-over-year growth 2025-2030 (%)

12.7.4 Israel - Market size and forecast 2025-2030

Chart on Israel - Market size and forecast 2025-2030 ($ million)
Data Table on Israel - Market size and forecast 2025-2030 ($ million)
Chart on Israel - Year-over-year growth 2025-2030 (%)
Data Table on Israel - Year-over-year growth 2025-2030 (%)

12.7.5 Turkey - Market size and forecast 2025-2030

Chart on Turkey - Market size and forecast 2025-2030 ($ million)
Data Table on Turkey - Market size and forecast 2025-2030 ($ million)
Chart on Turkey - Year-over-year growth 2025-2030 (%)
Data Table on Turkey - Year-over-year growth 2025-2030 (%)

12.8 Market opportunity by geography

Market opportunity by geography ($ million)
Data Tables on Market opportunity by geography ($ million)

13. Drivers, Challenges, and Opportunity

13.1 Market drivers

Escalating computational demands of generative AI
Pursuit of national technological and data sovereignty
Innovation in sustainable and energy-efficient computing

13.2 Market challenges

Escalating infrastructure and operational costs
Severe talent scarcity and skill gaps
Grid constraints and energy sustainability barriers

13.3 Impact of drivers and challenges

Impact of drivers and challenges in 2025 and 2030

13.4 Market opportunities

Convergence of high-performance computing, AI, and quantum systems
Emergence of sovereign AI clouds and tech-sovereignty initiatives
Evolution of sustainability-first data center architectures

14. Competitive Landscape

14.1 Overview

14.2

Overview on criticality of inputs and factors of differentiation

14.3 Landscape disruption

Overview on factors of disruption

14.4 Industry risks

Impact of key risks on business

15. Competitive Analysis

15.1 Companies profiled

Companies covered

15.2 Company ranking index

15.3 Market positioning of companies

Matrix on companies position and classification

15.4 Advanced Micro Devices Inc.

Advanced Micro Devices Inc. - Overview
Advanced Micro Devices Inc. - Business segments
Advanced Micro Devices Inc. - Key news
Advanced Micro Devices Inc. - Key offerings
Advanced Micro Devices Inc. - Segment focus
SWOT

15.5 Amazon Web Services Inc.

Amazon Web Services Inc. - Overview
Amazon Web Services Inc. - Product / Service
Amazon Web Services Inc. - Key offerings
SWOT

15.6 Atos SE

Atos SE - Overview
Atos SE - Business segments
Atos SE - Key offerings
Atos SE - Segment focus
SWOT

15.7 Cisco Systems Inc.

Cisco Systems Inc. - Overview
Cisco Systems Inc. - Business segments
Cisco Systems Inc. - Key news
Cisco Systems Inc. - Key offerings
Cisco Systems Inc. - Segment focus
SWOT

15.8 Dell Technologies Inc.

Dell Technologies Inc. - Overview
Dell Technologies Inc. - Business segments
Dell Technologies Inc. - Key news
Dell Technologies Inc. - Key offerings
Dell Technologies Inc. - Segment focus
SWOT

15.9 Fujitsu Ltd.

Fujitsu Ltd. - Overview
Fujitsu Ltd. - Business segments
Fujitsu Ltd. - Key offerings
Fujitsu Ltd. - Segment focus
SWOT

15.10 Hewlett Packard Enterprise Co.

Hewlett Packard Enterprise Co. - Overview
Hewlett Packard Enterprise Co. - Business segments
Hewlett Packard Enterprise Co. - Key news
Hewlett Packard Enterprise Co. - Key offerings
Hewlett Packard Enterprise Co. - Segment focus
SWOT

15.11 IBM Corp.

IBM Corp. - Overview
IBM Corp. - Business segments
IBM Corp. - Key news
IBM Corp. - Key offerings
IBM Corp. - Segment focus
SWOT

15.12 Intel Corp.

Intel Corp. - Overview
Intel Corp. - Business segments
Intel Corp. - Key news
Intel Corp. - Key offerings
Intel Corp. - Segment focus
SWOT

15.13 Lenovo Group Ltd.

Lenovo Group Ltd. - Overview
Lenovo Group Ltd. - Business segments
Lenovo Group Ltd. - Key offerings
Lenovo Group Ltd. - Segment focus
SWOT

15.14 Microsoft Corp.

Microsoft Corp. - Overview
Microsoft Corp. - Business segments
Microsoft Corp. - Key news
Microsoft Corp. - Key offerings
Microsoft Corp. - Segment focus
SWOT

15.15 NVIDIA Corp.

NVIDIA Corp. - Overview
NVIDIA Corp. - Business segments
NVIDIA Corp. - Key news
NVIDIA Corp. - Key offerings
NVIDIA Corp. - Segment focus
SWOT

15.16 Oracle Corp.

Oracle Corp. - Overview
Oracle Corp. - Business segments
Oracle Corp. - Key news
Oracle Corp. - Key offerings
Oracle Corp. - Segment focus
SWOT

15.17 Penguin Solutions Inc.

Penguin Solutions Inc. - Overview
Penguin Solutions Inc. - Business segments
Penguin Solutions Inc. - Key news
Penguin Solutions Inc. - Key offerings
Penguin Solutions Inc. - Segment focus
SWOT

15.18 Super Micro Computer Inc.

Super Micro Computer Inc. - Overview
Super Micro Computer Inc. - Business segments
Super Micro Computer Inc. - Key offerings
Super Micro Computer Inc. - Segment focus
SWOT

16. Appendix

16.1 Scope of the report

Market definition
Objectives
Notes and caveats

16.2 Inclusions and exclusions checklist

Inclusions checklist
Exclusions checklist

16.3 Currency conversion rates for US$

16.4 Research methodology

16.5 Data procurement

Information sources

16.6 Data validation

16.7 Validation techniques employed for market sizing

16.8 Data synthesis

16.9 360 degree market analysis

16.10 List of abbreviations

Research Methodology

Technavio presents a detailed picture of the market by way of study, synthesis, and summation of data from multiple sources. The analysts have presented the various facets of the market with a particular focus on identifying the key industry influencers. The data thus presented is comprehensive, reliable, and the result of extensive research, both primary and secondary.

INFORMATION SOURCES

Primary sources

  • Manufacturers and suppliers
  • Channel partners
  • Industry experts
  • Strategic decision makers

Secondary sources

  • Industry journals and periodicals
  • Government data
  • Financial reports of key industry players
  • Historical data
  • Press releases

DATA ANALYSIS

Data Synthesis

  • Collation of data
  • Estimation of key figures
  • Analysis of derived insights

Data Validation

  • Triangulation with data models
  • Reference against proprietary databases
  • Corroboration with industry experts

REPORT WRITING

Qualitative

  • Market drivers
  • Market challenges
  • Market trends
  • Five forces analysis

Quantitative

  • Market size and forecast
  • Market segmentation
  • Geographical insights
  • Competitive landscape

Interested in this report?

Get your sample now to see our research methodology and insights!

Download Now

Frequently Asked Questions

High-performance Computing (HPC) For AI market growth will increase by USD 146827.9 million during 2026-2030.

The High-performance Computing (HPC) For AI market is expected to grow at a CAGR of 27.6% during 2026-2030.

High-performance Computing (HPC) For AI market is segmented by Component (Hardware, Software, Services) Deployment (On-premises, Cloud) Industry application (Manufacturing, Industrial, Energy and utilities, Pharmaceuticals, Others)

Advanced Micro Devices Inc., Amazon Web Services Inc., Atos SE, Cerebras Systems Inc., Cisco Systems Inc., DataDirect Networks Inc., Dell Technologies Inc., Fujitsu Ltd., Google LLC, Hewlett Packard Enterprise Co., IBM Corp., Intel Corp., Lenovo Group Ltd., Microsoft Corp., NEC Corp., NVIDIA Corp., Oracle Corp., Penguin Solutions Inc., SambaNova Systems Inc., Super Micro Computer Inc. are a few of the key vendors in the High-performance Computing (HPC) For AI market.

APAC will register the highest growth rate of 41.5% among the other regions. Therefore, the High-performance Computing (HPC) For AI market in APAC is expected to garner significant business opportunities for the vendors during the forecast period.

China, Japan, India, South Korea, Australia, Indonesia, US, Canada, Mexico, Germany, UK, France, Italy, Spain, The Netherlands, Brazil, Argentina, Chile, Saudi Arabia, UAE, South Africa, Israel, Turkey

  • Escalating computational demands of generative AI is the driving factor this market.

The High-performance Computing (HPC) For AI market vendors should focus on grabbing business opportunities from the Component segment as it accounted for the largest market share in the base year.
RIA - Research AI Assistant
Ask RIA