Hot Drink Market Analysis, Size, and Forecast 2026-2030: APAC (China, Japan, and India), North America (US, Canada, and Mexico), Europe (Germany, UK, and France), South America (Brazil and Argentina), Middle East and Africa (Saudi Arabia, UAE, and South Africa), and Rest of World (ROW)

Hot Drink Market Analysis, Size, and Forecast 2026-2030:
APAC (China, Japan, and India), North America (US, Canada, and Mexico), Europe (Germany, UK, and France), South America (Brazil and Argentina), Middle East and Africa (Saudi Arabia, UAE, and South Africa), and Rest of World (ROW)

Published: Apr 2026 290 Pages SKU: IRTNTR76870

Market Overview at a Glance

$101.3 B
Market Opportunity
6.5%
CAGR 2025 - 2030
36.9%
APAC Growth
$202.1 B
Offline segment 2024

Hot Drink Market Size 2026-2030

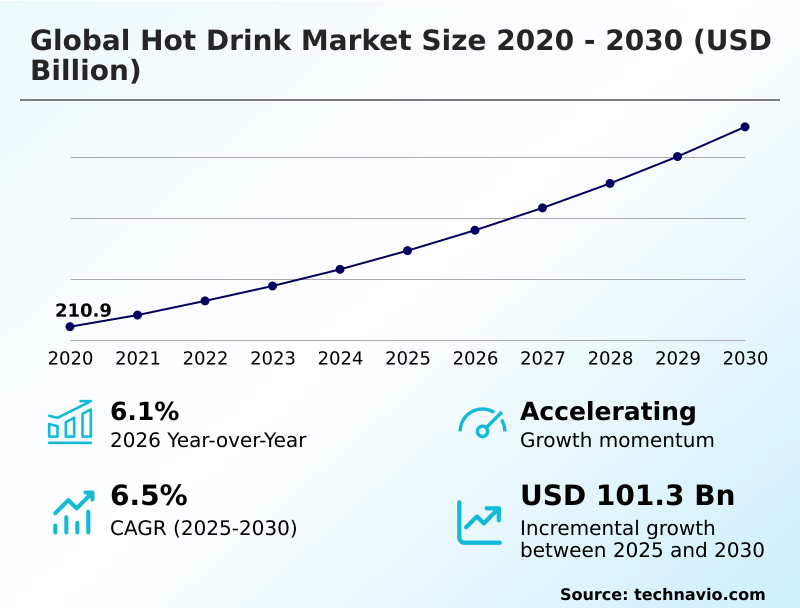
The hot drink market size is valued to increase by USD 101.3 billion, at a CAGR of 6.5% from 2025 to 2030. Rising demand for premium and artisanal hot drink varieties will drive the hot drink market.

Major Market Trends & Insights

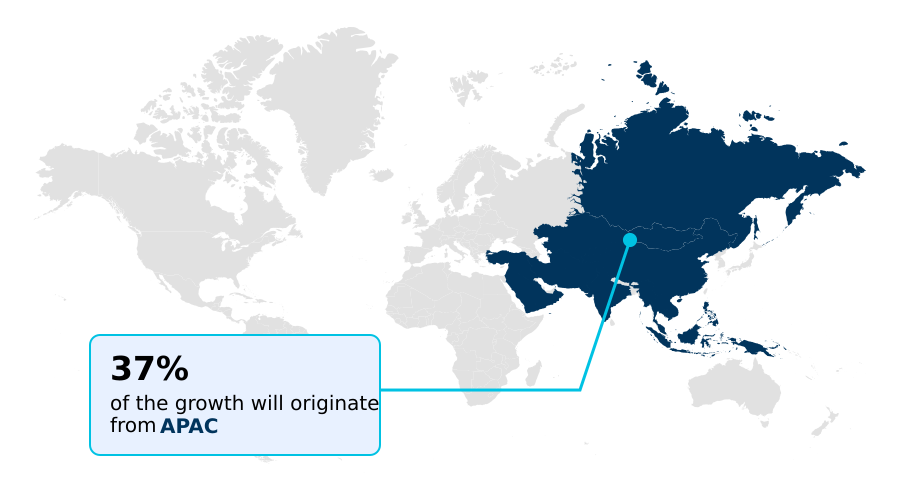
  • APAC dominated the market and accounted for a 36.9% growth during the forecast period.
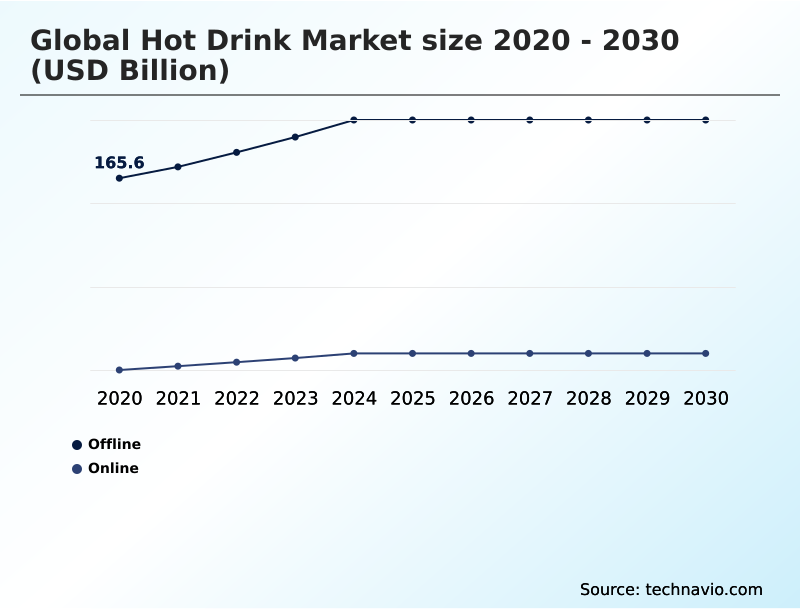
  • By Distribution Channel - Offline segment was valued at USD 202.1 billion in 2024
  • By Type - Coffee segment accounted for the largest market revenue share in 2024

Market Size & Forecast

  • Market Opportunities: USD 163.5 billion
  • Market Future Opportunities: USD 101.3 billion
  • CAGR from 2025 to 2030 : 6.5%

Market Summary

  • The Hot Drink Market is undergoing a significant transformation, driven by evolving consumer preferences and technological innovation. A primary driver is the shift toward premiumization, where demand for artisanal coffee varieties, specialty tea blends, and single-origin coffee is reshaping product portfolios.
  • This trend is coupled with a growing emphasis on health and wellness, which fuels the adoption of functional ingredients and clean label hot drinks. Technologically, advanced brewing technologies, including automated beverage systems and smart brewing devices with precision brewing capabilities, are enhancing the consumer experience both at home and in commercial settings.
  • For instance, a cafe chain can leverage these systems to ensure consistent quality across all locations, reducing training overhead and improving customer satisfaction. However, the industry faces challenges related to sustainability, with a strong push for sustainable packaging materials and ethical sourcing practices, compelling companies to rethink their supply chains and operational footprints to meet new standards and consumer expectations.

What will be the Size of the Hot Drink Market during the forecast period?

Get Key Insights on Market Forecast (PDF) Get Free Sample

How is the Hot Drink Market Segmented?

The hot drink industry research report provides comprehensive data (region-wise segment analysis), with forecasts and estimates in "USD billion" for the period 2026-2030, as well as historical data from 2020-2024 for the following segments.

  • Distribution channel
    • Offline
    • Online
  • Type
    • Coffee
    • Tea
    • Cocoa
  • End-user
    • Residential
    • Commercial
  • Geography
    • APAC
      • China
      • Japan
      • India
    • North America
      • US
      • Canada
      • Mexico
    • Europe
      • Germany
      • UK
      • France
    • South America
      • Brazil
      • Argentina
    • Middle East and Africa
      • Saudi Arabia
      • UAE
      • South Africa
    • Rest of World (ROW)

By Distribution Channel Insights

The offline segment is estimated to witness significant growth during the forecast period.

The offline segment remains the predominant distribution channel, heavily influenced by an established infrastructure of supermarkets, specialty cafes, and food service outlets.

This channel's strength is rooted in providing immediate product access and a sensory-rich purchasing environment, which are crucial for premium hot beverages and artisanal coffee varieties.

The expansion of modern retail has been a significant factor, with organized retail penetration increasing by over 5% in key urban centers. Consumers' reliance on physical stores for exploring specialty tea blends and single-origin coffee reinforces the channel's dominance.

The growing cafe culture further solidifies this position, transforming hot beverage consumption into an experience-driven activity that online platforms cannot fully replicate, thus shaping hot beverage market dynamics.

Get Free Sample

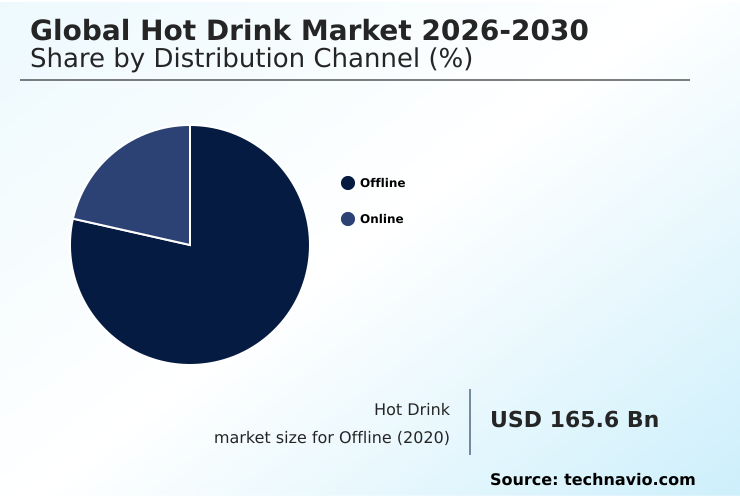
The Offline segment was valued at USD 202.1 billion in 2024 and showed a gradual increase during the forecast period.

Get Free Sample

Regional Analysis

APAC is estimated to contribute 36.9% to the growth of the global market during the forecast period.Technavio’s analysts have elaborately explained the regional trends and drivers that shape the market during the forecast period.

See How Hot Drink Market Demand is Rising in APAC Get Free Sample

The geographic landscape of the market is characterized by varied growth trajectories and consumption patterns. APAC is set to lead growth, expanding at a rate of 6.9%, driven by rising disposable incomes and an expanding cafe culture.

This contrasts with the more mature market in Europe, which shows steady growth of 6.0%. In North America, consumer beverage preferences are shifting toward convenience, fueling the ready-to-drink (RTD) coffee market and the adoption of single-serve beverage solutions.

Across all regions, a global standard is emerging around ethical beverage sourcing, with a pronounced push for fair trade certification and ethically sourced cocoa.

This trend is compelling companies to enhance supply chain transparency, impacting operations from South America to Asia.

The adoption of energy-efficient machines in production facilities is also becoming a key initiative, with some operators reporting energy consumption reductions of over 12%.

Market Dynamics

Our researchers analyzed the data with 2025 as the base year, along with the key drivers, trends, and challenges. A holistic analysis of drivers will help companies refine their marketing strategies to gain a competitive advantage.

  • The evolving landscape of the Hot Drink Market is significantly influenced by several interconnected factors. The impact of cafe culture on coffee consumption has fundamentally elevated consumer expectations, directly fueling the demand for premium and artisanal hot drinks. This shift is not just about taste but also about the overall experience, pushing producers to innovate beyond conventional offerings.
  • In parallel, there is a strong consumer preference for sustainable hot drink packaging, which is compelling businesses to re-evaluate their supply chains and material choices. Companies that proactively adopt sustainable practices often see brand loyalty metrics improve by up to 20% compared to competitors that lag behind.
  • Furthermore, the role of brewing technology in beverage quality cannot be overstated; advanced systems are enabling a level of customization and consistency that supports the premium trend.
  • However, the industry is not without its hurdles, as it continues to navigate the challenges of sugar content in hot beverages, which requires significant investment in reformulation and a commitment to transparency to meet the demands of health-conscious consumers.

What are the key market drivers leading to the rise in the adoption of Hot Drink Industry?

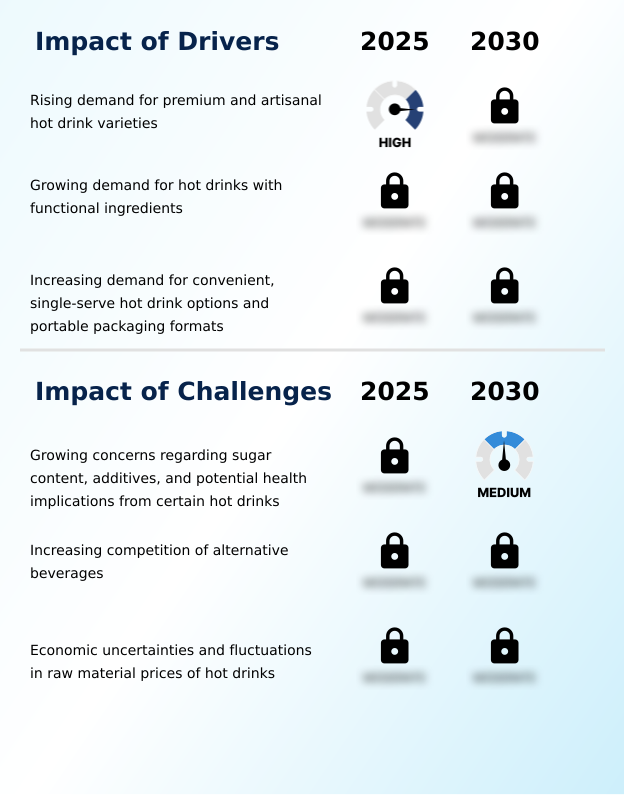
  • The rising demand for premium and artisanal hot drink varieties serves as a key driver propelling market growth.

  • Market growth is propelled by the dual drivers of premiumization and convenience, reshaping consumer expectations and purchasing habits.
  • The sustained demand for premium and artisanal hot drinks is evident in the burgeoning artisanal beverage market, where premium coffee trends are particularly strong.
  • This is complemented by innovations in convenient formats, such as single-serve pods and ready-to-use cold brew coffee concentrates, which facilitate at-home premium experiences.
  • Ethical considerations are also a powerful driver, with a clear preference for ethically sourced cocoa and sustainable hot beverage packaging.
  • Direct-to-consumer (D2C) hot beverages models are proving highly effective, showing a 30% higher customer lifetime value compared to traditional retail channels.
  • Furthermore, firms that adopt biodegradable packaging and other sustainable options see a measurable improvement in brand perception scores, often by more than 10 points.

What are the market trends shaping the Hot Drink Industry?

  • Advancements in brewing technologies represent a key upcoming trend in the market. These innovations are set to enhance beverage quality, consistency, and efficiency for consumers and commercial operators.

  • Key trends are reshaping the market, primarily driven by a focus on health and wellness. There is a marked increase in demand for clean label hot drinks and low-sugar beverage formulations, as consumers scrutinize ingredient lists more carefully. This trend extends to the rising popularity of plant-based hot drinks and herbal infusions, catering to diverse dietary preferences and wellness goals.
  • Beverage technology advancements are enabling greater personalization, a key aspect of hot drink industry trends. For instance, brands offering customizable options through smart applications report customer engagement rates 25% higher than those with static product lines.
  • The organic hot drink market is also expanding, with products featuring natural food ingredients seeing new product development rejection rates fall by 15%, highlighting the tangible benefits of aligning with consumer values and health-conscious beverage choices.

What challenges does the Hot Drink Industry face during its growth?

  • Growing concerns over sugar content, additives, and the potential health implications of certain products present a significant challenge to industry growth.

  • The industry is navigating several complex challenges, primarily related to cost pressures and intense competition. The persistent challenges of sugar content in hot beverages are forcing costly reformulation efforts and creating compliance burdens. While the adoption of advanced brewing technologies is critical for differentiation, the required capital investment can be substantial, with return-on-investment cycles often exceeding 24 months.
  • Similarly, the shift to sustainable packaging materials, though demanded by consumers, can increase production costs by up to 8% for some product lines.
  • The proliferation of ready-to-drink (RTD) hot drinks and innovations in the ready-to-drink (RTD) coffee market are intensifying competition, which shortens product lifecycles and puts downward pressure on margins, a key concern highlighted in recent coffee and tea market analysis.

Exclusive Technavio Analysis on Customer Landscape

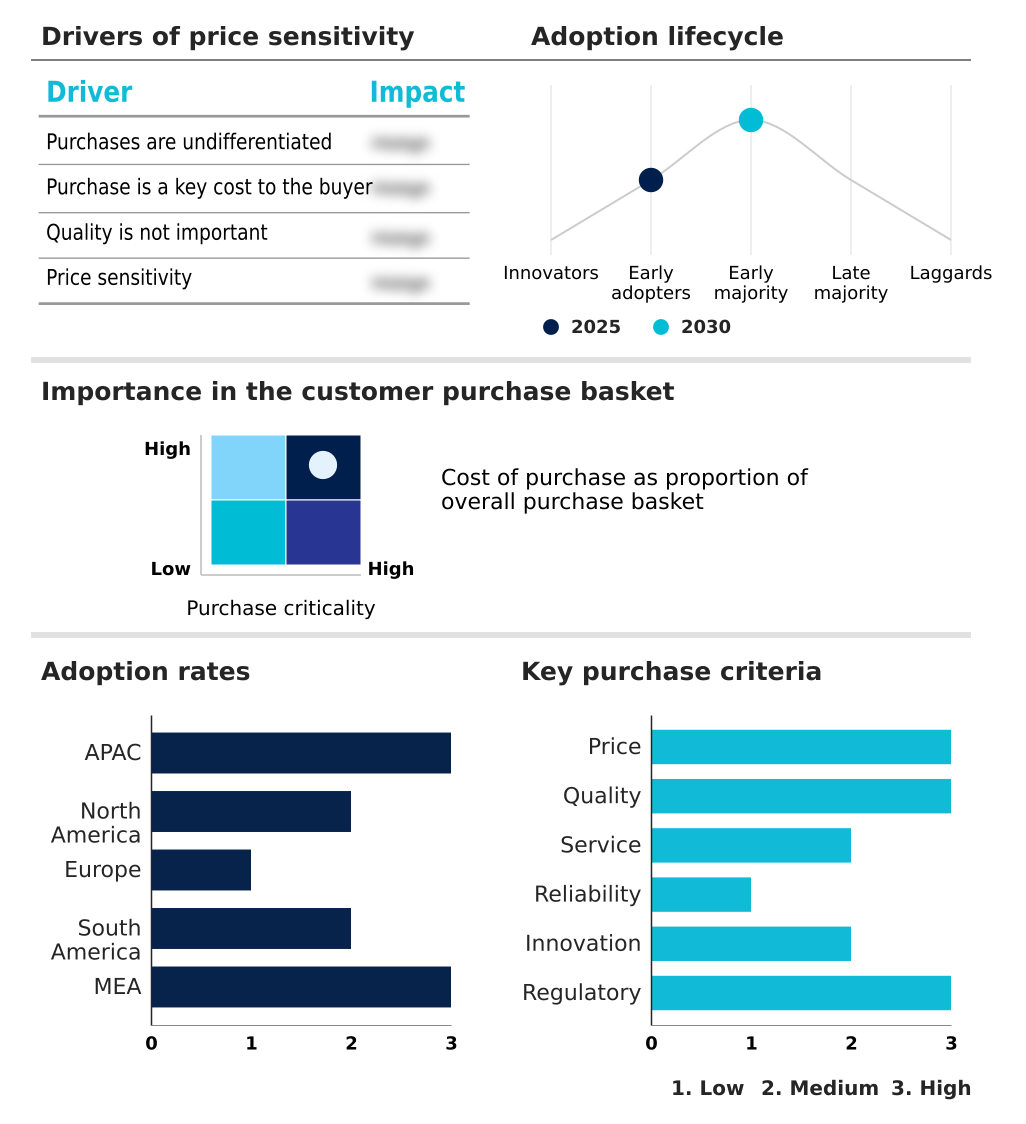
The hot drink market forecasting report includes the adoption lifecycle of the market, covering from the innovator’s stage to the laggard’s stage. It focuses on adoption rates in different regions based on penetration. Furthermore, the hot drink market report also includes key purchase criteria and drivers of price sensitivity to help companies evaluate and develop their market growth analysis strategies.

Customer Landscape of Hot Drink Industry

Competitive Landscape

Companies are implementing various strategies, such as strategic alliances, hot drink market forecast, partnerships, mergers and acquisitions, geographical expansion, and product/service launches, to enhance their presence in the industry.

Ajinomoto Co. Inc. - Analysis indicates a portfolio focused on instant and powdered coffee products, strategically targeting convenience-driven consumer segments.

The industry research and growth report includes detailed analyses of the competitive landscape of the market and information about key companies, including:

  • Ajinomoto Co. Inc.
  • Caffe Nero Group Ltd
  • Caribou Coffee Operating Co.
  • Harney and Sons Fine Teas
  • illycaffe SpA
  • JDE Peets NV
  • Keurig Dr Pepper Inc.
  • Luigi Lavazza SpA
  • Massimo Zanetti Beverage
  • McDonald Corp.
  • Nestle SA
  • Olam Group Ltd.
  • Starbucks Corp.
  • Strauss Group Ltd.
  • Tata Consumer Products Ltd.
  • Tchibo GmbH
  • The Coca Cola Co.
  • The Hain Celestial Group
  • The J.M. Smucker Co.
  • The Kraft Heinz Co.

Qualitative and quantitative analysis of companies has been conducted to help clients understand the wider business environment as well as the strengths and weaknesses of key industry players. Data is qualitatively analyzed to categorize companies as pure play, category-focused, industry-focused, and diversified; it is quantitatively analyzed to categorize companies as dominant, leading, strong, tentative, and weak.

Recent Development and News in Hot drink market

  • In May 2025, Nestle announced the reformulation of several of its instant hot beverage products to reduce added sugar content and eliminate artificial additives in response to growing consumer demand for healthier drink options.
  • In April 2025, Nestle introduced next-generation coffee brewing machines under its Nespresso line, featuring enhanced precision brewing technology and energy-saving modes designed to improve user experience and reduce environmental footprint.
  • In March 2025, Starbucks expanded its premium Reserve coffee line with new single-origin offerings aimed at enhancing the artisanal coffee experience and catering to evolving consumer preferences for high-quality beverages.
  • In January 2025, Keurig Dr Pepper launched a new line of fully compostable K-Cup pods for select coffee brands, addressing consumer demand for sustainable single-serve beverage solutions.

Dive into Technavio’s robust research methodology, blending expert interviews, extensive data synthesis, and validated models for unparalleled Hot Drink Market insights. See full methodology.

Market Scope
Page number 290
Base year 2025
Historic period 2020-2024
Forecast period 2026-2030
Growth momentum & CAGR Accelerate at a CAGR of 6.5%
Market growth 2026-2030 USD 101.3 billion
Market structure Fragmented
YoY growth 2025-2026(%) 6.1%
Key countries China, Japan, India, South Korea, Australia, Indonesia, US, Canada, Mexico, Germany, UK, France, Italy, Spain, The Netherlands, Brazil, Argentina, Chile, Saudi Arabia, UAE, South Africa, Israel and Turkey
Competitive landscape Leading Companies, Market Positioning of Companies, Competitive Strategies, and Industry Risks

Request Free Sample

Research Analyst Overview

  • The market is undergoing a significant transformation characterized by the convergence of premiumization, technology, and sustainability. The demand for premium hot beverages, including artisanal coffee varieties, specialty tea blends, and single-origin coffee, is compelling producers to innovate.
  • A key boardroom decision revolves around investment in ethical sourcing practices and securing fair trade certification for products like ethically sourced cocoa to meet consumer expectations. Product development is increasingly focused on functional ingredients, leading to a surge in clean label hot drinks and low-sugar beverage formulations.
  • The integration of advanced brewing technologies, such as automated beverage systems and smart brewing devices enabling precision brewing, is enhancing the consumer experience. Simultaneously, the industry is adapting to new consumption formats like ready-to-drink (RTD) hot drinks, cold brew coffee concentrates, and direct-to-consumer (D2C) hot beverages.
  • Operationally, the shift toward sustainable packaging materials, including eco-friendly capsules and biodegradable packaging, is critical. Firms adopting energy-efficient machines in their processes have reported operational cost reductions of over 10%, demonstrating a tangible return on sustainability investments in a competitive environment.

What are the Key Data Covered in this Hot Drink Market Research and Growth Report?

  • What is the expected growth of the Hot Drink Market between 2026 and 2030?

    • USD 101.3 billion, at a CAGR of 6.5%

  • What segmentation does the market report cover?

    • The report is segmented by Distribution Channel (Offline, and Online), Type (Coffee, Tea, and Cocoa), End-user (Residential, and Commercial) and Geography (APAC, North America, Europe, South America, Middle East and Africa)

  • Which regions are analyzed in the report?

    • APAC, North America, Europe, South America and Middle East and Africa

  • What are the key growth drivers and market challenges?

    • Rising demand for premium and artisanal hot drink varieties, Growing concerns regarding sugar content, additives, and potential health implications from certain hot drinks

  • Who are the major players in the Hot Drink Market?

    • Ajinomoto Co. Inc., Caffe Nero Group Ltd, Caribou Coffee Operating Co., Harney and Sons Fine Teas, illycaffe SpA, JDE Peets NV, Keurig Dr Pepper Inc., Luigi Lavazza SpA, Massimo Zanetti Beverage, McDonald Corp., Nestle SA, Olam Group Ltd., Starbucks Corp., Strauss Group Ltd., Tata Consumer Products Ltd., Tchibo GmbH, The Coca Cola Co., The Hain Celestial Group, The J.M. Smucker Co. and The Kraft Heinz Co.

Market Research Insights

  • The market is shaped by dynamic shifts in consumer behavior and product innovation. A key aspect of hot beverage market dynamics is the rising popularity of the artisanal beverage market, driven by premium coffee trends. This is complemented by a growing demand for functional drink innovations and healthier alternatives, reflecting a broader trend of health-conscious beverage choices.
  • Companies focusing on sustainable hot beverage packaging report material waste reductions of up to 15%.
  • Furthermore, analysis of specialty tea consumption patterns reveals that brands offering curated, ethically sourced options achieve customer retention rates approximately 10% higher than those in the mass-market segment, underscoring the value of differentiation and alignment with consumer values in the current coffee and tea market analysis.

We can help! Our analysts can customize this hot drink market research report to meet your requirements.

Get in touch

1. Executive Summary

1.1 Market overview

Executive Summary - Chart on Market Overview
Executive Summary - Data Table on Market Overview
Executive Summary - Chart on Global Market Characteristics
Executive Summary - Chart on Market by Geography
Executive Summary - Chart on Market Segmentation by Distribution Channel
Executive Summary - Chart on Market Segmentation by Type
Executive Summary - Chart on Market Segmentation by End-user
Executive Summary - Chart on Incremental Growth
Executive Summary - Data Table on Incremental Growth
Executive Summary - Chart on Company Market Positioning

2. Technavio Analysis

2.1 Analysis of price sensitivity, lifecycle, customer purchase basket, adoption rates, and purchase criteria

2.2 Criticality of inputs and Factors of differentiation

Chart on Overview on criticality of inputs and factors of differentiation

2.3 Factors of disruption

Chart on Overview on factors of disruption

2.4 Impact of drivers and challenges

Chart on Impact of drivers and challenges in 2025 and 2030

3. Market Landscape

3.1 Market ecosystem

Chart on Parent Market
Data Table on - Parent Market

3.2 Market characteristics

Chart on Market characteristics analysis

3.3 Value chain analysis

Chart on Value chain analysis

4. Market Sizing

4.1 Market definition

Data Table on Offerings of companies included in the market definition

4.2 Market segment analysis

Market segments

4.3 Market size 2025

4.4 Market outlook: Forecast for 2025-2030

Chart on Global - Market size and forecast 2025-2030 ($ billion)
Data Table on Global - Market size and forecast 2025-2030 ($ billion)
Chart on Global Market: Year-over-year growth 2025-2030 (%)
Data Table on Global Market: Year-over-year growth 2025-2030 (%)

5. Historic Market Size

5.1 Global Hot Drink Market 2020 - 2024

Historic Market Size - Data Table on Global Hot Drink Market 2020 - 2024 ($ billion)

5.2 Distribution Channel segment analysis 2020 - 2024

Historic Market Size - Distribution Channel Segment 2020 - 2024 ($ billion)

5.3 Type segment analysis 2020 - 2024

Historic Market Size - Type Segment 2020 - 2024 ($ billion)

5.4 End-user segment analysis 2020 - 2024

Historic Market Size - End-user Segment 2020 - 2024 ($ billion)

5.5 Geography segment analysis 2020 - 2024

Historic Market Size - Geography Segment 2020 - 2024 ($ billion)

5.6 Country segment analysis 2020 - 2024

Historic Market Size - Country Segment 2020 - 2024 ($ billion)

6. Qualitative Analysis

6.1 Impact of AI on Global Hot Drink Market

6.2 Impact of Geopolitical Conflicts on Global Hot Drink Market

7. Five Forces Analysis

7.1 Five forces summary

Five forces analysis - Comparison between 2025 and 2030

7.2 Bargaining power of buyers

Bargaining power of buyers - Impact of key factors 2025 and 2030

7.3 Bargaining power of suppliers

Bargaining power of suppliers - Impact of key factors in 2025 and 2030

7.4 Threat of new entrants

Threat of new entrants - Impact of key factors in 2025 and 2030

7.5 Threat of substitutes

Threat of substitutes - Impact of key factors in 2025 and 2030

7.6 Threat of rivalry

Threat of rivalry - Impact of key factors in 2025 and 2030

7.7 Market condition

Chart on Market condition - Five forces 2025 and 2030

8. Market Segmentation by Distribution Channel

8.1 Market segments

Chart on Distribution Channel - Market share 2025-2030 (%)
Data Table on Distribution Channel - Market share 2025-2030 (%)

8.2 Comparison by Distribution Channel

Chart on Comparison by Distribution Channel
Data Table on Comparison by Distribution Channel

8.3 Offline - Market size and forecast 2025-2030

Chart on Offline - Market size and forecast 2025-2030 ($ billion)
Data Table on Offline - Market size and forecast 2025-2030 ($ billion)
Chart on Offline - Year-over-year growth 2025-2030 (%)
Data Table on Offline - Year-over-year growth 2025-2030 (%)

8.4 Online - Market size and forecast 2025-2030

Chart on Online - Market size and forecast 2025-2030 ($ billion)
Data Table on Online - Market size and forecast 2025-2030 ($ billion)
Chart on Online - Year-over-year growth 2025-2030 (%)
Data Table on Online - Year-over-year growth 2025-2030 (%)

8.5 Market opportunity by Distribution Channel

Market opportunity by Distribution Channel ($ billion)
Data Table on Market opportunity by Distribution Channel ($ billion)

9. Market Segmentation by Type

9.1 Market segments

Chart on Type - Market share 2025-2030 (%)
Data Table on Type - Market share 2025-2030 (%)

9.2 Comparison by Type

Chart on Comparison by Type
Data Table on Comparison by Type

9.3 Coffee - Market size and forecast 2025-2030

Chart on Coffee - Market size and forecast 2025-2030 ($ billion)
Data Table on Coffee - Market size and forecast 2025-2030 ($ billion)
Chart on Coffee - Year-over-year growth 2025-2030 (%)
Data Table on Coffee - Year-over-year growth 2025-2030 (%)

9.4 Tea - Market size and forecast 2025-2030

Chart on Tea - Market size and forecast 2025-2030 ($ billion)
Data Table on Tea - Market size and forecast 2025-2030 ($ billion)
Chart on Tea - Year-over-year growth 2025-2030 (%)
Data Table on Tea - Year-over-year growth 2025-2030 (%)

9.5 Cocoa - Market size and forecast 2025-2030

Chart on Cocoa - Market size and forecast 2025-2030 ($ billion)
Data Table on Cocoa - Market size and forecast 2025-2030 ($ billion)
Chart on Cocoa - Year-over-year growth 2025-2030 (%)
Data Table on Cocoa - Year-over-year growth 2025-2030 (%)

9.6 Market opportunity by Type

Market opportunity by Type ($ billion)
Data Table on Market opportunity by Type ($ billion)

10. Market Segmentation by End-user

10.1 Market segments

Chart on End-user - Market share 2025-2030 (%)
Data Table on End-user - Market share 2025-2030 (%)

10.2 Comparison by End-user

Chart on Comparison by End-user
Data Table on Comparison by End-user

10.3 Residential - Market size and forecast 2025-2030

Chart on Residential - Market size and forecast 2025-2030 ($ billion)
Data Table on Residential - Market size and forecast 2025-2030 ($ billion)
Chart on Residential - Year-over-year growth 2025-2030 (%)
Data Table on Residential - Year-over-year growth 2025-2030 (%)

10.4 Commercial - Market size and forecast 2025-2030

Chart on Commercial - Market size and forecast 2025-2030 ($ billion)
Data Table on Commercial - Market size and forecast 2025-2030 ($ billion)
Chart on Commercial - Year-over-year growth 2025-2030 (%)
Data Table on Commercial - Year-over-year growth 2025-2030 (%)

10.5 Market opportunity by End-user

Market opportunity by End-user ($ billion)
Data Table on Market opportunity by End-user ($ billion)

11. Customer Landscape

11.1 Customer landscape overview

Analysis of price sensitivity, lifecycle, customer purchase basket, adoption rates, and purchase criteria

12. Geographic Landscape

12.1 Geographic segmentation

Chart on Market share by geography 2025-2030 (%)
Data Table on Market share by geography 2025-2030 (%)

12.2 Geographic comparison

Chart on Geographic comparison
Data Table on Geographic comparison

12.3 APAC - Market size and forecast 2025-2030

Chart on APAC - Market size and forecast 2025-2030 ($ billion)
Data Table on APAC - Market size and forecast 2025-2030 ($ billion)
Chart on APAC - Year-over-year growth 2025-2030 (%)
Data Table on APAC - Year-over-year growth 2025-2030 (%)
Chart on Regional Comparison - APAC
Data Table on Regional Comparison - APAC

12.3.1 China - Market size and forecast 2025-2030

Chart on China - Market size and forecast 2025-2030 ($ billion)
Data Table on China - Market size and forecast 2025-2030 ($ billion)
Chart on China - Year-over-year growth 2025-2030 (%)
Data Table on China - Year-over-year growth 2025-2030 (%)

12.3.2 Japan - Market size and forecast 2025-2030

Chart on Japan - Market size and forecast 2025-2030 ($ billion)
Data Table on Japan - Market size and forecast 2025-2030 ($ billion)
Chart on Japan - Year-over-year growth 2025-2030 (%)
Data Table on Japan - Year-over-year growth 2025-2030 (%)

12.3.3 India - Market size and forecast 2025-2030

Chart on India - Market size and forecast 2025-2030 ($ billion)
Data Table on India - Market size and forecast 2025-2030 ($ billion)
Chart on India - Year-over-year growth 2025-2030 (%)
Data Table on India - Year-over-year growth 2025-2030 (%)

12.3.4 South Korea - Market size and forecast 2025-2030

Chart on South Korea - Market size and forecast 2025-2030 ($ billion)
Data Table on South Korea - Market size and forecast 2025-2030 ($ billion)
Chart on South Korea - Year-over-year growth 2025-2030 (%)
Data Table on South Korea - Year-over-year growth 2025-2030 (%)

12.3.5 Australia - Market size and forecast 2025-2030

Chart on Australia - Market size and forecast 2025-2030 ($ billion)
Data Table on Australia - Market size and forecast 2025-2030 ($ billion)
Chart on Australia - Year-over-year growth 2025-2030 (%)
Data Table on Australia - Year-over-year growth 2025-2030 (%)

12.3.6 Indonesia - Market size and forecast 2025-2030

Chart on Indonesia - Market size and forecast 2025-2030 ($ billion)
Data Table on Indonesia - Market size and forecast 2025-2030 ($ billion)
Chart on Indonesia - Year-over-year growth 2025-2030 (%)
Data Table on Indonesia - Year-over-year growth 2025-2030 (%)

12.4 North America - Market size and forecast 2025-2030

Chart on North America - Market size and forecast 2025-2030 ($ billion)
Data Table on North America - Market size and forecast 2025-2030 ($ billion)
Chart on North America - Year-over-year growth 2025-2030 (%)
Data Table on North America - Year-over-year growth 2025-2030 (%)
Chart on Regional Comparison - North America
Data Table on Regional Comparison - North America

12.4.1 US - Market size and forecast 2025-2030

Chart on US - Market size and forecast 2025-2030 ($ billion)
Data Table on US - Market size and forecast 2025-2030 ($ billion)
Chart on US - Year-over-year growth 2025-2030 (%)
Data Table on US - Year-over-year growth 2025-2030 (%)

12.4.2 Canada - Market size and forecast 2025-2030

Chart on Canada - Market size and forecast 2025-2030 ($ billion)
Data Table on Canada - Market size and forecast 2025-2030 ($ billion)
Chart on Canada - Year-over-year growth 2025-2030 (%)
Data Table on Canada - Year-over-year growth 2025-2030 (%)

12.4.3 Mexico - Market size and forecast 2025-2030

Chart on Mexico - Market size and forecast 2025-2030 ($ billion)
Data Table on Mexico - Market size and forecast 2025-2030 ($ billion)
Chart on Mexico - Year-over-year growth 2025-2030 (%)
Data Table on Mexico - Year-over-year growth 2025-2030 (%)

12.5 Europe - Market size and forecast 2025-2030

Chart on Europe - Market size and forecast 2025-2030 ($ billion)
Data Table on Europe - Market size and forecast 2025-2030 ($ billion)
Chart on Europe - Year-over-year growth 2025-2030 (%)
Data Table on Europe - Year-over-year growth 2025-2030 (%)
Chart on Regional Comparison - Europe
Data Table on Regional Comparison - Europe

12.5.1 Germany - Market size and forecast 2025-2030

Chart on Germany - Market size and forecast 2025-2030 ($ billion)
Data Table on Germany - Market size and forecast 2025-2030 ($ billion)
Chart on Germany - Year-over-year growth 2025-2030 (%)
Data Table on Germany - Year-over-year growth 2025-2030 (%)

12.5.2 UK - Market size and forecast 2025-2030

Chart on UK - Market size and forecast 2025-2030 ($ billion)
Data Table on UK - Market size and forecast 2025-2030 ($ billion)
Chart on UK - Year-over-year growth 2025-2030 (%)
Data Table on UK - Year-over-year growth 2025-2030 (%)

12.5.3 France - Market size and forecast 2025-2030

Chart on France - Market size and forecast 2025-2030 ($ billion)
Data Table on France - Market size and forecast 2025-2030 ($ billion)
Chart on France - Year-over-year growth 2025-2030 (%)
Data Table on France - Year-over-year growth 2025-2030 (%)

12.5.4 Italy - Market size and forecast 2025-2030

Chart on Italy - Market size and forecast 2025-2030 ($ billion)
Data Table on Italy - Market size and forecast 2025-2030 ($ billion)
Chart on Italy - Year-over-year growth 2025-2030 (%)
Data Table on Italy - Year-over-year growth 2025-2030 (%)

12.5.5 Spain - Market size and forecast 2025-2030

Chart on Spain - Market size and forecast 2025-2030 ($ billion)
Data Table on Spain - Market size and forecast 2025-2030 ($ billion)
Chart on Spain - Year-over-year growth 2025-2030 (%)
Data Table on Spain - Year-over-year growth 2025-2030 (%)

12.5.6 The Netherlands - Market size and forecast 2025-2030

Chart on The Netherlands - Market size and forecast 2025-2030 ($ billion)
Data Table on The Netherlands - Market size and forecast 2025-2030 ($ billion)
Chart on The Netherlands - Year-over-year growth 2025-2030 (%)
Data Table on The Netherlands - Year-over-year growth 2025-2030 (%)

12.6 South America - Market size and forecast 2025-2030

Chart on South America - Market size and forecast 2025-2030 ($ billion)
Data Table on South America - Market size and forecast 2025-2030 ($ billion)
Chart on South America - Year-over-year growth 2025-2030 (%)
Data Table on South America - Year-over-year growth 2025-2030 (%)
Chart on Regional Comparison - South America
Data Table on Regional Comparison - South America

12.6.1 Brazil - Market size and forecast 2025-2030

Chart on Brazil - Market size and forecast 2025-2030 ($ billion)
Data Table on Brazil - Market size and forecast 2025-2030 ($ billion)
Chart on Brazil - Year-over-year growth 2025-2030 (%)
Data Table on Brazil - Year-over-year growth 2025-2030 (%)

12.6.2 Argentina - Market size and forecast 2025-2030

Chart on Argentina - Market size and forecast 2025-2030 ($ billion)
Data Table on Argentina - Market size and forecast 2025-2030 ($ billion)
Chart on Argentina - Year-over-year growth 2025-2030 (%)
Data Table on Argentina - Year-over-year growth 2025-2030 (%)

12.6.3 Chile - Market size and forecast 2025-2030

Chart on Chile - Market size and forecast 2025-2030 ($ billion)
Data Table on Chile - Market size and forecast 2025-2030 ($ billion)
Chart on Chile - Year-over-year growth 2025-2030 (%)
Data Table on Chile - Year-over-year growth 2025-2030 (%)

12.7 Middle East and Africa - Market size and forecast 2025-2030

Chart on Middle East and Africa - Market size and forecast 2025-2030 ($ billion)
Data Table on Middle East and Africa - Market size and forecast 2025-2030 ($ billion)
Chart on Middle East and Africa - Year-over-year growth 2025-2030 (%)
Data Table on Middle East and Africa - Year-over-year growth 2025-2030 (%)
Chart on Regional Comparison - Middle East and Africa
Data Table on Regional Comparison - Middle East and Africa

12.7.1 Saudi Arabia - Market size and forecast 2025-2030

Chart on Saudi Arabia - Market size and forecast 2025-2030 ($ billion)
Data Table on Saudi Arabia - Market size and forecast 2025-2030 ($ billion)
Chart on Saudi Arabia - Year-over-year growth 2025-2030 (%)
Data Table on Saudi Arabia - Year-over-year growth 2025-2030 (%)

12.7.2 UAE - Market size and forecast 2025-2030

Chart on UAE - Market size and forecast 2025-2030 ($ billion)
Data Table on UAE - Market size and forecast 2025-2030 ($ billion)
Chart on UAE - Year-over-year growth 2025-2030 (%)
Data Table on UAE - Year-over-year growth 2025-2030 (%)

12.7.3 South Africa - Market size and forecast 2025-2030

Chart on South Africa - Market size and forecast 2025-2030 ($ billion)
Data Table on South Africa - Market size and forecast 2025-2030 ($ billion)
Chart on South Africa - Year-over-year growth 2025-2030 (%)
Data Table on South Africa - Year-over-year growth 2025-2030 (%)

12.7.4 Israel - Market size and forecast 2025-2030

Chart on Israel - Market size and forecast 2025-2030 ($ billion)
Data Table on Israel - Market size and forecast 2025-2030 ($ billion)
Chart on Israel - Year-over-year growth 2025-2030 (%)
Data Table on Israel - Year-over-year growth 2025-2030 (%)

12.7.5 Turkey - Market size and forecast 2025-2030

Chart on Turkey - Market size and forecast 2025-2030 ($ billion)
Data Table on Turkey - Market size and forecast 2025-2030 ($ billion)
Chart on Turkey - Year-over-year growth 2025-2030 (%)
Data Table on Turkey - Year-over-year growth 2025-2030 (%)

12.8 Market opportunity by geography

Market opportunity by geography ($ billion)
Data Tables on Market opportunity by geography ($ billion)

13. Drivers, Challenges, and Opportunity

13.1 Market drivers

Rising demand for premium and artisanal hot drink varieties
Growing demand for hot drinks with functional ingredients
Increasing demand for convenient, single-serve hot drink options and portable packaging formats

13.2 Market challenges

Growing concerns regarding sugar content, additives, and potential health implications from certain hot drinks
Increasing competition of alternative beverages
Economic uncertainties and fluctuations in raw material prices of hot drinks

13.3 Impact of drivers and challenges

Impact of drivers and challenges in 2025 and 2030

13.4 Market opportunities

Advancements in brewing technologies
Growing shift towards fusion flavors, unique combinations, and multi-sensory experiences in hot drinks
Growing consumer preference for hot drinks packaged in sustainable materials

14. Competitive Landscape

14.1 Overview

14.2

Overview on criticality of inputs and factors of differentiation

14.3 Landscape disruption

Overview on factors of disruption

14.4 Industry risks

Impact of key risks on business

15. Competitive Analysis

15.1 Companies profiled

Companies covered

15.2 Company ranking index

15.3 Market positioning of companies

Matrix on companies position and classification

15.4 Ajinomoto Co. Inc.

Ajinomoto Co. Inc. - Overview
Ajinomoto Co. Inc. - Business segments
Ajinomoto Co. Inc. - Key offerings
Ajinomoto Co. Inc. - Segment focus
SWOT

15.5 illycaffe SpA

illycaffe SpA - Overview
illycaffe SpA - Product / Service
illycaffe SpA - Key offerings
SWOT

15.6 Keurig Dr Pepper Inc.

Keurig Dr Pepper Inc. - Overview
Keurig Dr Pepper Inc. - Business segments
Keurig Dr Pepper Inc. - Key offerings
Keurig Dr Pepper Inc. - Segment focus
SWOT

15.7 Luigi Lavazza SpA

Luigi Lavazza SpA - Overview
Luigi Lavazza SpA - Product / Service
Luigi Lavazza SpA - Key offerings
SWOT

15.8 Massimo Zanetti Beverage

Massimo Zanetti Beverage - Overview
Massimo Zanetti Beverage - Product / Service
Massimo Zanetti Beverage - Key offerings
SWOT

15.9 McDonald Corp.

McDonald Corp. - Overview
McDonald Corp. - Business segments
McDonald Corp. - Key offerings
McDonald Corp. - Segment focus
SWOT

15.10 Nestle SA

Nestle SA - Overview
Nestle SA - Business segments
Nestle SA - Key news
Nestle SA - Key offerings
Nestle SA - Segment focus
SWOT

15.11 Starbucks Corp.

Starbucks Corp. - Overview
Starbucks Corp. - Business segments
Starbucks Corp. - Key offerings
Starbucks Corp. - Segment focus
SWOT

15.12 Strauss Group Ltd.

Strauss Group Ltd. - Overview
Strauss Group Ltd. - Business segments
Strauss Group Ltd. - Key offerings
Strauss Group Ltd. - Segment focus
SWOT

15.13 Tata Consumer Products Ltd.

Tata Consumer Products Ltd. - Overview
Tata Consumer Products Ltd. - Business segments
Tata Consumer Products Ltd. - Key offerings
Tata Consumer Products Ltd. - Segment focus
SWOT

15.14 Tchibo GmbH

Tchibo GmbH - Overview
Tchibo GmbH - Product / Service
Tchibo GmbH - Key offerings
SWOT

15.15 The Coca Cola Co.

The Coca Cola Co. - Overview
The Coca Cola Co. - Business segments
The Coca Cola Co. - Key news
The Coca Cola Co. - Key offerings
The Coca Cola Co. - Segment focus
SWOT

15.16 The Hain Celestial Group

The Hain Celestial Group - Overview
The Hain Celestial Group - Business segments
The Hain Celestial Group - Key news
The Hain Celestial Group - Key offerings
The Hain Celestial Group - Segment focus
SWOT

15.17 The J.M. Smucker Co.

The J.M. Smucker Co. - Overview
The J.M. Smucker Co. - Business segments
The J.M. Smucker Co. - Key news
The J.M. Smucker Co. - Key offerings
The J.M. Smucker Co. - Segment focus
SWOT

15.18 The Kraft Heinz Co.

The Kraft Heinz Co. - Overview
The Kraft Heinz Co. - Business segments
The Kraft Heinz Co. - Key news
The Kraft Heinz Co. - Key offerings
The Kraft Heinz Co. - Segment focus
SWOT

16. Appendix

16.1 Scope of the report

Market definition
Objectives
Notes and caveats

16.2 Inclusions and exclusions checklist

Inclusions checklist
Exclusions checklist

16.3 Currency conversion rates for US$

16.4 Research methodology

16.5 Data procurement

Information sources

16.6 Data validation

16.7 Validation techniques employed for market sizing

16.8 Data synthesis

16.9 360 degree market analysis

16.10 List of abbreviations

Research Methodology

Technavio presents a detailed picture of the market by way of study, synthesis, and summation of data from multiple sources. The analysts have presented the various facets of the market with a particular focus on identifying the key industry influencers. The data thus presented is comprehensive, reliable, and the result of extensive research, both primary and secondary.

INFORMATION SOURCES

Primary sources

  • Manufacturers and suppliers
  • Channel partners
  • Industry experts
  • Strategic decision makers

Secondary sources

  • Industry journals and periodicals
  • Government data
  • Financial reports of key industry players
  • Historical data
  • Press releases

DATA ANALYSIS

Data Synthesis

  • Collation of data
  • Estimation of key figures
  • Analysis of derived insights

Data Validation

  • Triangulation with data models
  • Reference against proprietary databases
  • Corroboration with industry experts

REPORT WRITING

Qualitative

  • Market drivers
  • Market challenges
  • Market trends
  • Five forces analysis

Quantitative

  • Market size and forecast
  • Market segmentation
  • Geographical insights
  • Competitive landscape

Interested in this report?

Get your sample now to see our research methodology and insights!

Download Now

Frequently Asked Questions

Hot Drink market growth will increase by USD 101.3 billion during 2026-2030.

The Hot Drink market is expected to grow at a CAGR of 6.5% during 2026-2030.

Hot Drink market is segmented by Distribution channel (Offline, Online) Type (Coffee, Tea, Cocoa) End-user (Residential, Commercial)

Ajinomoto Co. Inc., Caffe Nero Group Ltd, Caribou Coffee Operating Co., Harney and Sons Fine Teas, illycaffe SpA, JDE Peets NV, Keurig Dr Pepper Inc., Luigi Lavazza SpA, Massimo Zanetti Beverage, McDonald Corp., Nestle SA, Olam Group Ltd., Starbucks Corp., Strauss Group Ltd., Tata Consumer Products Ltd., Tchibo GmbH, The Coca Cola Co., The Hain Celestial Group, The J.M. Smucker Co., The Kraft Heinz Co. are a few of the key vendors in the Hot Drink market.

APAC will register the highest growth rate of 36.9% among the other regions. Therefore, the Hot Drink market in APAC is expected to garner significant business opportunities for the vendors during the forecast period.

China, Japan, India, South Korea, Australia, Indonesia, US, Canada, Mexico, Germany, UK, France, Italy, Spain, The Netherlands, Brazil, Argentina, Chile, Saudi Arabia, UAE, South Africa, Israel, Turkey

  • Rising demand for premium and artisanal hot drink varieties is the driving factor this market.

The Hot Drink market vendors should focus on grabbing business opportunities from the Distribution channel segment as it accounted for the largest market share in the base year.
RIA - Research AI Assistant
Ask RIA