Household Robots Market Analysis North America, Europe, APAC, Middle East and Africa, South America - US, China, Japan, UK, Germany - Size and Forecast 2024-2028

Household Robots Market Analysis North America, Europe, APAC, Middle East and Africa, South America - US, China, Japan, UK, Germany - Size and Forecast 2024-2028

Published: Jan 2024 152 Pages SKU: IRTNTR77231

Market Overview at a Glance

$13.26 B
Market Opportunity
18.01%
CAGR
17.48
YoY growth 2023-2024(%)

Household Robots Market Size 2024-2028 

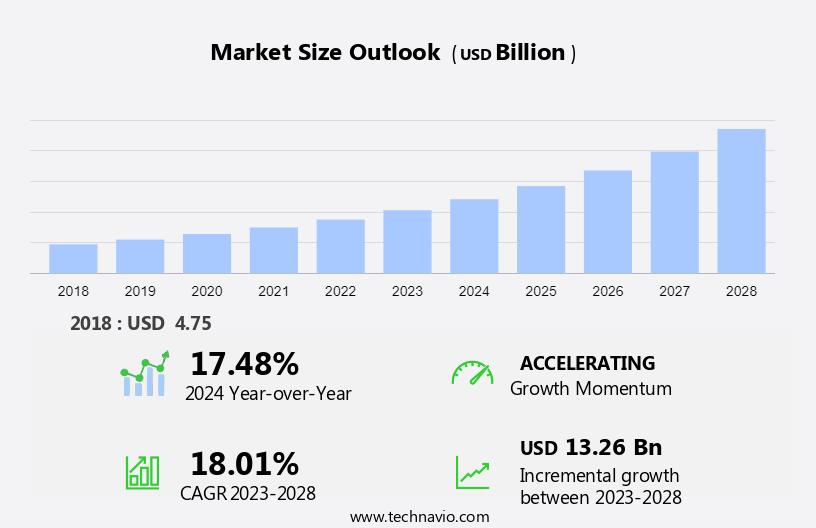
The household robots market size is forecast to increase by USD 13.26 billion at a CAGR of 18.01% between 2023 and 2028. Household robots have gained significant attention in the market due to the increasing demand for automation and innovation. The emergence of e-commerce has become a catalyst for the market growth analysis of the market, offering companies a powerful avenue to showcase, sell, and promote their innovative products to a global audience. The service segment, which includes customer support, troubleshooting, and technical support, plays a crucial role in marketing and selling these robots. Providers offer general guidance, online resources, dedicated helplines, chat support, and in-person assistance to ensure a seamless customer experience. Moreover, maintaining and repairing household robots require regular software updates, hardware repairs, and replacements. Advancements in technology continue to drive interest from consumers, with improvements in artificial intelligence and machine learning capabilities. However, the high initial purchase cost remains a challenge for some potential buyers. To address this, companies offer various financing options and extended warranties. 

Household Robots Market Size

 Request Free Sample

The market is experiencing significant growth as consumers seek to enhance the convenience and usability of their living spaces. These robots are designed to perform various labor-intensive tasks, from floor cleaning to entertainment and elderly care. In this article, we will explore the key trends and technologies shaping the market. Robots are engineered to work tirelessly, offering consumers a reliable labor force that does not succumb to fatigue or boredom. Their ability to work for extended periods without rest ensures that tasks are completed efficiently and effectively.

Additionally, robots are equipped with advanced charging systems that enable them to recharge autonomously or be easily recharged by their users. This feature ensures that the robots are always ready to perform their functions, reducing the need for human intervention. Household robots are designed to make life easier for their users. They offer intuitive interfaces and can be controlled via smartphone apps, voice commands, or remote controls. Moreover, they can be programmed to perform tasks at specific times, ensuring that chores are completed when it is most convenient for the user. Artificial Intelligence and IoT Devices: The integration of artificial intelligence and IoT devices is transforming the market.

Moreover, these technologies enable robots to learn from their environment and adapt to the user's preferences. They also allow for seamless integration with other smart home devices, creating a cohesive and efficient home automation system. Household robots offer a cost-effective alternative to human labor for performing repetitive and labor-intensive tasks. They are particularly useful for individuals with mobility issues or those who require assistance with daily chores. Robots are engineered to be reliable and require minimal maintenance. They are built with durable materials and can withstand heavy usage. Moreover, they are equipped with self-diagnostic capabilities, allowing for early identification and resolution of any issues.

Market Segmentation

The market research report provides comprehensive data (region-wise segment analysis), with forecasts and estimates in "USD billion" for the period 2024-2028, as well as historical data from 2018-2022 for the following segments.
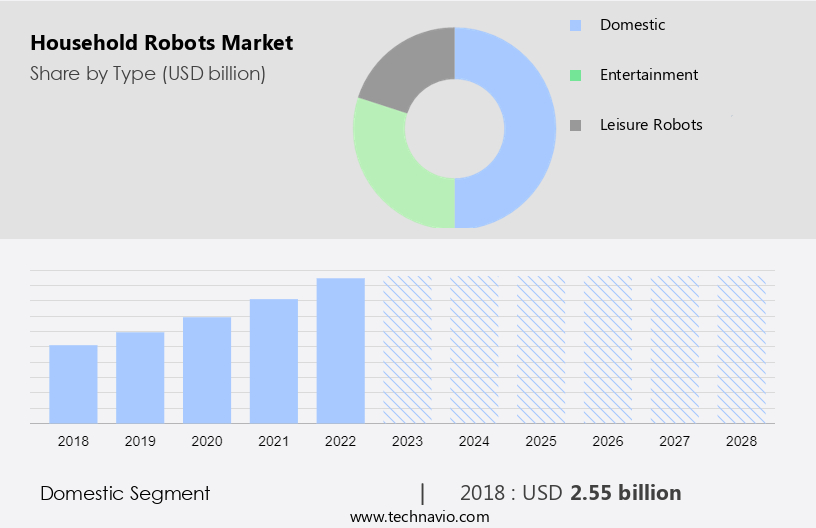
  • Type
    • Domestic
    • Entertainment
    • Leisure robots
  • Distribution Channel
    • Online
    • Offline
  • Geography
    • North America
      • US
    • Europe
      • Germany
      • UK
    • APAC
      • China
      • Japan
    • Middle East and Africa
    • South America

By Type Insights

The domestic segment is estimated to witness significant growth during the forecast period. The market is witnessing significant expansion due to the rising preference for automated solutions in managing daily household chores. Consumers are increasingly seeking convenience and time-saving alternatives, leading to the increasing popularity of products such as robotic vacuums and automated mops. Advanced technologies like AI and sensor systems are enhancing the functionality of these devices, enabling them to navigate obstacles, learn user behavior, and adapt to cleaning patterns. New players in the market are introducing lightweight designs and increased power to cater to the evolving needs of consumers. Furthermore, pet tools and hygienic cleaning solutions are gaining traction, as are big data capabilities that allow for customized user experiences. Autonomous driving robots and IoT devices are also making their way into households, offering labor service and reliability. The integration of these technologies is driving the digital transformation of household chores, increasing productivity, consistency, and speed. Maintenance and human labor force costs are significant considerations for consumers, making the reliability and low maintenance features of household robots a major selling point.

Household Robots Market Size

Get a glance at the market share of various segments Request Free Sample

The domestic segment was valued at USD 2.55 billion in 2018 and showed a gradual increase during the forecast period.

Regional Insights

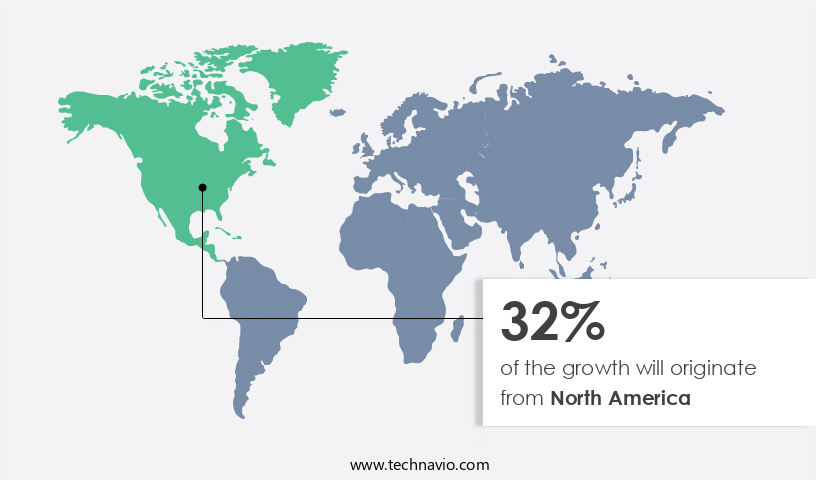
North America is estimated to contribute 32% to the growth of the global market during the forecast period. Technavio's analysts have elaborately explained the regional trends and drivers that shape the market during the forecast period.

Household Robots Market Share by Geography

For more insights on the market share of various regions Request Free Sample

The North American market is experiencing significant growth and is a key contributor to global market expansion. This trend is primarily driven by the increasing adoption of robotic lawnmowers and vacuum cleaners in the United States and Canada. The consumer robotics sector in North America is thriving due to the IoT revolution and the prevalent use of autonomous technologies. Household robots, including floor cleaning machines and entertainment systems, are gaining popularity in North America, especially among the geriatric population seeking assistance with elderly care and home security monitoring. Innovative technologies such as machine vision cameras and intuitive robotics, like Intuition Robotics' Wise Vacuum Cleaner, are fueling the market's growth. Major players in the North American market include companies like iRobot and Bosch. These companies are focusing on developing smart home concepts that cater to consumers' needs for convenience, entertainment, and security.

Our researchers analyzed the data with 2023 as the base year, along with the key drivers, trends, and challenges. A holistic analysis of drivers will help companies refine their marketing strategies to gain a competitive advantage.

Market Driver

The growing demand for robotic automation processes is notably driving the market growth. As technology continues to progress, consumers are increasingly seeking automated solutions to simplify and enhance various aspects of daily life. This demand is fueled by several key factors. There is a rising emphasis on convenience and time-saving solutions. Household robots, like robotic vacuum cleaners, smart home assistants, and automated lawnmowers, offer users the ability to delegate routine tasks, allowing them to focus on more meaningful activities. 

Moreover, the growth of the IoT and the affordability of robotic technologies contribute further to the expansion of the household robots market. As these technologies become more accessible and meet the evolving needs and expectations of consumers for intelligent and automated home solutions. Therefore, the global household robots market is likely to witness a sustained upward trajectory during the market forecast period.

Market Trends

The emergence of e-commerce as a platform is an emerging trend shaping market growth. The emergence of e-commerce has significantly contributed to driving the growth of the global household robots market by providing an efficient platform for sales, distribution, and consumer outreach. E-commerce platforms offer a vast reach, enabling manufacturers to connect with a global consumer base. Notable instances include the availability of robotic vacuum cleaners, smart home assistants, and other household robots on major e-commerce platforms such as Amazon, Alibaba, and various specialized online retailers. These platforms provide comprehensive product information, customer reviews, and a seamless purchasing experience.

Furthermore, consumers can explore and order these products from the comfort of their homes, reinforcing the appeal of these technologies in enhancing daily life. Such factors are expected to drive the market growth during the forecast period. 

Market Challenge

The high cost associated with household robotic systems is a significant challenge hindering market growth. The intricate technology embedded in household robots, including advanced sensors, AI, and precision engineering, contributes to the high production costs. Manufacturers often invest heavily in research and development to enhance the capabilities of these robots, driving up overall expenses. The cost of materials and components used in the manufacturing process, such as high-quality plastics, durable metals, and sophisticated electronic components, adds to the overall production cost. 

Moreover, the relatively limited volume of production compared to more established consumer electronics markets, such as smartphones or televisions, contributes to higher per-unit manufacturing costs. The consequence of these factors is reflected in the retail prices of household robotic systems, making them less accessible to a broader consumer base. Affordability remains a crucial consideration for many potential buyers, especially in price-sensitive markets. Thus, such factors will hamper the growth of the market during the forecast period.

Exclusive Customer Landscape

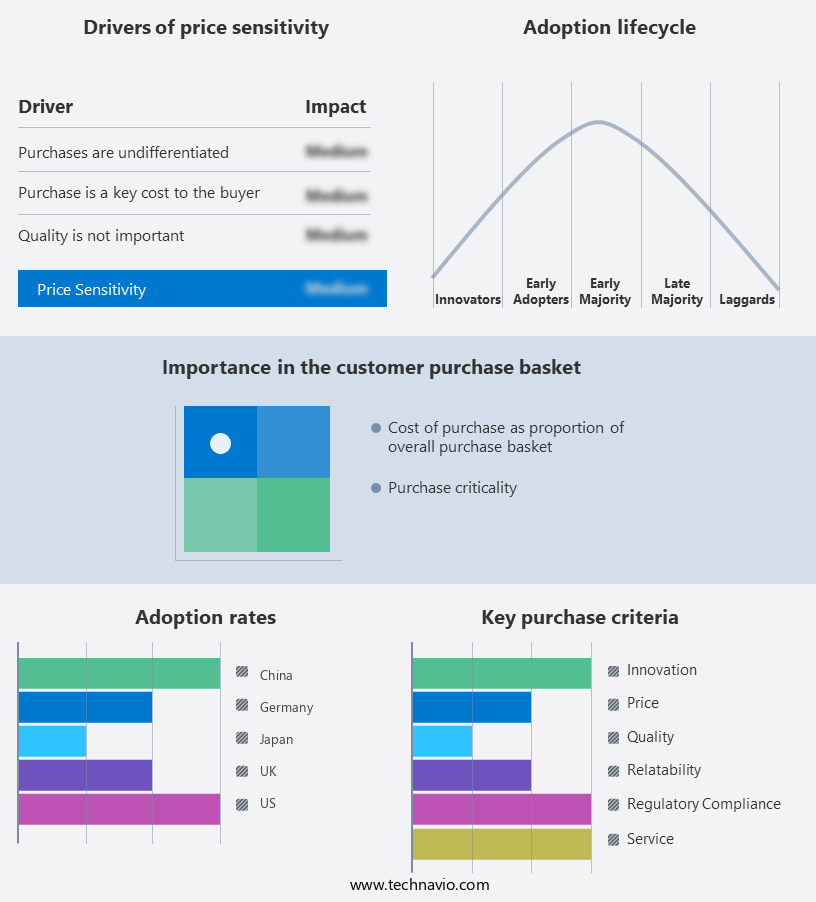
The market forecasting report includes the adoption lifecycle of the market, covering from the innovator's stage to the laggard's stage. It focuses on adoption rates in different regions based on penetration. Furthermore, the report also includes key purchase criteria and drivers of price sensitivity to help companies evaluate and develop their market growth analysis strategies.

Household Robots Market Share by Geography

 Customer Landscape

Key Companies & Market Insights

Companies are implementing various strategies, such as strategic alliances, partnerships, mergers and acquisitions, geographical expansion, and product/service launches, to enhance their presence in the market.

AIRROBO - The company offers household robots such as the Airrobo P20 robot vacuum that thoroughly picks up and disposes of debris, pet hair, and food crumbs from hard floors and carpets at high suction power 2800Pa.

The market research and growth report includes detailed analyses of the competitive landscape of the market and information about key companies, including:

  • Alfred Karcher SE and Co KG
  • Beijing Roborock Technology Co. Ltd.
  • BLUE FROG ROBOTICS SAS
  • Bobsweep Inc.
  • Dyson Group Co.
  • Ecovacs Robotics Co. Ltd.
  • Hayward Holdings Inc.
  • Husqvarna AB
  • ILIFE INNOVATION Ltd.
  • iRobot Corp.
  • LG Electronics Inc.
  • Maytronics Ltd.
  • Miele and Cie. KG
  • Panasonic Holdings Corp.
  • Robert Bosch GmbH
  • Samsung Electronics Co. Ltd.
  • Stanley Black and Decker Inc.
  • Vorwerk Deutschland Stiftung and Co. KG
  • Xiaomi Communications Co. Ltd.

Qualitative and quantitative analysis of companies has been conducted to help clients understand the wider business environment as well as the strengths and weaknesses of key market players. Data is qualitatively analyzed to categorize companies as pure play, category-focused, industry-focused, and diversified; it is quantitatively analyzed to categorize companies as dominant, leading, strong, tentative, and weak.

Research Analyst Overview

Household robots have gained significant focus in the robotics industry due to their endurance capability and charging capabilities, making them an attractive solution for consumers seeking convenience and usability. Technologies such as artificial intelligence and IoT devices have fueled innovations in this market, allowing robots to perform various household chores with ease. Indoor and outdoor robots, including vacuuming robots, pool cleaning robots, and lawn mowing robots, offer cost-efficiency and consistency in productivity. The adoption rate of domestic robots is rapidly increasing, driven by the aging population in developed countries and the need for better healthcare and accessibility. The affordability and availability of these robots, along with improvements in their initial purchase price and customer support, have made them an attractive option for consumers.

However, regulatory issues surrounding the protection of data and personal information are major concerns for consumers. Floor plans and smartphone applications have become authentic applications for controlling and monitoring household robots. The revenue potential of this market is significant, with major market players investing in advancements in technology and marketing strategies to sell robots to consumers. Despite the benefits, challenges such as reliability, maintenance, and repair costs remain. Innovations in battery technology, such as nickel-metal hydride batteries and self-charge features, have addressed some of these concerns. Voice commands, AI, and navigation features have also added to the convenience of using household robots.

In conclusion, the increasing interest in robots for various applications, from entertainment to elderly care, has led to the emergence of new players in the market. Lightweight designs, increased power, and pet tools have added to the hygienic cleaning solution offered by robots. Big data and machine vision cameras have improved the performance and intelligence of these robots, making them an essential part of the digital transformation in households.

Market Scope

Report Coverage

Details

Page number

152

Base year

2023

Historic period

2018-2022

Forecast period

2024-2028

Growth momentum & CAGR

Accelerate at a CAGR of 18.01%

Market growth 2024-2028

USD 13.26 billion

Market structure

Fragmented

YoY growth 2023-2024(%)

17.48

Regional analysis

North America, Europe, APAC, Middle East and Africa, and South America

Performing market contribution

North America at 32%

Key countries

US, China, Japan, UK, and Germany

Competitive landscape

Leading Companies, Market Positioning of Companies, Competitive Strategies, and Industry Risks

Key companies profiled

AIRROBO, Alfred Karcher SE and Co KG, Beijing Roborock Technology Co. Ltd., BLUE FROG ROBOTICS SAS, Bobsweep Inc., Dyson Group Co., Ecovacs Robotics Co. Ltd., Hayward Holdings Inc., Husqvarna AB, ILIFE INNOVATION Ltd., iRobot Corp., LG Electronics Inc., Maytronics Ltd., Miele and Cie. KG, Panasonic Holdings Corp., Robert Bosch GmbH, Samsung Electronics Co. Ltd., Stanley Black and Decker Inc., Vorwerk Deutschland Stiftung and Co. KG, and Xiaomi Communications Co. Ltd.

Market dynamics

Parent market analysis, market growth inducers and obstacles, market forecast, fast-growing and slow-growing segment analysis, COVID-19 impact and recovery analysis and future consumer dynamics, market condition analysis for the forecast period

Customization purview

If our market report has not included the data that you are looking for, you can reach out to our analysts and get segments customized.

Request Free Sample

What are the Key Data Covered in this Market Research and Growth Report?

  • CAGR of the market during the forecast period
  • Detailed information on factors that will drive the market growth and forecasting between 2024 and 2028
  • Precise estimation of the size of the market  and its contribution of the market in focus to the parent market
  • Accurate predictions about upcoming market growth and trends and changes in consumer behaviour
  • Growth of the market across North America, Europe, APAC, Middle East and Africa, and South America
  • Thorough analysis of the market's competitive landscape and detailed information about companies
  • Comprehensive analysis of factors that will challenge the growth of market companies

We can help! Our analysts can customize this market research report to meet your requirements. Get in touch

1 Executive Summary

  • 1.1 Market overview
    • Exhibit 01: Executive Summary – Chart on Market Overview
    • Exhibit 02: Executive Summary – Data Table on Market Overview
    • Exhibit 03: Executive Summary – Chart on Global Market Characteristics
    • Exhibit 04: Executive Summary – Chart on Market by Geography
    • Exhibit 05: Executive Summary – Chart on Market Segmentation by Type
    • Exhibit 06: Executive Summary – Chart on Market Segmentation by Distribution Channel
    • Exhibit 07: Executive Summary – Chart on Incremental Growth
    • Exhibit 08: Executive Summary – Data Table on Incremental Growth
    • Exhibit 09: Executive Summary – Chart on Vendor Market Positioning

2 Market Landscape

  • 2.1 Market ecosystem
    • Exhibit 10: Parent market
    • Exhibit 11: Market Characteristics

3 Market Sizing

  • 3.1 Market definition
    • Exhibit 12: Offerings of vendors included in the market definition
  • 3.2 Market segment analysis
    • Exhibit 13: Market segments
  • 3.3 Market size 2023
    • 3.4 Market outlook: Forecast for 2023-2028
      • Exhibit 14: Chart on Global - Market size and forecast 2023-2028 ($ billion)
      • Exhibit 15: Data Table on Global - Market size and forecast 2023-2028 ($ billion)
      • Exhibit 16: Chart on Global Market: Year-over-year growth 2023-2028 (%)
      • Exhibit 17: Data Table on Global Market: Year-over-year growth 2023-2028 (%)

    4 Historic Market Size

    • 4.1 Global household robots market 2018 - 2022
      • Exhibit 18: Historic Market Size – Data Table on global household robots market 2018 - 2022 ($ billion)
    • 4.2 Type Segment Analysis 2018 - 2022
      • Exhibit 19: Historic Market Size – Type Segment 2018 - 2022 ($ billion)
    • 4.3 Distribution Channel Segment Analysis 2018 - 2022
      • Exhibit 20: Historic Market Size – Distribution Channel Segment 2018 - 2022 ($ billion)
    • 4.4 Geography Segment Analysis 2018 - 2022
      • Exhibit 21: Historic Market Size – Geography Segment 2018 - 2022 ($ billion)
    • 4.5 Country Segment Analysis 2018 - 2022
      • Exhibit 22: Historic Market Size – Country Segment 2018 - 2022 ($ billion)

    5 Five Forces Analysis

    • 5.1 Five forces summary
      • Exhibit 23: Five forces analysis - Comparison between 2023 and 2028
    • 5.2 Bargaining power of buyers
      • Exhibit 24: Chart on Bargaining power of buyers – Impact of key factors 2023 and 2028
    • 5.3 Bargaining power of suppliers
      • Exhibit 25: Bargaining power of suppliers – Impact of key factors in 2023 and 2028
    • 5.4 Threat of new entrants
      • Exhibit 26: Threat of new entrants – Impact of key factors in 2023 and 2028
    • 5.5 Threat of substitutes
      • Exhibit 27: Threat of substitutes – Impact of key factors in 2023 and 2028
    • 5.6 Threat of rivalry
      • Exhibit 28: Threat of rivalry – Impact of key factors in 2023 and 2028
    • 5.7 Market condition
      • Exhibit 29: Chart on Market condition - Five forces 2023 and 2028

    6 Market Segmentation by Type

    • 6.1 Market segments
      • Exhibit 30: Chart on Type - Market share 2023-2028 (%)
      • Exhibit 31: Data Table on Type - Market share 2023-2028 (%)
    • 6.2 Comparison by Type
      • Exhibit 32: Chart on Comparison by Type
      • Exhibit 33: Data Table on Comparison by Type
    • 6.3 Domestic - Market size and forecast 2023-2028
      • Exhibit 34: Chart on Domestic - Market size and forecast 2023-2028 ($ billion)
      • Exhibit 35: Data Table on Domestic - Market size and forecast 2023-2028 ($ billion)
      • Exhibit 36: Chart on Domestic - Year-over-year growth 2023-2028 (%)
      • Exhibit 37: Data Table on Domestic - Year-over-year growth 2023-2028 (%)
    • 6.4 Entertainment and leisure robots - Market size and forecast 2023-2028
      • Exhibit 38: Chart on Entertainment and leisure robots - Market size and forecast 2023-2028 ($ billion)
      • Exhibit 39: Data Table on Entertainment and leisure robots - Market size and forecast 2023-2028 ($ billion)
      • Exhibit 40: Chart on Entertainment and leisure robots - Year-over-year growth 2023-2028 (%)
      • Exhibit 41: Data Table on Entertainment and leisure robots - Year-over-year growth 2023-2028 (%)
    • 6.5 Market opportunity by Type
      • Exhibit 42: Market opportunity by Type ($ billion)
      • Exhibit 43: Data Table on Market opportunity by Type ($ billion)

    7 Market Segmentation by Distribution Channel

    • 7.1 Market segments
      • Exhibit 44: Chart on Distribution Channel - Market share 2023-2028 (%)
      • Exhibit 45: Data Table on Distribution Channel - Market share 2023-2028 (%)
    • 7.2 Comparison by Distribution Channel
      • Exhibit 46: Chart on Comparison by Distribution Channel
      • Exhibit 47: Data Table on Comparison by Distribution Channel
    • 7.3 Online - Market size and forecast 2023-2028
      • Exhibit 48: Chart on Online - Market size and forecast 2023-2028 ($ billion)
      • Exhibit 49: Data Table on Online - Market size and forecast 2023-2028 ($ billion)
      • Exhibit 50: Chart on Online - Year-over-year growth 2023-2028 (%)
      • Exhibit 51: Data Table on Online - Year-over-year growth 2023-2028 (%)
    • 7.4 Offline - Market size and forecast 2023-2028
      • Exhibit 52: Chart on Offline - Market size and forecast 2023-2028 ($ billion)
      • Exhibit 53: Data Table on Offline - Market size and forecast 2023-2028 ($ billion)
      • Exhibit 54: Chart on Offline - Year-over-year growth 2023-2028 (%)
      • Exhibit 55: Data Table on Offline - Year-over-year growth 2023-2028 (%)
    • 7.5 Market opportunity by Distribution Channel
      • Exhibit 56: Market opportunity by Distribution Channel ($ billion)
      • Exhibit 57: Data Table on Market opportunity by Distribution Channel ($ billion)

    8 Customer Landscape

    • 8.1 Customer landscape overview
      • Exhibit 58: Analysis of price sensitivity, lifecycle, customer purchase basket, adoption rates, and purchase criteria

    9 Geographic Landscape

    • 9.1 Geographic segmentation
      • Exhibit 59: Chart on Market share by geography 2023-2028 (%)
      • Exhibit 60: Data Table on Market share by geography 2023-2028 (%)
    • 9.2 Geographic comparison
      • Exhibit 61: Chart on Geographic comparison
      • Exhibit 62: Data Table on Geographic comparison
    • 9.3 North America - Market size and forecast 2023-2028
      • Exhibit 63: Chart on North America - Market size and forecast 2023-2028 ($ billion)
      • Exhibit 64: Data Table on North America - Market size and forecast 2023-2028 ($ billion)
      • Exhibit 65: Chart on North America - Year-over-year growth 2023-2028 (%)
      • Exhibit 66: Data Table on North America - Year-over-year growth 2023-2028 (%)
    • 9.4 Europe - Market size and forecast 2023-2028
      • Exhibit 67: Chart on Europe - Market size and forecast 2023-2028 ($ billion)
      • Exhibit 68: Data Table on Europe - Market size and forecast 2023-2028 ($ billion)
      • Exhibit 69: Chart on Europe - Year-over-year growth 2023-2028 (%)
      • Exhibit 70: Data Table on Europe - Year-over-year growth 2023-2028 (%)
    • 9.5 APAC - Market size and forecast 2023-2028
      • Exhibit 71: Chart on APAC - Market size and forecast 2023-2028 ($ billion)
      • Exhibit 72: Data Table on APAC - Market size and forecast 2023-2028 ($ billion)
      • Exhibit 73: Chart on APAC - Year-over-year growth 2023-2028 (%)
      • Exhibit 74: Data Table on APAC - Year-over-year growth 2023-2028 (%)
    • 9.6 Middle East and Africa - Market size and forecast 2023-2028
      • Exhibit 75: Chart on Middle East and Africa - Market size and forecast 2023-2028 ($ billion)
      • Exhibit 76: Data Table on Middle East and Africa - Market size and forecast 2023-2028 ($ billion)
      • Exhibit 77: Chart on Middle East and Africa - Year-over-year growth 2023-2028 (%)
      • Exhibit 78: Data Table on Middle East and Africa - Year-over-year growth 2023-2028 (%)
    • 9.7 South America - Market size and forecast 2023-2028
      • Exhibit 79: Chart on South America - Market size and forecast 2023-2028 ($ billion)
      • Exhibit 80: Data Table on South America - Market size and forecast 2023-2028 ($ billion)
      • Exhibit 81: Chart on South America - Year-over-year growth 2023-2028 (%)
      • Exhibit 82: Data Table on South America - Year-over-year growth 2023-2028 (%)
    • 9.8 US - Market size and forecast 2023-2028
      • Exhibit 83: Chart on US - Market size and forecast 2023-2028 ($ billion)
      • Exhibit 84: Data Table on US - Market size and forecast 2023-2028 ($ billion)
      • Exhibit 85: Chart on US - Year-over-year growth 2023-2028 (%)
      • Exhibit 86: Data Table on US - Year-over-year growth 2023-2028 (%)
    • 9.9 China - Market size and forecast 2023-2028
      • Exhibit 87: Chart on China - Market size and forecast 2023-2028 ($ billion)
      • Exhibit 88: Data Table on China - Market size and forecast 2023-2028 ($ billion)
      • Exhibit 89: Chart on China - Year-over-year growth 2023-2028 (%)
      • Exhibit 90: Data Table on China - Year-over-year growth 2023-2028 (%)
    • 9.10 UK - Market size and forecast 2023-2028
      • Exhibit 91: Chart on UK - Market size and forecast 2023-2028 ($ billion)
      • Exhibit 92: Data Table on UK - Market size and forecast 2023-2028 ($ billion)
      • Exhibit 93: Chart on UK - Year-over-year growth 2023-2028 (%)
      • Exhibit 94: Data Table on UK - Year-over-year growth 2023-2028 (%)
    • 9.11 Germany - Market size and forecast 2023-2028
      • Exhibit 95: Chart on Germany - Market size and forecast 2023-2028 ($ billion)
      • Exhibit 96: Data Table on Germany - Market size and forecast 2023-2028 ($ billion)
      • Exhibit 97: Chart on Germany - Year-over-year growth 2023-2028 (%)
      • Exhibit 98: Data Table on Germany - Year-over-year growth 2023-2028 (%)
    • 9.12 Japan - Market size and forecast 2023-2028
      • Exhibit 99: Chart on Japan - Market size and forecast 2023-2028 ($ billion)
      • Exhibit 100: Data Table on Japan - Market size and forecast 2023-2028 ($ billion)
      • Exhibit 101: Chart on Japan - Year-over-year growth 2023-2028 (%)
      • Exhibit 102: Data Table on Japan - Year-over-year growth 2023-2028 (%)
    • 9.13 Market opportunity by geography
      • Exhibit 103: Market opportunity by geography ($ billion)
      • Exhibit 104: Data Tables on Market opportunity by geography ($ billion)

    10 Drivers, Challenges, and Trends

    • 10.1 Market drivers
      • 10.2 Market challenges
        • 10.3 Impact of drivers and challenges
          • Exhibit 105: Impact of drivers and challenges in 2023 and 2028
        • 10.4 Market trends

          11 Vendor Landscape

          • 11.1 Overview
            • 11.2 Vendor landscape
              • Exhibit 106: Overview on Criticality of inputs and Factors of differentiation
            • 11.3 Landscape disruption
              • Exhibit 107: Overview on factors of disruption
            • 11.4 Industry risks
              • Exhibit 108: Impact of key risks on business

            12 Vendor Analysis

            • 12.1 Vendors covered
              • Exhibit 109: Vendors covered
            • 12.2 Market positioning of vendors
              • Exhibit 110: Matrix on vendor position and classification
            • 12.3 AIRROBO
              • Exhibit 111: AIRROBO - Overview
              • Exhibit 112: AIRROBO - Product / Service
              • Exhibit 113: AIRROBO - Key offerings
            • 12.4 Alfred Karcher SE and Co KG
              • Exhibit 114: Alfred Karcher SE and Co KG - Overview
              • Exhibit 115: Alfred Karcher SE and Co KG - Product / Service
              • Exhibit 116: Alfred Karcher SE and Co KG - Key offerings
            • 12.5 BLUE FROG ROBOTICS SAS
              • Exhibit 117: BLUE FROG ROBOTICS SAS - Overview
              • Exhibit 118: BLUE FROG ROBOTICS SAS - Product / Service
              • Exhibit 119: BLUE FROG ROBOTICS SAS - Key offerings
            • 12.6 Bobsweep Inc.
              • Exhibit 120: Bobsweep Inc. - Overview
              • Exhibit 121: Bobsweep Inc. - Product / Service
              • Exhibit 122: Bobsweep Inc. - Key offerings
            • 12.7 Dyson Group Co.
              • Exhibit 123: Dyson Group Co. - Overview
              • Exhibit 124: Dyson Group Co. - Product / Service
              • Exhibit 125: Dyson Group Co. - Key offerings
            • 12.8 Ecovacs Robotics Co. Ltd.
              • Exhibit 126: Ecovacs Robotics Co. Ltd. - Overview
              • Exhibit 127: Ecovacs Robotics Co. Ltd. - Product / Service
              • Exhibit 128: Ecovacs Robotics Co. Ltd. - Key offerings
            • 12.9 Hayward Holdings Inc.
              • Exhibit 129: Hayward Holdings Inc. - Overview
              • Exhibit 130: Hayward Holdings Inc. - Business segments
              • Exhibit 131: Hayward Holdings Inc. - Key news
              • Exhibit 132: Hayward Holdings Inc. - Key offerings
              • Exhibit 133: Hayward Holdings Inc. - Segment focus
            • 12.10 Husqvarna AB
              • Exhibit 134: Husqvarna AB - Overview
              • Exhibit 135: Husqvarna AB - Business segments
              • Exhibit 136: Husqvarna AB - Key news
              • Exhibit 137: Husqvarna AB - Key offerings
              • Exhibit 138: Husqvarna AB - Segment focus
            • 12.11 iRobot Corp.
              • Exhibit 139: iRobot Corp. - Overview
              • Exhibit 140: iRobot Corp. - Product / Service
              • Exhibit 141: iRobot Corp. - Key offerings
            • 12.12 LG Electronics Inc.
              • Exhibit 142: LG Electronics Inc. - Overview
              • Exhibit 143: LG Electronics Inc. - Product / Service
              • Exhibit 144: LG Electronics Inc. - Key offerings
            • 12.13 Maytronics Ltd.
              • Exhibit 145: Maytronics Ltd. - Overview
              • Exhibit 146: Maytronics Ltd. - Product / Service
              • Exhibit 147: Maytronics Ltd. - Key offerings
            • 12.14 Robert Bosch GmbH
              • Exhibit 148: Robert Bosch GmbH - Overview
              • Exhibit 149: Robert Bosch GmbH - Business segments
              • Exhibit 150: Robert Bosch GmbH - Key news
              • Exhibit 151: Robert Bosch GmbH - Key offerings
              • Exhibit 152: Robert Bosch GmbH - Segment focus
            • 12.15 Samsung Electronics Co. Ltd.
              • Exhibit 153: Samsung Electronics Co. Ltd. - Overview
              • Exhibit 154: Samsung Electronics Co. Ltd. - Business segments
              • Exhibit 155: Samsung Electronics Co. Ltd. - Key news
              • Exhibit 156: Samsung Electronics Co. Ltd. - Key offerings
              • Exhibit 157: Samsung Electronics Co. Ltd. - Segment focus
            • 12.16 Vorwerk Deutschland Stiftung and Co. KG
              • Exhibit 158: Vorwerk Deutschland Stiftung and Co. KG - Overview
              • Exhibit 159: Vorwerk Deutschland Stiftung and Co. KG - Product / Service
              • Exhibit 160: Vorwerk Deutschland Stiftung and Co. KG - Key offerings
            • 12.17 Xiaomi Communications Co. Ltd.
              • Exhibit 161: Xiaomi Communications Co. Ltd. - Overview
              • Exhibit 162: Xiaomi Communications Co. Ltd. - Business segments
              • Exhibit 163: Xiaomi Communications Co. Ltd. - Key news
              • Exhibit 164: Xiaomi Communications Co. Ltd. - Key offerings
              • Exhibit 165: Xiaomi Communications Co. Ltd. - Segment focus

            13 Appendix

            • 13.1 Scope of the report
              • 13.2 Inclusions and exclusions checklist
                • Exhibit 166: Inclusions checklist
                • Exhibit 167: Exclusions checklist
              • 13.3 Currency conversion rates for US$
                • Exhibit 168: Currency conversion rates for US$
              • 13.4 Research methodology
                • Exhibit 169: Research methodology
                • Exhibit 170: Validation techniques employed for market sizing
                • Exhibit 171: Information sources
              • 13.5 List of abbreviations
                • Exhibit 172: List of abbreviations

              Research Methodology

              Technavio presents a detailed picture of the market by way of study, synthesis, and summation of data from multiple sources. The analysts have presented the various facets of the market with a particular focus on identifying the key industry influencers. The data thus presented is comprehensive, reliable, and the result of extensive research, both primary and secondary.

              INFORMATION SOURCES

              Primary sources

              • Manufacturers and suppliers
              • Channel partners
              • Industry experts
              • Strategic decision makers

              Secondary sources

              • Industry journals and periodicals
              • Government data
              • Financial reports of key industry players
              • Historical data
              • Press releases

              DATA ANALYSIS

              Data Synthesis

              • Collation of data
              • Estimation of key figures
              • Analysis of derived insights

              Data Validation

              • Triangulation with data models
              • Reference against proprietary databases
              • Corroboration with industry experts

              REPORT WRITING

              Qualitative

              • Market drivers
              • Market challenges
              • Market trends
              • Five forces analysis

              Quantitative

              • Market size and forecast
              • Market segmentation
              • Geographical insights
              • Competitive landscape

              Interested in this report?

              Get your sample now to see our research methodology and insights!

              Download Now

              Frequently Asked Questions

              Household Robots market growth will increase by $ 13.26 bn during 2024-2028.

              The Household Robots market is expected to grow at a CAGR of 18.01% during 2024-2028.

              Household Robots market is segmented by Type( Domestic, Entertainment, leisure robots) Distribution Channel( Online, Offline)

              AIRROBO, Alfred Karcher SE and Co KG, Beijing Roborock Technology Co. Ltd., BLUE FROG ROBOTICS SAS, Bobsweep Inc., Dyson Group Co., Ecovacs Robotics Co. Ltd., Hayward Holdings Inc., Husqvarna AB, ILIFE INNOVATION Ltd., iRobot Corp., LG Electronics Inc., Maytronics Ltd., Miele and Cie. KG, Panasonic Holdings Corp., Robert Bosch GmbH, Samsung Electronics Co. Ltd., Stanley Black and Decker Inc., Vorwerk Deutschland Stiftung and Co. KG, Xiaomi Communications Co. Ltd. are a few of the key vendors in the Household Robots market.

              North America will register the highest growth rate of 32% among the other regions. Therefore, the Household Robots market in North America is expected to garner significant business opportunities for the vendors during the forecast period.

              US, China, Japan, UK, Germany

              • Growing demand for robotic automation processes is the driving factor this market.

              The Household Robots market vendors should focus on grabbing business opportunities from the Domestic segment as it accounted for the largest market share in the base year.