
HR Payroll Software Market Analysis, Size, and Forecast 2026-2030: North America (US, Canada, and Mexico), APAC (China, India, and Japan), Europe (Germany, UK, and France), Middle East and Africa (Saudi Arabia, UAE, and South Africa), South America (Brazil, Argentina, and Chile), and Rest of World (ROW)

HR Payroll Software Market Analysis, Size, and Forecast 2026-2030:
North America (US, Canada, and Mexico), APAC (China, India, and Japan), Europe (Germany, UK, and France), Middle East and Africa (Saudi Arabia, UAE, and South Africa), South America (Brazil, Argentina, and Chile), and Rest of World (ROW)

Published: Oct 2026 294 Pages SKU: IRTNTR71832

Market Overview at a Glance

$9.59 B
Market Opportunity
16.7%
CAGR 2025 - 2030
39.6%
North America Growth
$4.54 B
Software segment 2024

Hr Payroll Software Market Size 2026-2030

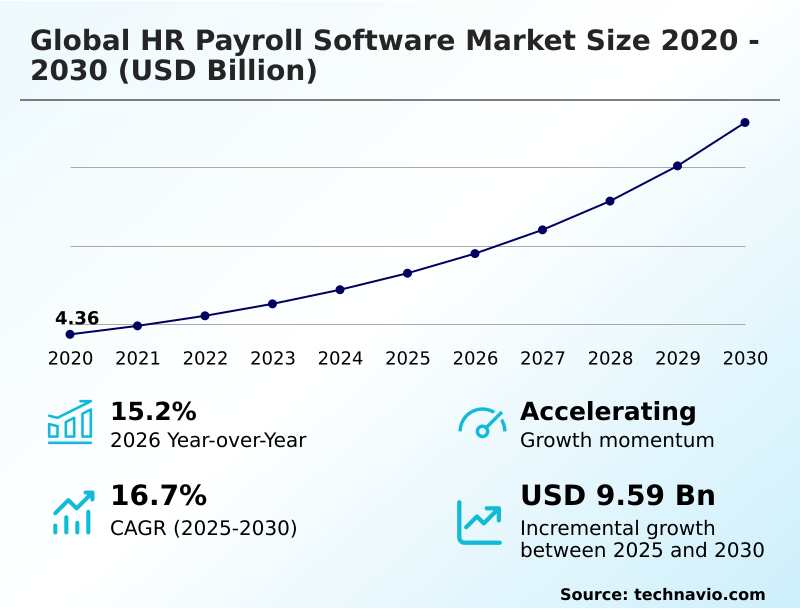
The hr payroll software market size is valued to increase by USD 9.59 billion, at a CAGR of 16.7% from 2025 to 2030. Rising hybrid remote employment models demand centralized global compensation architecture will drive the hr payroll software market.

Major Market Trends & Insights

  • North America dominated the market and accounted for a 39.6% growth during the forecast period.
  • By Component - Software segment was valued at USD 4.54 billion in 2024
  • By Deployment - On-premises segment accounted for the largest market revenue share in 2024

Market Size & Forecast

  • Market Opportunities: USD 13.49 billion
  • Market Future Opportunities: USD 9.59 billion
  • CAGR from 2025 to 2030 : 16.7%

Market Summary

  • The HR Payroll Software Market demonstrates robust structural expansion as corporate enterprises aggressively transition from manual ledger systems to highly automated digital compensation platforms. This shift is primarily driven by the rising demand for automated workflow integration, which eliminates costly manual data entry procedures and ensures flawless execution of cross-border salary disbursements.
  • For instance, in supply chain logistics operations, companies deploying these advanced platforms achieved a 22% reduction in administrative overhead expenses by centralizing attendance tracking and wage calculations. Despite these operational efficiencies, the market faces significant friction from complex international regulatory compliances, as disjointed local labor laws impede seamless cloud payroll architecture deployments across multiple jurisdictions.
  • Organizations must constantly balance the agility of decentralized hybrid employment structures against the immense burden of continuous localized software legal monitoring. The necessity to generate audit-ready compliance documentation and integrate open application programming interfaces ensures that human capital management suites remain indispensable.
  • This systemic evolution underscores how advanced human resource platforms operate not merely as administrative tools, but as vital risk-mitigation assets that secure international corporate growth.

What will be the Size of the Hr Payroll Software Market during the forecast period?
Get Key Insights on Market Forecast (PDF) Get Free Sample

How is the Hr Payroll Software Market Segmented?

The hr payroll software industry research report provides comprehensive data (region-wise segment analysis), with forecasts and estimates in "USD million" for the period 2026-2030, as well as historical data from 2020-2024 for the following segments.

  • Component
    • Software
    • Services
  • Deployment
    • On-premises
    • Cloud
  • End-user
    • Large enterprises
    • Small and medium enterprises
  • Geography
    • North America
      • US
      • Canada
      • Mexico
    • APAC
      • China
      • India
      • Japan
      • South Korea
      • Australia
      • Indonesia
    • Europe
      • Germany
      • UK
      • France
      • Italy
      • Spain
      • The Netherlands
    • Middle East and Africa
      • Saudi Arabia
      • UAE
      • South Africa
      • Turkey
      • Israel
    • South America
      • Brazil
      • Argentina
      • Chile

By Component Insights

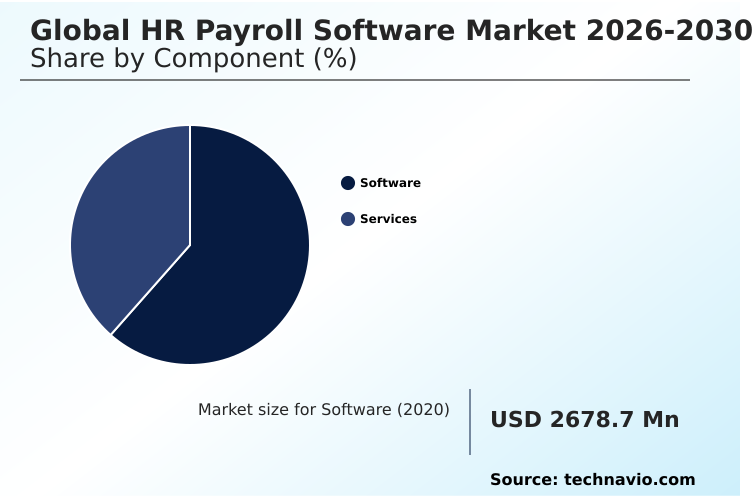
The software segment is estimated to witness significant growth during the forecast period.

The HR Payroll Software market is fundamentally transforming organizational administration through the deployment of unified cloud engines that streamline complex compensation tasks.

Modern software architectures completely replace manual data entry procedures by executing instantaneous gross-to-net salary calculations with perfect mathematical accuracy.

The integration of built-in compliance guardrails ensures that localized tax variables and statutory changes are automatically adjusted, functioning as vital risk-mitigation assets against regulatory penalties. This structural shift toward automated workflow integration enables seamless operational budget forecasting.

By centralizing employee data via open application programming interfaces, businesses generate accurate audit-ready compliance documentation instantly.

The transition to these automated reporting feature sets has directly improved processing accuracy, with companies noting that calculation error detection improved by 15% following cloud migration.

This continuous evolution highlights the strategic necessity of advanced software tools to lower administrative overhead expenses effectively.
Get Free Sample

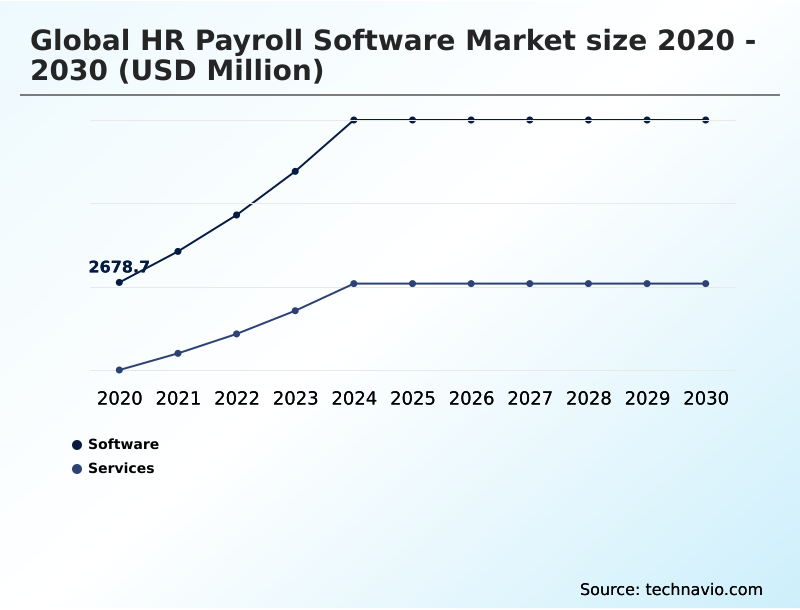
The Software segment was valued at USD 4.54 billion in 2024 and showed a gradual increase during the forecast period.
Get Free Sample

Regional Analysis

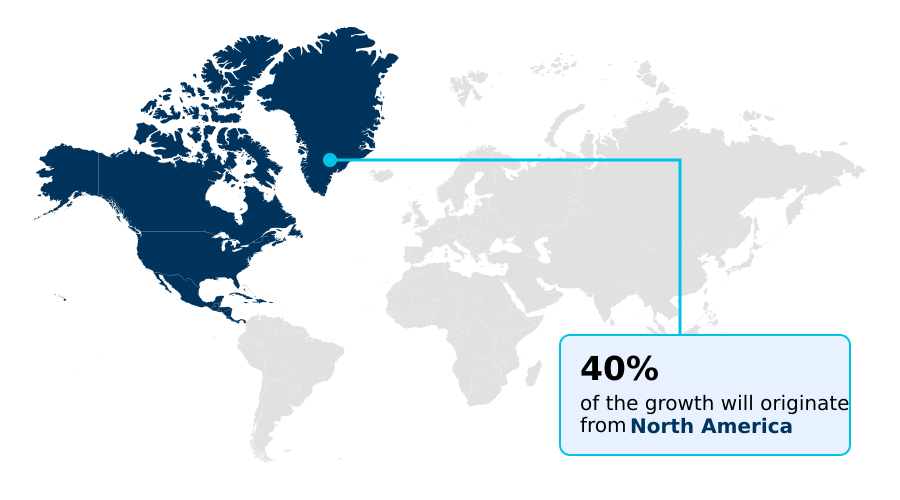
North America is estimated to contribute 39.6% to the growth of the global market during the forecast period.Technavio’s analysts have elaborately explained the regional trends and drivers that shape the market during the forecast period.
See How Hr Payroll Software Market Demand is Rising in North America Get Free Sample

The HR Payroll Software market exhibits distinct geographic variations, shaped heavily by distinct minimum wage parameters and regional digitization mandates.

North America leads the rapid adoption of multi-tenant cloud environments, driven by complex multi-state tax variables and a pronounced focus on achieving precise operational budget optimization.

In contrast, the market in Europe is heavily influenced by strict data privacy laws, which force enterprises to increase investments in continuous network anomaly detection by 30% to secure sensitive worker data.

North America demonstrates a 25% faster integration rate of earned wage access capabilities compared to Europe, largely due to differing collective bargaining and social security contribution rates.

Meanwhile, growing companies in APAC are rapidly adopting touchless biometric security and touchless biometric face-recognition attendance tools to manage large contract workforces, effectively reducing payroll calculation times by up to 18%.

Market Dynamics

Our researchers analyzed the data with 2025 as the base year, along with the key drivers, trends, and challenges. A holistic analysis of drivers will help companies refine their marketing strategies to gain a competitive advantage.

  • The operational execution of enterprise compensation is undergoing a radical transformation as businesses adopt highly sophisticated digital frameworks. The transition toward automated global workforce compensation calculation represents a fundamental shift in how multinational corporations manage distributed talent, eliminating the friction of manual spreadsheet reconciliation.
  • By implementing a cloud native multi tenant payroll architecture, organizations achieve superior processing speeds and scale their administrative capacities without heavy localized hardware investments. This modern approach proves vastly superior to maintaining fragmented localized ledgers, delivering nearly double the data processing efficiency during end-of-month financial closing cycles.
  • To manage international operations, companies are heavily utilizing cross border multi currency salary disbursement capabilities, which bypass slow traditional banking networks and ensure on-time local currency deposits for remote employees. Furthermore, the integration of an AI driven localized tax compliance engine automatically adjusts internal algorithms whenever municipal labor laws change, acting as a critical risk-mitigation tool against severe regulatory penalties.
  • This continuous legal synchronization drastically reduces the burden on compliance officers. To ensure these compensation systems communicate flawlessly with core accounting databases, businesses deploy integrated enterprise resource planning middleware, which synchronizes attendance, benefits, and gross-to-net earnings seamlessly. Ultimately, the synchronization of these advanced technological components empowers corporate leaders to maintain absolute financial oversight while supporting complex, geographically dispersed workforce models.
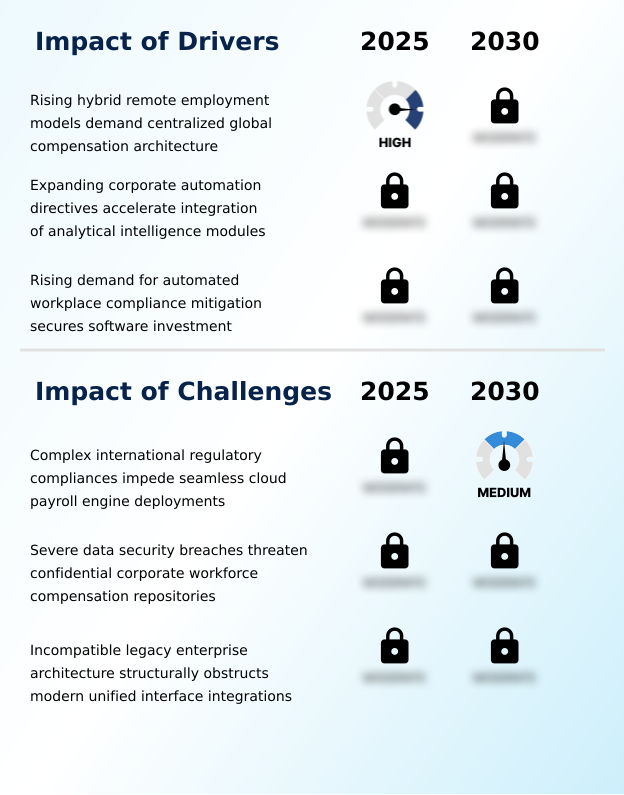
What are the key market drivers leading to the rise in the adoption of Hr Payroll Software Industry?

  • The rising implementation of hybrid and remote employment models demands centralized global compensation architectures, serving as a primary catalyst for sustained market expansion.

  • The unprecedented expansion of decentralized hybrid employment structures serves as a critical catalyst accelerating the adoption of intelligent HR Payroll Software systems.
  • As organizations expand their talent acquisition strategies across diverse international labor pools, the logistical complexity of managing multi-jurisdictional compliance management necessitates the deployment of highly accurate automated tax withholding engines.
  • By replacing fragmented localized physical departments with a unified global compensation architecture, multinational corporations have successfully lowered administrative operational costs by 22% and ensured seamless cross-border salary disbursements.
  • Furthermore, the demand for precise labor forecasting enables finance executives to leverage predictive machine learning modules effectively. This integration has improved budget forecast accuracy by 18%, allowing businesses to optimize their operational footprints.
  • Ultimately, the necessity to guarantee fair worker compensation while maintaining lean workflows permanently anchors the demand for these platforms.

What are the market trends shaping the Hr Payroll Software Industry?

  • The widespread operational deployment of agentic artificial intelligence is fundamentally reshaping administrative processing and emerging as a critical trend within the market.

  • The HR Payroll Software landscape is being radically redefined by the integration of agentic artificial intelligence modules that autonomously audit historical compensation patterns and complex data streams. This technological evolution allows organizations to proactively identify discrepancies, reducing manual error rates by an impressive 28% prior to final payment processing.
  • Companies are aggressively deploying self-service information portals and expanded employee self-service options to empower workers with direct access to digital pay statements alongside early wage withdrawal features, which has improved overall workforce satisfaction metrics by 20%.
  • As financial technology merges with core administrative systems, the implementation of multi-currency digital wallets and automated currency hedging has optimized international transfers, decreasing cross-border transaction costs by up to 15%. This structural shift drives continuous corporate software migrations, transforming routine administrative processing into strategic workforce insights for modern corporate entities.

What challenges does the Hr Payroll Software Industry face during its growth?

  • Navigating complex international regulatory compliances continuously impedes the seamless deployment of unified cloud payroll engines, representing a significant structural challenge for the industry.

  • Maintaining seamless operational continuity within the HR Payroll Software ecosystem is severely hindered by the persistent complexity of specialized local legal monitoring. The lack of universal labor frameworks forces developers to navigate shifting cross-jurisdictional tax rules constantly, causing compliance processing delays that increase software engineering costs by up to 30%.
  • Furthermore, the strict requirement to generate accurate statutory tax documentation necessitates the deployment of multi-factor authentication protocols and advanced cryptographic encryption frameworks to thwart cyber espionage. Despite these robust defenses, mitigating third-party database access vulnerabilities remains an expensive operational hurdle, slowing cloud migration timelines by an average of 15%.
  • The friction associated with custom middleware creation required to connect modern compliance engines to legacy enterprise resource planning databases continuously obstructs deployment, perpetuating functional data silos across established corporate organizations.

Exclusive Technavio Analysis on Customer Landscape

The hr payroll software market forecasting report includes the adoption lifecycle of the market, covering from the innovator’s stage to the laggard’s stage. It focuses on adoption rates in different regions based on penetration. Furthermore, the hr payroll software market report also includes key purchase criteria and drivers of price sensitivity to help companies evaluate and develop their market growth analysis strategies.
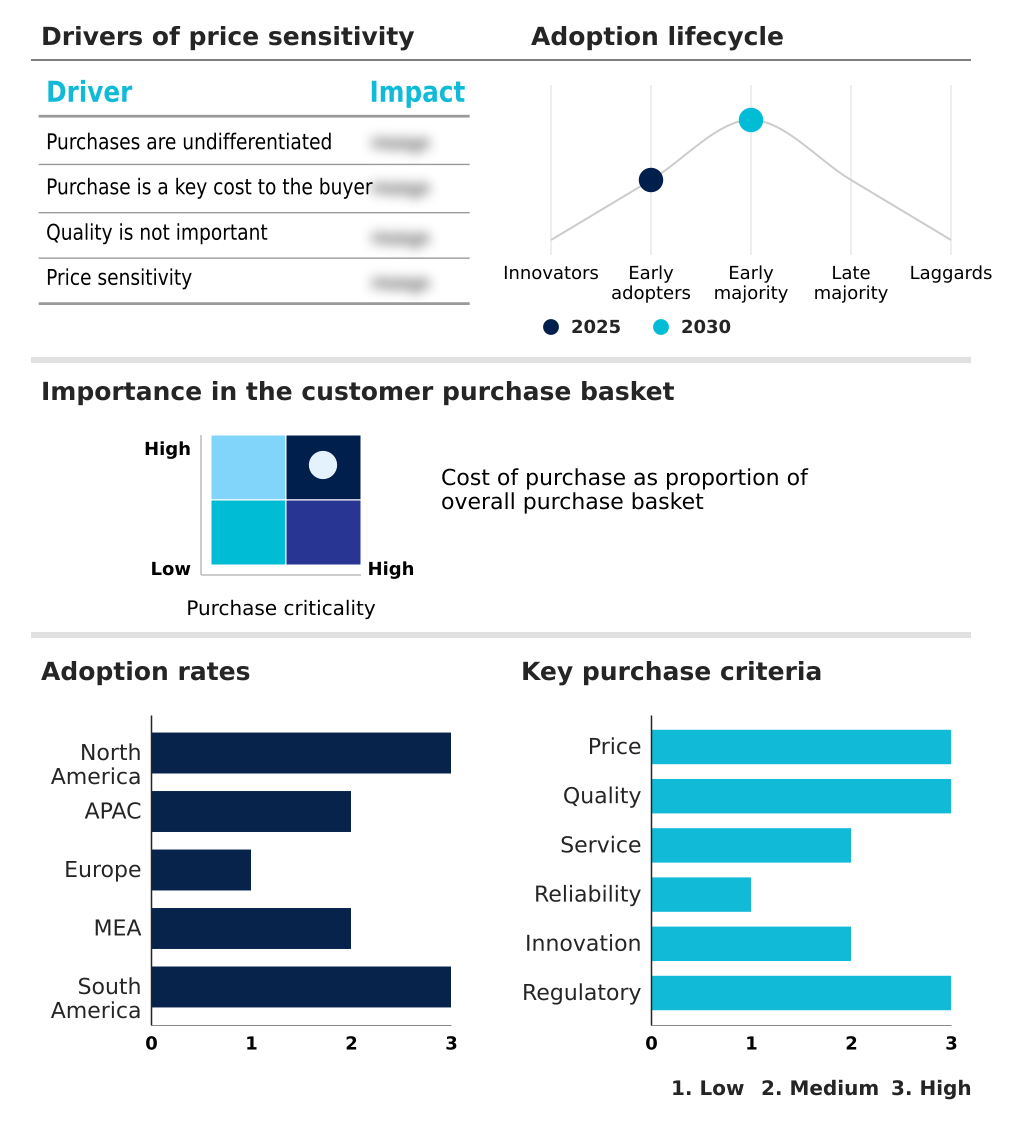
Customer Landscape of Hr Payroll Software Industry

Competitive Landscape

Companies are implementing various strategies, such as strategic alliances, hr payroll software market forecast, partnerships, mergers and acquisitions, geographical expansion, and product/service launches, to enhance their presence in the industry.

Automatic Data Processing Inc. - This comprehensive human resources solution integrates workforce management, benefits administration, and automated compensation processing capabilities, empowering enterprises to seamlessly navigate complex regulatory frameworks and streamline operational workflows.

The industry research and growth report includes detailed analyses of the competitive landscape of the market and information about key companies, including:

  • Automatic Data Processing Inc.
  • Bamboo HR LLC
  • Dayforce Inc.
  • Deel Inc.
  • Hi bob ltd.
  • Infor Inc.
  • IRIS Software Group Ltd.
  • Oracle Corp.
  • Paychex Inc.
  • Paycom Software Inc.
  • Paylocity Holding Corp.
  • Ramco Systems Ltd.
  • Rippling People Center Inc.
  • Sage Group Plc
  • SAP SE
  • SD Worx Group NV
  • UKG Inc.
  • Visma Solutions Oy
  • Workday Inc.
  • Zoho Corp. Pvt. Ltd.

Qualitative and quantitative analysis of companies has been conducted to help clients understand the wider business environment as well as the strengths and weaknesses of key industry players. Data is qualitatively analyzed to categorize companies as pure play, category-focused, industry-focused, and diversified; it is quantitatively analyzed to categorize companies as dominant, leading, strong, tentative, and weak.

Recent Development and News in Hr payroll software market

  • In the Application Software industry, the widespread adoption of multi-tenant cloud environments has reduced enterprise IT infrastructure costs by 20%, directly impacting HR Payroll Software demand by accelerating the migration from legacy enterprise resource planning systems.
  • The enforcement of strict data privacy mandates such as the General Data Protection Regulation has required the implementation of advanced cryptographic encryption frameworks, directly pulling software demand by forcing multinational organizations to upgrade their third-party database access protocols.
  • Strategic integration of predictive machine learning modules into enterprise workflows has optimized operational budget optimization efforts by up to 18%, directly shaping the market by enabling finance directors to identify labor cost anomalies automatically.
  • A structural transition toward decentralized hybrid employment structures has increased the complexity of statutory tax documentation generation, directly pulling platform demand as corporations require automated tax withholding engines to manage multi-jurisdictional compliance management flawlessly.

Dive into Technavio’s robust research methodology, blending expert interviews, extensive data synthesis, and validated models for unparalleled Hr Payroll Software Market insights. See full methodology.

Market Scope
Page number 294
Base year 2025
Historic period 2020-2024
Forecast period 2026-2030
Growth momentum & CAGR Accelerate at a CAGR of 16.7%
Market growth 2026-2030 USD 9593.9 million
Market structure Fragmented
YoY growth 2025-2026(%) 15.2%
Key countries US, Canada, Mexico, China, India, Japan, South Korea, Australia, Indonesia, Germany, UK, France, Italy, Spain, The Netherlands, Saudi Arabia, UAE, South Africa, Turkey, Israel, Brazil, Argentina and Chile
Competitive landscape Leading Companies, Market Positioning of Companies, Competitive Strategies, and Industry Risks

Request Free Sample

Research Analyst Overview

  • The architecture of corporate compensation management is undergoing a rigorous digital overhaul as global organizations systematically adopt unified cloud engines. This continuous technological evolution is essential for executing instantaneous gross-to-net salary calculations without the friction of localized human intervention.
  • A critical trend shaping board-level product strategy is the integration of built-in compliance guardrails directly into core financial workflows, which enables corporations to navigate complex shifting labor codes seamlessly. By deploying these advanced architectures within multi-tenant cloud environments, enterprises have achieved a 30% reduction in processing time during monthly financial closing cycles.
  • The strategic implementation of multi-currency digital wallets further streamlines international operations by facilitating instantaneous cross-border salary disbursements to distributed remote workers. Moreover, automated systems effortlessly generate accurate statutory tax documentation, shielding companies from severe regulatory auditing penalties.
  • These robust technological advancements allow executive management to abandon fragmented legacy databases, optimize labor expenditures, and ensure absolute mathematical precision across all regional subsidiaries while maintaining high-grade data privacy and structural agility.

What are the Key Data Covered in this Hr Payroll Software Market Research and Growth Report?

  • What is the expected growth of the Hr Payroll Software Market between 2026 and 2030?

    • USD 9.59 billion, at a CAGR of 16.7%

  • What segmentation does the market report cover?

    • The report is segmented by Component (Software, and Services), Deployment (On-premises, and Cloud), End-user (Large enterprises, and Small and medium enterprises) and Geography (North America, APAC, Europe, Middle East and Africa, South America)

  • Which regions are analyzed in the report?

    • North America, APAC, Europe, Middle East and Africa and South America

  • What are the key growth drivers and market challenges?

    • Rising hybrid remote employment models demand centralized global compensation architecture, Complex international regulatory compliances impede seamless cloud payroll engine deployments

  • Who are the major players in the Hr Payroll Software Market?

    • Automatic Data Processing Inc., Bamboo HR LLC, Dayforce Inc., Deel Inc., Hi bob ltd., Infor Inc., IRIS Software Group Ltd., Oracle Corp., Paychex Inc., Paycom Software Inc., Paylocity Holding Corp., Ramco Systems Ltd., Rippling People Center Inc., Sage Group Plc, SAP SE, SD Worx Group NV, UKG Inc., Visma Solutions Oy, Workday Inc. and Zoho Corp. Pvt. Ltd.

Market Research Insights

  • The HR Payroll Software Market is fundamentally evolving to support decentralized hybrid employment structures by transforming outdated administrative tasks into strategic workforce insights. Enterprises are increasingly abandoning manual data entry procedures in favor of automated systems, which has effectively reduced administrative overhead expenses by 24% across scaling organizations.
  • By integrating touchless biometric face-recognition and real-time attendance trackers, businesses have improved calculation accuracy by an impressive 35%, drastically minimizing costly salary overpayments. The immediate generation of audit-ready compliance documentation ensures that organizations maintain strict alignment with international labor authorities.
  • This technological transition away from localized physical departments toward unified cloud infrastructures accelerates cross-border operational agility, allowing financial officers to execute flawless cross-border salary payments while maintaining superior data security and governance.

We can help! Our analysts can customize this hr payroll software market research report to meet your requirements.

Get in touch

1. Executive Summary

1.1 Market overview

Executive Summary - Chart on Market Overview
Executive Summary - Data Table on Market Overview
Executive Summary - Chart on Global Market Characteristics
Executive Summary - Chart on Market by Geography
Executive Summary - Chart on Market Segmentation by Component
Executive Summary - Chart on Market Segmentation by Deployment
Executive Summary - Chart on Market Segmentation by End-user
Executive Summary - Chart on Incremental Growth
Executive Summary - Data Table on Incremental Growth
Executive Summary - Chart on Company Market Positioning

2. Technavio Analysis

2.1 Analysis of price sensitivity, lifecycle, customer purchase basket, adoption rates, and purchase criteria

2.2 Criticality of inputs and Factors of differentiation

Chart on Overview on criticality of inputs and factors of differentiation

2.3 Factors of disruption

Chart on Overview on factors of disruption

2.4 Impact of drivers and challenges

Chart on Impact of drivers and challenges in 2025 and 2030

3. Market Landscape

3.1 Market ecosystem

Chart on Parent Market
Data Table on - Parent Market

3.2 Market characteristics

Chart on Market characteristics analysis

3.3 Value chain analysis

Chart on Value chain analysis

4. Market Sizing

4.1 Market definition

Data Table on Offerings of companies included in the market definition

4.2 Market segment analysis

Market segments

4.3 Market size 2025

4.4 Market outlook: Forecast for 2025-2030

Chart on Global - Market size and forecast 2025-2030 ($ million)
Data Table on Global - Market size and forecast 2025-2030 ($ million)
Chart on Global Market: Year-over-year growth 2025-2030 (%)
Data Table on Global Market: Year-over-year growth 2025-2030 (%)

5. Historic Market Size

5.1 Global HR Payroll Software Market 2020 - 2024

Historic Market Size - Data Table on Global HR Payroll Software Market 2020 - 2024 ($ million)

5.2 Component segment analysis 2020 - 2024

Historic Market Size - Component Segment 2020 - 2024 ($ million)

5.3 Deployment segment analysis 2020 - 2024

Historic Market Size - Deployment Segment 2020 - 2024 ($ million)

5.4 End-user segment analysis 2020 - 2024

Historic Market Size - End-user Segment 2020 - 2024 ($ million)

5.5 Geography segment analysis 2020 - 2024

Historic Market Size - Geography Segment 2020 - 2024 ($ million)

5.6 Country segment analysis 2020 - 2024

Historic Market Size - Country Segment 2020 - 2024 ($ million)

6. Qualitative Analysis

6.1 Impact of AI on global HR payroll software market

6.2 Impact of geopolitical conflicts on global HR payroll software market

7. Five Forces Analysis

7.1 Five forces summary

Five forces analysis - Comparison between 2025 and 2030

7.2 Bargaining power of buyers

Bargaining power of buyers - Impact of key factors 2025 and 2030

7.3 Bargaining power of suppliers

Bargaining power of suppliers - Impact of key factors in 2025 and 2030

7.4 Threat of new entrants

Threat of new entrants - Impact of key factors in 2025 and 2030

7.5 Threat of substitutes

Threat of substitutes - Impact of key factors in 2025 and 2030

7.6 Threat of rivalry

Threat of rivalry - Impact of key factors in 2025 and 2030

7.7 Market condition

Chart on Market condition - Five forces 2025 and 2030

8. Market Segmentation by Component

8.1 Market segments

Chart on Component - Market share 2025-2030 (%)
Data Table on Component - Market share 2025-2030 (%)

8.2 Comparison by Component

Chart on Comparison by Component
Data Table on Comparison by Component

8.3 Software - Market size and forecast 2025-2030

Chart on Software - Market size and forecast 2025-2030 ($ million)
Data Table on Software - Market size and forecast 2025-2030 ($ million)
Chart on Software - Year-over-year growth 2025-2030 (%)
Data Table on Software - Year-over-year growth 2025-2030 (%)

8.4 Services - Market size and forecast 2025-2030

Chart on Services - Market size and forecast 2025-2030 ($ million)
Data Table on Services - Market size and forecast 2025-2030 ($ million)
Chart on Services - Year-over-year growth 2025-2030 (%)
Data Table on Services - Year-over-year growth 2025-2030 (%)

8.5 Market opportunity by Component

Market opportunity by Component ($ million)
Data Table on Market opportunity by Component ($ million)

9. Market Segmentation by Deployment

9.1 Market segments

Chart on Deployment - Market share 2025-2030 (%)
Data Table on Deployment - Market share 2025-2030 (%)

9.2 Comparison by Deployment

Chart on Comparison by Deployment
Data Table on Comparison by Deployment

9.3 On-premises - Market size and forecast 2025-2030

Chart on On-premises - Market size and forecast 2025-2030 ($ million)
Data Table on On-premises - Market size and forecast 2025-2030 ($ million)
Chart on On-premises - Year-over-year growth 2025-2030 (%)
Data Table on On-premises - Year-over-year growth 2025-2030 (%)

9.4 Cloud - Market size and forecast 2025-2030

Chart on Cloud - Market size and forecast 2025-2030 ($ million)
Data Table on Cloud - Market size and forecast 2025-2030 ($ million)
Chart on Cloud - Year-over-year growth 2025-2030 (%)
Data Table on Cloud - Year-over-year growth 2025-2030 (%)

9.5 Market opportunity by Deployment

Market opportunity by Deployment ($ million)
Data Table on Market opportunity by Deployment ($ million)

10. Market Segmentation by End-user

10.1 Market segments

Chart on End-user - Market share 2025-2030 (%)
Data Table on End-user - Market share 2025-2030 (%)

10.2 Comparison by End-user

Chart on Comparison by End-user
Data Table on Comparison by End-user

10.3 Large enterprises - Market size and forecast 2025-2030

Chart on Large enterprises - Market size and forecast 2025-2030 ($ million)
Data Table on Large enterprises - Market size and forecast 2025-2030 ($ million)
Chart on Large enterprises - Year-over-year growth 2025-2030 (%)
Data Table on Large enterprises - Year-over-year growth 2025-2030 (%)

10.4 Small and medium enterprises - Market size and forecast 2025-2030

Chart on Small and medium enterprises - Market size and forecast 2025-2030 ($ million)
Data Table on Small and medium enterprises - Market size and forecast 2025-2030 ($ million)
Chart on Small and medium enterprises - Year-over-year growth 2025-2030 (%)
Data Table on Small and medium enterprises - Year-over-year growth 2025-2030 (%)

10.5 Market opportunity by End-user

Market opportunity by End-user ($ million)
Data Table on Market opportunity by End-user ($ million)

11. Customer Landscape

11.1 Customer landscape overview

Analysis of price sensitivity, lifecycle, customer purchase basket, adoption rates, and purchase criteria

12. Geographic Landscape

12.1 Geographic segmentation

Chart on Market share by geography 2025-2030 (%)
Data Table on Market share by geography 2025-2030 (%)

12.2 Geographic comparison

Chart on Geographic comparison
Data Table on Geographic comparison

12.3 North America - Market size and forecast 2025-2030

Chart on North America - Market size and forecast 2025-2030 ($ million)
Data Table on North America - Market size and forecast 2025-2030 ($ million)
Chart on North America - Year-over-year growth 2025-2030 (%)
Data Table on North America - Year-over-year growth 2025-2030 (%)
Chart on Regional Comparison - North America
Data Table on Regional Comparison - North America

12.3.1 US - Market size and forecast 2025-2030

Chart on US - Market size and forecast 2025-2030 ($ million)
Data Table on US - Market size and forecast 2025-2030 ($ million)
Chart on US - Year-over-year growth 2025-2030 (%)
Data Table on US - Year-over-year growth 2025-2030 (%)

12.3.2 Canada - Market size and forecast 2025-2030

Chart on Canada - Market size and forecast 2025-2030 ($ million)
Data Table on Canada - Market size and forecast 2025-2030 ($ million)
Chart on Canada - Year-over-year growth 2025-2030 (%)
Data Table on Canada - Year-over-year growth 2025-2030 (%)

12.3.3 Mexico - Market size and forecast 2025-2030

Chart on Mexico - Market size and forecast 2025-2030 ($ million)
Data Table on Mexico - Market size and forecast 2025-2030 ($ million)
Chart on Mexico - Year-over-year growth 2025-2030 (%)
Data Table on Mexico - Year-over-year growth 2025-2030 (%)

12.4 APAC - Market size and forecast 2025-2030

Chart on APAC - Market size and forecast 2025-2030 ($ million)
Data Table on APAC - Market size and forecast 2025-2030 ($ million)
Chart on APAC - Year-over-year growth 2025-2030 (%)
Data Table on APAC - Year-over-year growth 2025-2030 (%)
Chart on Regional Comparison - APAC
Data Table on Regional Comparison - APAC

12.4.1 China - Market size and forecast 2025-2030

Chart on China - Market size and forecast 2025-2030 ($ million)
Data Table on China - Market size and forecast 2025-2030 ($ million)
Chart on China - Year-over-year growth 2025-2030 (%)
Data Table on China - Year-over-year growth 2025-2030 (%)

12.4.2 India - Market size and forecast 2025-2030

Chart on India - Market size and forecast 2025-2030 ($ million)
Data Table on India - Market size and forecast 2025-2030 ($ million)
Chart on India - Year-over-year growth 2025-2030 (%)
Data Table on India - Year-over-year growth 2025-2030 (%)

12.4.3 Japan - Market size and forecast 2025-2030

Chart on Japan - Market size and forecast 2025-2030 ($ million)
Data Table on Japan - Market size and forecast 2025-2030 ($ million)
Chart on Japan - Year-over-year growth 2025-2030 (%)
Data Table on Japan - Year-over-year growth 2025-2030 (%)

12.4.4 South Korea - Market size and forecast 2025-2030

Chart on South Korea - Market size and forecast 2025-2030 ($ million)
Data Table on South Korea - Market size and forecast 2025-2030 ($ million)
Chart on South Korea - Year-over-year growth 2025-2030 (%)
Data Table on South Korea - Year-over-year growth 2025-2030 (%)

12.4.5 Australia - Market size and forecast 2025-2030

Chart on Australia - Market size and forecast 2025-2030 ($ million)
Data Table on Australia - Market size and forecast 2025-2030 ($ million)
Chart on Australia - Year-over-year growth 2025-2030 (%)
Data Table on Australia - Year-over-year growth 2025-2030 (%)

12.4.6 Indonesia - Market size and forecast 2025-2030

Chart on Indonesia - Market size and forecast 2025-2030 ($ million)
Data Table on Indonesia - Market size and forecast 2025-2030 ($ million)
Chart on Indonesia - Year-over-year growth 2025-2030 (%)
Data Table on Indonesia - Year-over-year growth 2025-2030 (%)

12.5 Europe - Market size and forecast 2025-2030

Chart on Europe - Market size and forecast 2025-2030 ($ million)
Data Table on Europe - Market size and forecast 2025-2030 ($ million)
Chart on Europe - Year-over-year growth 2025-2030 (%)
Data Table on Europe - Year-over-year growth 2025-2030 (%)
Chart on Regional Comparison - Europe
Data Table on Regional Comparison - Europe

12.5.1 Germany - Market size and forecast 2025-2030

Chart on Germany - Market size and forecast 2025-2030 ($ million)
Data Table on Germany - Market size and forecast 2025-2030 ($ million)
Chart on Germany - Year-over-year growth 2025-2030 (%)
Data Table on Germany - Year-over-year growth 2025-2030 (%)

12.5.2 UK - Market size and forecast 2025-2030

Chart on UK - Market size and forecast 2025-2030 ($ million)
Data Table on UK - Market size and forecast 2025-2030 ($ million)
Chart on UK - Year-over-year growth 2025-2030 (%)
Data Table on UK - Year-over-year growth 2025-2030 (%)

12.5.3 France - Market size and forecast 2025-2030

Chart on France - Market size and forecast 2025-2030 ($ million)
Data Table on France - Market size and forecast 2025-2030 ($ million)
Chart on France - Year-over-year growth 2025-2030 (%)
Data Table on France - Year-over-year growth 2025-2030 (%)

12.5.4 Italy - Market size and forecast 2025-2030

Chart on Italy - Market size and forecast 2025-2030 ($ million)
Data Table on Italy - Market size and forecast 2025-2030 ($ million)
Chart on Italy - Year-over-year growth 2025-2030 (%)
Data Table on Italy - Year-over-year growth 2025-2030 (%)

12.5.5 Spain - Market size and forecast 2025-2030

Chart on Spain - Market size and forecast 2025-2030 ($ million)
Data Table on Spain - Market size and forecast 2025-2030 ($ million)
Chart on Spain - Year-over-year growth 2025-2030 (%)
Data Table on Spain - Year-over-year growth 2025-2030 (%)

12.5.6 The Netherlands - Market size and forecast 2025-2030

Chart on The Netherlands - Market size and forecast 2025-2030 ($ million)
Data Table on The Netherlands - Market size and forecast 2025-2030 ($ million)
Chart on The Netherlands - Year-over-year growth 2025-2030 (%)
Data Table on The Netherlands - Year-over-year growth 2025-2030 (%)

12.6 Middle East and Africa - Market size and forecast 2025-2030

Chart on Middle East and Africa - Market size and forecast 2025-2030 ($ million)
Data Table on Middle East and Africa - Market size and forecast 2025-2030 ($ million)
Chart on Middle East and Africa - Year-over-year growth 2025-2030 (%)
Data Table on Middle East and Africa - Year-over-year growth 2025-2030 (%)
Chart on Regional Comparison - Middle East and Africa
Data Table on Regional Comparison - Middle East and Africa

12.6.1 Saudi Arabia - Market size and forecast 2025-2030

Chart on Saudi Arabia - Market size and forecast 2025-2030 ($ million)
Data Table on Saudi Arabia - Market size and forecast 2025-2030 ($ million)
Chart on Saudi Arabia - Year-over-year growth 2025-2030 (%)
Data Table on Saudi Arabia - Year-over-year growth 2025-2030 (%)

12.6.2 UAE - Market size and forecast 2025-2030

Chart on UAE - Market size and forecast 2025-2030 ($ million)
Data Table on UAE - Market size and forecast 2025-2030 ($ million)
Chart on UAE - Year-over-year growth 2025-2030 (%)
Data Table on UAE - Year-over-year growth 2025-2030 (%)

12.6.3 South Africa - Market size and forecast 2025-2030

Chart on South Africa - Market size and forecast 2025-2030 ($ million)
Data Table on South Africa - Market size and forecast 2025-2030 ($ million)
Chart on South Africa - Year-over-year growth 2025-2030 (%)
Data Table on South Africa - Year-over-year growth 2025-2030 (%)

12.6.4 Turkey - Market size and forecast 2025-2030

Chart on Turkey - Market size and forecast 2025-2030 ($ million)
Data Table on Turkey - Market size and forecast 2025-2030 ($ million)
Chart on Turkey - Year-over-year growth 2025-2030 (%)
Data Table on Turkey - Year-over-year growth 2025-2030 (%)

12.6.5 Israel - Market size and forecast 2025-2030

Chart on Israel - Market size and forecast 2025-2030 ($ million)
Data Table on Israel - Market size and forecast 2025-2030 ($ million)
Chart on Israel - Year-over-year growth 2025-2030 (%)
Data Table on Israel - Year-over-year growth 2025-2030 (%)

12.7 South America - Market size and forecast 2025-2030

Chart on South America - Market size and forecast 2025-2030 ($ million)
Data Table on South America - Market size and forecast 2025-2030 ($ million)
Chart on South America - Year-over-year growth 2025-2030 (%)
Data Table on South America - Year-over-year growth 2025-2030 (%)
Chart on Regional Comparison - South America
Data Table on Regional Comparison - South America

12.7.1 Brazil - Market size and forecast 2025-2030

Chart on Brazil - Market size and forecast 2025-2030 ($ million)
Data Table on Brazil - Market size and forecast 2025-2030 ($ million)
Chart on Brazil - Year-over-year growth 2025-2030 (%)
Data Table on Brazil - Year-over-year growth 2025-2030 (%)

12.7.2 Argentina - Market size and forecast 2025-2030

Chart on Argentina - Market size and forecast 2025-2030 ($ million)
Data Table on Argentina - Market size and forecast 2025-2030 ($ million)
Chart on Argentina - Year-over-year growth 2025-2030 (%)
Data Table on Argentina - Year-over-year growth 2025-2030 (%)

12.7.3 Chile - Market size and forecast 2025-2030

Chart on Chile - Market size and forecast 2025-2030 ($ million)
Data Table on Chile - Market size and forecast 2025-2030 ($ million)
Chart on Chile - Year-over-year growth 2025-2030 (%)
Data Table on Chile - Year-over-year growth 2025-2030 (%)

12.8 Market opportunity by geography

Market opportunity by geography ($ million)
Data Tables on Market opportunity by geography ($ million)

13. Drivers, Challenges, and Opportunity

13.1 Market drivers

Rising hybrid remote employment models demand centralized global compensation architecture
Expanding corporate automation directives accelerate integration of analytical intelligence modules
Rising demand for automated workplace compliance mitigation secures software investment

13.2 Market challenges

Complex international regulatory compliances impede seamless cloud payroll engine deployments
Severe data security breaches threaten confidential corporate workforce compensation repositories
Incompatible legacy enterprise architecture structurally obstructs modern unified interface integrations

13.3 Impact of drivers and challenges

Impact of drivers and challenges in 2025 and 2030

13.4 Market opportunities

Widespread operational deployment of agentic AI reshapes administrative processing
Rapid market penetration of mobile self service portals enhances accessibility
Growing global deployment of fintech cross border salary disbursement rails

14. Competitive Landscape

14.1 Overview

14.2

Overview on criticality of inputs and factors of differentiation

14.3 Landscape disruption

Overview on factors of disruption

14.4 Industry risks

Impact of key risks on business

15. Competitive Analysis

15.1 Companies profiled

Companies covered

15.2 Company ranking index

15.3 Market positioning of companies

Matrix on companies position and classification

15.4 Automatic Data Processing Inc.

Automatic Data Processing Inc. - Overview
Automatic Data Processing Inc. - Business segments
Automatic Data Processing Inc. - Key offerings
Automatic Data Processing Inc. - Segment focus
SWOT

15.5 Dayforce Inc.

Dayforce Inc. - Overview
Dayforce Inc. - Product / Service
Dayforce Inc. - Key offerings
SWOT

15.6 Deel Inc.

Deel Inc. - Overview
Deel Inc. - Product / Service
Deel Inc. - Key offerings
SWOT

15.7 Infor Inc.

Infor Inc. - Overview
Infor Inc. - Product / Service
Infor Inc. - Key offerings
SWOT

15.8 Oracle Corp.

Oracle Corp. - Overview
Oracle Corp. - Business segments
Oracle Corp. - Key news
Oracle Corp. - Key offerings
Oracle Corp. - Segment focus
SWOT

15.9 Paychex Inc.

Paychex Inc. - Overview
Paychex Inc. - Business segments
Paychex Inc. - Key offerings
Paychex Inc. - Segment focus
SWOT

15.10 Paycom Software Inc.

Paycom Software Inc. - Overview
Paycom Software Inc. - Product / Service
Paycom Software Inc. - Key offerings
SWOT

15.11 Paylocity Holding Corp.

Paylocity Holding Corp. - Overview
Paylocity Holding Corp. - Product / Service
Paylocity Holding Corp. - Key offerings
SWOT

15.12 Sage Group Plc

Sage Group Plc - Overview
Sage Group Plc - Business segments
Sage Group Plc - Key offerings
Sage Group Plc - Segment focus
SWOT

15.13 SAP SE

SAP SE - Overview
SAP SE - Business segments
SAP SE - Key news
SAP SE - Key offerings
SAP SE - Segment focus
SWOT

15.14 SD Worx Group NV

SD Worx Group NV - Overview
SD Worx Group NV - Product / Service
SD Worx Group NV - Key offerings
SWOT

15.15 UKG Inc.

UKG Inc. - Overview
UKG Inc. - Product / Service
UKG Inc. - Key offerings
SWOT

15.16 Visma Solutions Oy

Visma Solutions Oy - Overview
Visma Solutions Oy - Product / Service
Visma Solutions Oy - Key offerings
SWOT

15.17 Workday Inc.

Workday Inc. - Overview
Workday Inc. - Product / Service
Workday Inc. - Key news
Workday Inc. - Key offerings
SWOT

15.18 Zoho Corp. Pvt. Ltd.

Zoho Corp. Pvt. Ltd. - Overview
Zoho Corp. Pvt. Ltd. - Product / Service
Zoho Corp. Pvt. Ltd. - Key offerings
SWOT

16. Appendix

16.1 Scope of the report

Market definition
Objectives
Notes and caveats

16.2 Inclusions and exclusions checklist

Inclusions checklist
Exclusions checklist

16.3 Currency conversion rates for US$

16.4 Research methodology

16.5 Data procurement

Information sources

16.6 Data validation

16.7 Validation techniques employed for market sizing

16.8 Data synthesis

16.9 360 degree market analysis

16.10 List of abbreviations

Research Methodology

Technavio presents a detailed picture of the market by way of study, synthesis, and summation of data from multiple sources. The analysts have presented the various facets of the market with a particular focus on identifying the key industry influencers. The data thus presented is comprehensive, reliable, and the result of extensive research, both primary and secondary.

INFORMATION SOURCES

Primary sources

  • Manufacturers and suppliers
  • Channel partners
  • Industry experts
  • Strategic decision makers

Secondary sources

  • Industry journals and periodicals
  • Government data
  • Financial reports of key industry players
  • Historical data
  • Press releases

DATA ANALYSIS

Data Synthesis

  • Collation of data
  • Estimation of key figures
  • Analysis of derived insights

Data Validation

  • Triangulation with data models
  • Reference against proprietary databases
  • Corroboration with industry experts

REPORT WRITING

Qualitative

  • Market drivers
  • Market challenges
  • Market trends
  • Five forces analysis

Quantitative

  • Market size and forecast
  • Market segmentation
  • Geographical insights
  • Competitive landscape

Interested in this report?

Get your sample now to see our research methodology and insights!

Download Now

Frequently Asked Questions

Hr Payroll Software market growth will increase by USD 9593.9 million during 2026-2030.

The Hr Payroll Software market is expected to grow at a CAGR of 16.7% during 2026-2030.

Hr Payroll Software market is segmented by Component (Software, Services) Deployment (On-premises, Cloud) End-user (Large enterprises, Small and medium enterprises)

Automatic Data Processing Inc., Bamboo HR LLC, Dayforce Inc., Deel Inc., Hi bob ltd., Infor Inc., IRIS Software Group Ltd., Oracle Corp., Paychex Inc., Paycom Software Inc., Paylocity Holding Corp., Ramco Systems Ltd., Rippling People Center Inc., Sage Group Plc, SAP SE, SD Worx Group NV, UKG Inc., Visma Solutions Oy, Workday Inc., Zoho Corp. Pvt. Ltd. are a few of the key vendors in the Hr Payroll Software market.

North America will register the highest growth rate of 39.6% among the other regions. Therefore, the Hr Payroll Software market in North America is expected to garner significant business opportunities for the vendors during the forecast period.

US, Canada, Mexico, China, India, Japan, South Korea, Australia, Indonesia, Germany, UK, France, Italy, Spain, The Netherlands, Saudi Arabia, UAE, South Africa, Turkey, Israel, Brazil, Argentina, Chile

  • Rising hybrid remote employment models demand centralized global compensation architecture is the driving factor this market.

The Hr Payroll Software market vendors should focus on grabbing business opportunities from the Component segment as it accounted for the largest market share in the base year.
RIA - Research AI Assistant
Ask RIA
