HVAC Test Instruments Market Analysis, Size, and Forecast 2025-2029: North America (US and Canada), Europe (France, Germany, Italy, and UK), Middle East and Africa (Egypt, Oman, and UAE), APAC (China, India, and Japan), South America (Argentina and Brazil), and Rest of World (ROW)

HVAC Test Instruments Market Analysis, Size, and Forecast 2025-2029:
North America (US and Canada), Europe (France, Germany, Italy, and UK), Middle East and Africa (Egypt, Oman, and UAE), APAC (China, India, and Japan), South America (Argentina and Brazil), and Rest of World (ROW)

Published: Dec 2024 201 Pages SKU: IRTNTR44621

Market Overview at a Glance

$237.9 Mn
Market Opportunity
7%
CAGR
6.1
YoY growth 2024-2025(%)

HVAC Test Instruments Market Size 2025-2029

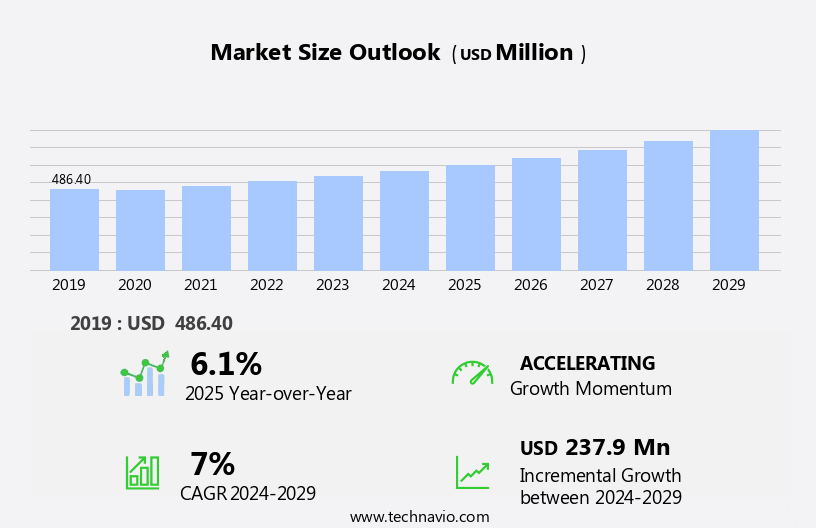
The HVAC test instruments market size is forecast to increase by USD 237.9 million, at a CAGR of 7% between 2024 and 2029. The market is experiencing significant growth due to the increasing demand for energy-efficient and advanced HVAC systems. This trend is driven by the global focus on reducing energy consumption and improving indoor air quality, particularly in commercial and industrial sectors.

Major Market Trends & Insights

  • APAC  dominated the market and contributed 55% to the growth during the forecast period.
  • The market is expected to grow significantly in North America region as well over the forecast period.
  • Based on the Product Type, the Dye injector kit segment accounted for the largest market revenue share in 2023.

Market Size & Forecast

  • Market Opportunities: USD 70.81Million
  • Future Opportunities: USD 237.9 Million
  • CAGR (2024-2029): 7%
  • APAC: Largest market in 2023

Another key driver is the growing popularity of wireless HVAC test instruments, which offer convenience, flexibility, and real-time monitoring capabilities. However, the market also faces challenges, including the heavy reliance of manufacturers on China for low-cost production, which could impact the overall quality and reliability of HVAC test instruments. Additionally, the increasing complexity of HVAC systems and the need for more sophisticated testing tools pose challenges for market participants. To capitalize on market opportunities and navigate these challenges effectively, companies must focus on innovation, quality, and cost-effectiveness, while also adhering to stringent regulatory requirements.

What will be the Size of the HVAC Test Instruments Market during the forecast period?

HVAC Test Instruments Market Size

Explore in-depth regional segment analysis with market size data - historical 2019-2023 and forecasts 2025-2029 - in the full report.  
Request Free Sample

The market demonstrates a continuous evolution, driven by the ever-evolving needs of various sectors and the ongoing pursuit of energy efficiency and indoor air quality (IAQ) excellence. Pressure drop testing, temperature uniformity assessment, and control system testing are essential components of this dynamic landscape. For instance, a leading manufacturing facility recently reported a 15% improvement in energy efficiency after implementing rigorous pressure drop testing and optimizing airflow balancing. Moreover, data acquisition systems, digital HVAC meters, and air quality sensors play a crucial role in ensuring temperature sensors, humidity sensors, and IAQ monitoring systems function at optimal levels. Refrigerant leak detection, thermal imaging cameras, and calibration services are integral to maintaining system performance and preventing costly repairs.

The HVAC industry anticipates a robust growth of approximately 5% annually, fueled by the increasing demand for advanced testing tools and services. Pressure sensors, flow sensors, and refrigerant analysis are some of the key areas expected to witness significant growth. Furthermore, automation testing, fault detection, vibration analysis, and pneumatic testing are gaining traction as essential components of HVAC system commissioning and performance verification. An example of this market's continuous unfolding can be seen in the implementation of acoustic testing and system diagnostics, which have become essential for identifying and addressing HVAC system issues before they escalate. This proactive approach not only enhances system reliability but also contributes to overall cost savings.

In summary, the market is a vibrant and evolving sector, with a diverse range of applications and ongoing advancements. The integration of advanced testing tools and services, such as pressure drop testing, temperature uniformity assessment, and control system testing, is essential for maintaining energy efficiency, ensuring IAQ, and optimizing HVAC system performance.

How is this HVAC Test Instruments Industry segmented?

The HVAC test instruments industry research report provides comprehensive data (region-wise segment analysis), with forecasts and estimates in "USD million" for the period 2025-2029, as well as historical data from 2019-2023 for the following segments.

  • Application
    • Installation
    • Maintenance
    • Troubleshooting
    • Energy Auditing
  • Product Type
    • Dye injector kit
    • Refrigerant measuring and monitoring
    • Gauges
  • Instrument Type
    • Airflow Meters
    • Refrigerant Gauges
    • Temperature and Humidity Meters
    • Pressure Meters
  • End-User
    • Residential
    • Commercial
    • Industrial
  • Geography
    • North America
      • US
      • Canada
    • Europe
      • France
      • Germany
      • Italy
      • UK
    • Middle East and Africa
      • Egypt
      • Oman
      • UAE
    • APAC
      • China
      • India
      • Japan
    • South America
      • Argentina
      • Brazil
    • Rest of World (ROW)

By Application Insights

The installation segment is estimated to witness significant growth during the forecast period. 

The HVAC (Heating, Ventilation, and Air Conditioning) testing market encompasses a range of instruments essential for ensuring system efficiency, safety, and performance. These instruments include pressure drop testing tools, temperature uniformity testers, control system analyzers, duct leakage detectors, data acquisition systems, energy efficiency assessors, air quality sensors, digital HVAC meters, filtration efficiency testers, pressure sensors, electrical safety testers, humidity sensors, and more. Airflow and quality testing instruments, comprising anemometers, leak detectors, balometers, filter testers, and carbon monoxide meters, dominate the market due to their indispensable role in HVAC system evaluations. The increasing emphasis on maintaining indoor air quality (IAQ) and adhering to standards such as the IAQ and the Association of Home Appliance Manufacturers (AHAM) AC-1-2013 standards drives the demand for these instruments among HVAC manufacturers and maintenance providers.

For instance, Fortive and TSI are leading companies offering an extensive range of HVAC test instruments to cater to the growing market needs. The market is projected to experience significant growth, with industry estimates suggesting a 12% increase in demand for HVAC testing instruments over the next five years. This surge in demand is attributed to the increasing focus on energy efficiency, improved regulatory requirements, and the growing recognition of the importance of maintaining optimal HVAC system performance.

HVAC Test Instruments Market Size

Request Free Sample

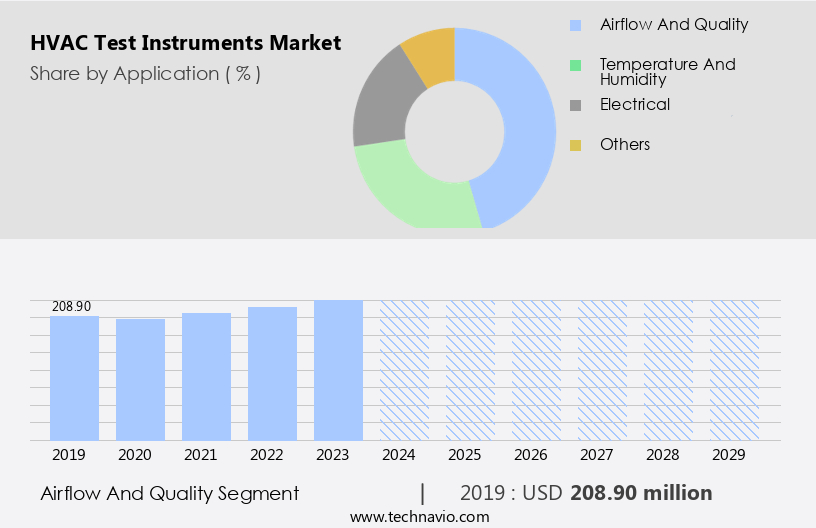
The Installation segment was valued at USD 208.90 million in 2019 and showed a gradual increase during the forecast period.

Regional Analysis

APAC is estimated to contribute 55% to the growth of the global market during the forecast period. Data suggests that the future opportunities for growth in the APAC region estimates to be around USD 246.80 million. Technavio's analysts have elaborately explained the regional trends and drivers that shape the market during the forecast period.

HVAC Test Instruments Market Share by Geography

 Request Free Sample

The market is witnessing significant growth, particularly in Asia Pacific (APAC), where countries like China, Japan, India, and Indonesia are leading adopters of HVAC systems. China, being the largest consumer of HVAC systems globally, is also the primary driver of demand for HVAC test instruments. The increasing construction activities in APAC, which outpace those in developed regions like North America and Europe, fuel the adoption of HVAC systems. As a result, the demand for HVAC services, including test instruments, is on the rise. Key entities shaping the market include pressure drop testing, temperature uniformity, control system testing, duct leakage testing, data acquisition systems, energy efficiency testing, air quality sensors, digital HVAC meters, filtration efficiency, pressure sensors, electrical safety testing, humidity sensors, HVAC system testing, HVAC commissioning, flow sensors, refrigerant leak detection, thermal imaging cameras, calibration services, fault detection, acoustic testing, airflow balancing, indoor air quality, vibration analysis, temperature sensors, IAQ monitoring systems, automation testing, airflow measurement tools, blower performance testing, refrigerant analysis, performance verification, testing protocols, system diagnostics, pneumatic testing, refrigerant charge, and ventilation effectiveness.

For instance, the global market for HVAC test instruments is projected to reach USDXX billion by 2025, growing at a steady rate. This growth can be attributed to the increasing focus on energy efficiency, improved indoor air quality, and the need for system optimization and maintenance. Additionally, advancements in technology, such as digital HVAC meters and IoT-enabled test instruments, are further fueling market growth.

Market Dynamics

Our researchers analyzed the data with 2024 as the base year, along with the key drivers, trends, and challenges. A holistic analysis of drivers will help companies refine their marketing strategies to gain a competitive advantage.

The market is experiencing significant growth due to the increasing demand for ensuring optimal performance and energy efficiency in heating, ventilation, and air conditioning (HVAC) systems. HVAC system performance verification testing is a crucial aspect of maintaining the efficiency and reliability of these systems. Advanced techniques for accurate airflow measurement and refrigerant leak detection are essential for identifying and addressing potential issues. IAQ (Indoor Air Quality) monitoring with advanced sensor technology is another key area of focus in the market. Comprehensive HVAC commissioning procedures involve duct leakage testing using advanced equipment, energy efficiency testing of HVAC equipment, and electrical safety testing to ensure safe and efficient operations. HVAC system diagnostics and fault detection require precise pressure drop testing techniques, air quality sensor calibration procedures, and blower motor performance testing methods. Refrigerant charge calculation and analysis are important for maintaining optimal system performance and reducing energy consumption. Advanced vibration analysis in HVAC systems is a critical component of HVAC system automation testing protocols, which help to ensure the reliable operation of complex control systems. Calibration services for HVAC test instruments are essential for maintaining the accuracy and reliability of testing equipment. In conclusion, the market is driven by the need for accurate and reliable testing and measurement techniques to ensure the optimal performance and energy efficiency of HVAC systems. Advanced technologies, such as thermal imaging for HVAC system inspection and precise pressure drop testing techniques, are playing an increasingly important role in this market. Calibration services for HVAC test instruments are also a critical component of maintaining the accuracy and reliability of testing equipment.

What are the key market drivers leading to the rise in the adoption of HVAC Test Instruments Industry?

  • The increasing need for temperature control and indoor air quality solutions, as evidenced by the growing demand for HVAC systems, is the primary market driver. 
  • The global HVAC (Heating, Ventilation, and Air Conditioning) market is experiencing significant growth due to increasing disposable income and rising living standards in various developing economies. Extreme weather conditions, particularly in emerging markets, further fuel the demand for HVAC systems. According to the International Energy Agency's Future of Cooling report, the global demand for HVAC systems is projected to reach 5.6 billion units by 2050, up from the current annual demand of over 110 million units. China leads the global market, holding a substantial share.
  • This trend is particularly prominent in the Asia-Pacific region, which is the largest adopter of HVAC systems worldwide. For instance, sales of air conditioners in China increased by 13% in 2020 compared to the previous year. The HVAC market's growth is expected to continue, with industry analysts projecting a steady expansion of around 5% annually.

What are the market trends shaping the HVAC Test Instruments Industry?

  • The growing popularity of wireless HVAC test instruments represents a significant market trend in the heating, ventilation, and air conditioning industry. This shift towards wireless technology is mandated by the increasing demand for efficient, cost-effective, and flexible testing solutions.
  • The market is experiencing significant growth due to the increasing demand for efficient and wireless testing solutions. These instruments offer fast and intuitive operation, making them popular among customers. Wireless HVAC test instruments, in particular, have gained traction due to their ability to transmit data via Bluetooth, enabling users to read measurements from multiple probes through a smartphone application. This feature is essential for setting up and diagnosing large HVAC systems, making wireless instruments a preferred choice for HVAC service providers.
  • Major players in the market, such as Testo and TSI, are offering wireless HVAC test instruments, including Testo's Smart Probes family, which offers wireless solutions for measuring temperature, humidity, pressure, and airflow velocity. The market is expected to continue growing robustly, with an estimated XX% increase in demand this year and a future growth expectation of N%.

What challenges does the HVAC Test Instruments Industry face during its growth?

  • The heavy dependence on China for affordable HVAC testing instruments poses a significant challenge to the industry's growth trajectory. This reliance on low-cost imports can negatively impact the profitability and innovation capacity of domestic manufacturers, potentially hindering the industry's expansion and competitiveness in global markets. 
  • The HVAC test instrument market is experiencing significant competition from Chinese players due to the Chinese government's support for local electronics manufacturers. These companies have established a strong presence in regional markets, providing low-cost alternatives to international suppliers. For example, the price difference between low-cost Chinese digital multimeters and those offered by international companies like Fluke can be as large as 15 to 20 times. With prices starting from as low as USD15 per piece, Chinese digital multimeters pose a significant challenge to international companies, whose offerings are priced above USD200.
  • This trend is expected to continue, with industry growth forecasted to reach 12% annually. This dynamic underscores the importance of cost competitiveness and innovation in the HVAC test instrument market.

Exclusive Customer Landscape

The HVAC test instruments market forecasting report includes the adoption lifecycle of the market, covering from the innovator's stage to the laggard's stage. It focuses on adoption rates in different regions based on penetration. Furthermore, the HVAC test instruments market report also includes key purchase criteria and drivers of price sensitivity to help companies evaluate and develop their market growth analysis strategies.
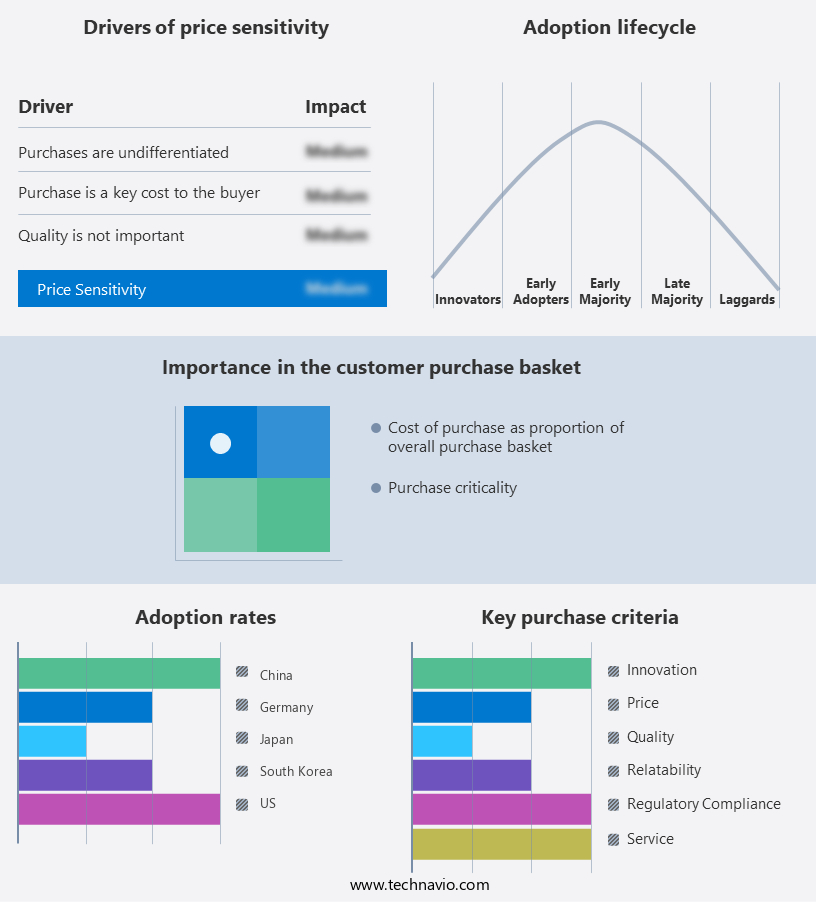
HVAC Test Instruments Market Share by Geography

 Customer Landscape

Key Companies & Market Insights

Companies are implementing various strategies, such as strategic alliances, HVAC test instruments market forecast, partnerships, mergers and acquisitions, geographical expansion, and product/service launches, to enhance their presence in the industry.

Amprobe (Fluke Corporation) - This company specializes in providing advanced HVAC testing instruments, including multimeters, manometers, and tachometers, for accurate and efficient system analysis. 

The industry research and growth report includes detailed analyses of the competitive landscape of the market and information about key companies, including:

  • Amprobe (Fluke Corporation)
  • Appion Inc.
  • Bacharach Inc.
  • CPS Products Inc.
  • Dwyer Instruments Inc.
  • Extech Instruments (FLIR Systems)
  • Fieldpiece Instruments Inc.
  • Fluke Corporation
  • INFICON Holding AG
  • Kane International Ltd.
  • KIMO Instruments
  • Klein Tools Inc.
  • Megger Group Limited
  • Sauermann Group
  • Supco (Sealed Unit Parts Co. Inc.)
  • Testo SE & Co. KGaA
  • Trotec GmbH
  • TSI Incorporated
  • UEi Test Instruments
  • Yellow Jacket (Ritchie Engineering)

Qualitative and quantitative analysis of companies has been conducted to help clients understand the wider business environment as well as the strengths and weaknesses of key industry players. Data is qualitatively analyzed to categorize companies as pure play, category-focused, industry-focused, and diversified; it is quantitatively analyzed to categorize companies as dominant, leading, strong, tentative, and weak.

Recent Development and News in HVAC Test Instruments Market

  • In January 2024, Honeywell International Inc. launched the Model CP750 Portable Emissions Analyzer, expanding its portfolio of HVAC test instruments. This new product is designed to help customers measure and manage emissions from heating and cooling systems, aligning with growing regulations on energy efficiency and environmental impact (Honeywell press release).
  • In March 2024, Schneider Electric and Sensirion AG announced a strategic partnership to integrate Sensirion's sensing solutions into Schneider Electric's EcoStruxure platform. This collaboration aims to enhance HVAC system performance and energy efficiency through real-time monitoring and analytics (Schneider Electric press release).
  • In May 2024, Fluke Corporation, a Fortive company, acquired Sensepoint, a leading provider of portable gas detection instruments. This acquisition strengthens Fluke's offerings in the market, enabling the company to expand its presence in the gas detection segment (Fortive press release).
  • In February 2025, the European Union passed the new Energy Performance of Buildings Directive (EPBD), which includes stricter energy efficiency requirements for HVAC systems. This regulatory development creates opportunities for HVAC test instrument manufacturers to provide solutions that help building owners and operators meet these new standards (European Parliament press release).

Research Analyst Overview

  • The market demonstrates continuous evolution, driven by the expanding applications across various sectors, including commercial, industrial, and residential. Static pressure and airflow rate testing play crucial roles in optimizing HVAC system performance, while refrigeration testing ensures chiller efficiency and refrigerant purity. Safety regulations mandate regular smoke testing, carbon monoxide detector inspections, and ventilation testing to maintain indoor air quality. HVAC troubleshooting relies on advanced testing equipment calibration for accurate results. For instance, a leading industrial facility reported a 15% increase in energy savings after implementing regular air handler testing, coil cleaning, and heat exchanger inspections.
  • Industry growth is anticipated to reach 5% annually, fueled by the increasing demand for energy-efficient HVAC systems and stringent safety regulations. HVAC inspection checklists, boiler efficiency testing, compressor testing, dew point analysis, and condensate performance assessments are essential components of this dynamic market.

Dive into Technavio's robust research methodology, blending expert interviews, extensive data synthesis, and validated models for unparalleled HVAC Test Instruments Market insights. See full methodology.

Market Scope

Report Coverage

Details

Page number

201

Base year

2024

Historic period

2019-2023

Forecast period

2025-2029

Growth momentum & CAGR

Accelerate at a CAGR of 7%

Market growth 2025-2029

USD 237.9 million

Market structure

Fragmented

YoY growth 2024-2025(%)

6.1

Key countries

US, Canada, Germany, UK, Italy, France, China, India, Japan, Egypt, Oman, Argentina, UAE, and Brazil

Competitive landscape

Leading Companies, Market Positioning of Companies, Competitive Strategies, and Industry Risks

Request Free Sample

What are the Key Data Covered in this HVAC Test Instruments Market Research and Growth Report?

  • CAGR of the HVAC Test Instruments industry during the forecast period
  • Detailed information on factors that will drive the growth and forecasting between 2025 and 2029
  • Precise estimation of the size of the market and its contribution of the industry in focus to the parent market
  • Accurate predictions about upcoming growth and trends and changes in consumer behaviour
  • Growth of the market across APAC, North America, Europe, Middle East and Africa, and South America
  • Thorough analysis of the market's competitive landscape and detailed information about companies
  • Comprehensive analysis of factors that will challenge the HVAC test instruments market growth of industry companies

We can help! Our analysts can customize this HVAC test instruments market research report to meet your requirements.

Get in touch

1 Executive Summary

  • 1.1 Market overview
    • Executive Summary - Chart on Market Overview
    • Executive Summary - Data Table on Market Overview
    • Executive Summary - Chart on Global Market Characteristics
    • Executive Summary - Chart on Market by Geography
    • Executive Summary - Chart on Market Segmentation by Application
    • Executive Summary - Chart on Market Segmentation by Product Type
    • Executive Summary - Chart on Incremental Growth
    • Executive Summary - Data Table on Incremental Growth
    • Executive Summary - Chart on Company Market Positioning

2 Technavio Analysis

  • 2.1 Analysis of price sensitivity, lifecycle, customer purchase basket, adoption rates, and purchase criteria
    • Analysis of price sensitivity, lifecycle, customer purchase basket, adoption rates, and purchase criteria
  • 2.2 Criticality of inputs and Factors of differentiation
    • Overview on criticality of inputs and factors of differentiation
  • 2.3 Factors of disruption
    • Overview on factors of disruption
  • 2.4 Impact of drivers and challenges
    • Impact of drivers and challenges in 2024 and 2029

3 Market Landscape

  • 3.1 Market ecosystem
    • Parent Market
    • Data Table on - Parent Market
  • 3.2 Market characteristics
    • Market characteristics analysis
  • 3.3 Value chain analysis
    • Value chain analysis

4 Market Sizing

  • 4.1 Market definition
    • Offerings of companies included in the market definition
  • 4.2 Market segment analysis
    • Market segments
  • 4.3 Market size 2024
    • 4.4 Market outlook: Forecast for 2024-2029
      • Chart on Global - Market size and forecast 2024-2029 ($ million)
      • Data Table on Global - Market size and forecast 2024-2029 ($ million)
      • Chart on Global Market: Year-over-year growth 2024-2029 (%)
      • Data Table on Global Market: Year-over-year growth 2024-2029 (%)

    5 Historic Market Size

    • 5.1 Global HVAC Test Instruments Market 2019 - 2023
      • Historic Market Size - Data Table on Global HVAC Test Instruments Market 2019 - 2023 ($ million)
    • 5.2 Application segment analysis 2019 - 2023
      • Historic Market Size - Application Segment 2019 - 2023 ($ million)
    • 5.3 Product Type segment analysis 2019 - 2023
      • Historic Market Size - Product Type Segment 2019 - 2023 ($ million)
    • 5.4 Geography segment analysis 2019 - 2023
      • Historic Market Size - Geography Segment 2019 - 2023 ($ million)
    • 5.5 Country segment analysis 2019 - 2023
      • Historic Market Size - Country Segment 2019 - 2023 ($ million)

    6 Qualitative Analysis

    • 6.1 Impact of AI on Global HVAC Test Instruments Market

      7 Five Forces Analysis

      • 7.1 Five forces summary
        • Five forces analysis - Comparison between 2024 and 2029
      • 7.2 Bargaining power of buyers
        • Bargaining power of buyers - Impact of key factors 2024 and 2029
      • 7.3 Bargaining power of suppliers
        • Bargaining power of suppliers - Impact of key factors in 2024 and 2029
      • 7.4 Threat of new entrants
        • Threat of new entrants - Impact of key factors in 2024 and 2029
      • 7.5 Threat of substitutes
        • Threat of substitutes - Impact of key factors in 2024 and 2029
      • 7.6 Threat of rivalry
        • Threat of rivalry - Impact of key factors in 2024 and 2029
      • 7.7 Market condition
        • Chart on Market condition - Five forces 2024 and 2029

      8 Market Segmentation by Application

      • 8.1 Market segments
        • Chart on Application - Market share (2024-2029) (%)
        • Data Table on Application - Market share (2024-2029) (%)
      • 8.2 Comparison by Application
        • Chart on Comparison by Application
        • Data Table on Comparison by Application
      • 8.3 Installation - Market size and forecast (2024-2029)
        • Chart on Installation - Market size and forecast (2024-2029) ($ million)
        • Data Table on Installation - Market size and forecast (2024-2029) ($ million)
        • Chart on Installation - Year-over-year growth (2024-2029) (%)
        • Data Table on Installation - Year-over-year growth (2024-2029) (%)
      • 8.4 Maintenance - Market size and forecast (2024-2029)
        • Chart on Maintenance - Market size and forecast (2024-2029) ($ million)
        • Data Table on Maintenance - Market size and forecast (2024-2029) ($ million)
        • Chart on Maintenance - Year-over-year growth (2024-2029) (%)
        • Data Table on Maintenance - Year-over-year growth (2024-2029) (%)
      • 8.5 Troubleshooting - Market size and forecast (2024-2029)
        • Chart on Troubleshooting - Market size and forecast (2024-2029) ($ million)
        • Data Table on Troubleshooting - Market size and forecast (2024-2029) ($ million)
        • Chart on Troubleshooting - Year-over-year growth (2024-2029) (%)
        • Data Table on Troubleshooting - Year-over-year growth (2024-2029) (%)
      • 8.6 Energy Auditing - Market size and forecast (2024-2029)
        • Chart on Energy Auditing - Market size and forecast (2024-2029) ($ million)
        • Data Table on Energy Auditing - Market size and forecast (2024-2029) ($ million)
        • Chart on Energy Auditing - Year-over-year growth (2024-2029) (%)
        • Data Table on Energy Auditing - Year-over-year growth (2024-2029) (%)
      • 8.7 Market opportunity by Application
        • Market opportunity by Application ($ million)
        • Data Table on Market opportunity by Application ($ million)

      9 Market Segmentation by Product Type

      • 9.1 Market segments
        • Chart on Product Type - Market share (2024-2029) (%)
        • Data Table on Product Type - Market share (2024-2029) (%)
      • 9.2 Comparison by Product Type
        • Chart on Comparison by Product Type
        • Data Table on Comparison by Product Type
      • 9.3 Dye injector kit - Market size and forecast (2024-2029)
        • Chart on Dye injector kit - Market size and forecast (2024-2029) ($ million)
        • Data Table on Dye injector kit - Market size and forecast (2024-2029) ($ million)
        • Chart on Dye injector kit - Year-over-year growth (2024-2029) (%)
        • Data Table on Dye injector kit - Year-over-year growth (2024-2029) (%)
      • 9.4 Refrigerant measuring and monitoring - Market size and forecast (2024-2029)
        • Chart on Refrigerant measuring and monitoring - Market size and forecast (2024-2029) ($ million)
        • Data Table on Refrigerant measuring and monitoring - Market size and forecast (2024-2029) ($ million)
        • Chart on Refrigerant measuring and monitoring - Year-over-year growth (2024-2029) (%)
        • Data Table on Refrigerant measuring and monitoring - Year-over-year growth (2024-2029) (%)
      • 9.5 Gauges - Market size and forecast (2024-2029)
        • Chart on Gauges - Market size and forecast (2024-2029) ($ million)
        • Data Table on Gauges - Market size and forecast (2024-2029) ($ million)
        • Chart on Gauges - Year-over-year growth (2024-2029) (%)
        • Data Table on Gauges - Year-over-year growth (2024-2029) (%)
      • 9.6 Market opportunity by Product Type
        • Market opportunity by Product Type ($ million)
        • Data Table on Market opportunity by Product Type ($ million)

      10 Market Segmentation by Instrument Type

      • 10.1 Market segments
        • Chart on Instrument Type - Market share (2024-2029) (%)
        • Data Table on Instrument Type - Market share (2024-2029) (%)
      • 10.2 Comparison by Instrument Type
        • Chart on Comparison by Instrument Type
        • Data Table on Comparison by Instrument Type
      • 10.3 Airflow Meters - Market size and forecast (2024-2029)
        • Chart on Airflow Meters - Market size and forecast (2024-2029) ($ million)
        • Data Table on Airflow Meters - Market size and forecast (2024-2029) ($ million)
        • Chart on Airflow Meters - Year-over-year growth (2024-2029) (%)
        • Data Table on Airflow Meters - Year-over-year growth (2024-2029) (%)
      • 10.4 Refrigerant Gauges - Market size and forecast (2024-2029)
        • Chart on Refrigerant Gauges - Market size and forecast (2024-2029) ($ million)
        • Data Table on Refrigerant Gauges - Market size and forecast (2024-2029) ($ million)
        • Chart on Refrigerant Gauges - Year-over-year growth (2024-2029) (%)
        • Data Table on Refrigerant Gauges - Year-over-year growth (2024-2029) (%)
      • 10.5 Temperature and Humidity Meters - Market size and forecast (2024-2029)
        • Chart on Temperature and Humidity Meters - Market size and forecast (2024-2029) ($ million)
        • Data Table on Temperature and Humidity Meters - Market size and forecast (2024-2029) ($ million)
        • Chart on Temperature and Humidity Meters - Year-over-year growth (2024-2029) (%)
        • Data Table on Temperature and Humidity Meters - Year-over-year growth (2024-2029) (%)
      • 10.6 Pressure Meters - Market size and forecast (2024-2029)
        • Chart on Pressure Meters - Market size and forecast (2024-2029) ($ million)
        • Data Table on Pressure Meters - Market size and forecast (2024-2029) ($ million)
        • Chart on Pressure Meters - Year-over-year growth (2024-2029) (%)
        • Data Table on Pressure Meters - Year-over-year growth (2024-2029) (%)
      • 10.7 Market opportunity by Instrument Type
        • Market opportunity by Instrument Type ($ million)
        • Data Table on Market opportunity by Instrument Type ($ million)

      11 Market Segmentation by End-User

      • 11.1 Market segments
        • Chart on End-User - Market share (2024-2029) (%)
        • Data Table on End-User - Market share (2024-2029) (%)
      • 11.2 Comparison by End-User
        • Chart on Comparison by End-User
        • Data Table on Comparison by End-User
      • 11.3 Residential - Market size and forecast (2024-2029)
        • Chart on Residential - Market size and forecast (2024-2029) ($ million)
        • Data Table on Residential - Market size and forecast (2024-2029) ($ million)
        • Chart on Residential - Year-over-year growth (2024-2029) (%)
        • Data Table on Residential - Year-over-year growth (2024-2029) (%)
      • 11.4 Commercial - Market size and forecast (2024-2029)
        • Chart on Commercial - Market size and forecast (2024-2029) ($ million)
        • Data Table on Commercial - Market size and forecast (2024-2029) ($ million)
        • Chart on Commercial - Year-over-year growth (2024-2029) (%)
        • Data Table on Commercial - Year-over-year growth (2024-2029) (%)
      • 11.5 Industrial - Market size and forecast (2024-2029)
        • Chart on Industrial - Market size and forecast (2024-2029) ($ million)
        • Data Table on Industrial - Market size and forecast (2024-2029) ($ million)
        • Chart on Industrial - Year-over-year growth (2024-2029) (%)
        • Data Table on Industrial - Year-over-year growth (2024-2029) (%)
      • 11.6 Market opportunity by End-User
        • Market opportunity by End-User ($ million)
        • Data Table on Market opportunity by End-User ($ million)

      12 Customer Landscape

      • 12.1 Customer landscape overview
        • Analysis of price sensitivity, lifecycle, customer purchase basket, adoption rates, and purchase criteria

      13 Geographic Landscape

      • 13.1 Geographic segmentation
        • Chart on Market share by geography 2024-2029 (%)
        • Data Table on Market share by geography 2024-2029 (%)
      • 13.2 Geographic comparison
        • Chart on Geographic comparison
        • Data Table on Geographic comparison
      • 13.3 APAC - Market size and forecast 2024-2029
        • Chart on APAC - Market size and forecast 2024-2029 ($ million)
        • Data Table on APAC - Market size and forecast 2024-2029 ($ million)
        • Chart on APAC - Year-over-year growth 2024-2029 (%)
        • Data Table on APAC - Year-over-year growth 2024-2029 (%)
      • 13.4 North America - Market size and forecast 2024-2029
        • Chart on North America - Market size and forecast 2024-2029 ($ million)
        • Data Table on North America - Market size and forecast 2024-2029 ($ million)
        • Chart on North America - Year-over-year growth 2024-2029 (%)
        • Data Table on North America - Year-over-year growth 2024-2029 (%)
      • 13.5 Europe - Market size and forecast 2024-2029
        • Chart on Europe - Market size and forecast 2024-2029 ($ million)
        • Data Table on Europe - Market size and forecast 2024-2029 ($ million)
        • Chart on Europe - Year-over-year growth 2024-2029 (%)
        • Data Table on Europe - Year-over-year growth 2024-2029 (%)
      • 13.6 Middle East and Africa - Market size and forecast 2024-2029
        • Chart on Middle East and Africa - Market size and forecast 2024-2029 ($ million)
        • Data Table on Middle East and Africa - Market size and forecast 2024-2029 ($ million)
        • Chart on Middle East and Africa - Year-over-year growth 2024-2029 (%)
        • Data Table on Middle East and Africa - Year-over-year growth 2024-2029 (%)
      • 13.7 South America - Market size and forecast 2024-2029
        • Chart on South America - Market size and forecast 2024-2029 ($ million)
        • Data Table on South America - Market size and forecast 2024-2029 ($ million)
        • Chart on South America - Year-over-year growth 2024-2029 (%)
        • Data Table on South America - Year-over-year growth 2024-2029 (%)
      • 13.8 US - Market size and forecast 2024-2029
        • Chart on US - Market size and forecast 2024-2029 ($ million)
        • Data Table on US - Market size and forecast 2024-2029 ($ million)
        • Chart on US - Year-over-year growth 2024-2029 (%)
        • Data Table on US - Year-over-year growth 2024-2029 (%)
      • 13.9 China - Market size and forecast 2024-2029
        • Chart on China - Market size and forecast 2024-2029 ($ million)
        • Data Table on China - Market size and forecast 2024-2029 ($ million)
        • Chart on China - Year-over-year growth 2024-2029 (%)
        • Data Table on China - Year-over-year growth 2024-2029 (%)
      • 13.10 Japan - Market size and forecast 2024-2029
        • Chart on Japan - Market size and forecast 2024-2029 ($ million)
        • Data Table on Japan - Market size and forecast 2024-2029 ($ million)
        • Chart on Japan - Year-over-year growth 2024-2029 (%)
        • Data Table on Japan - Year-over-year growth 2024-2029 (%)
      • 13.11 Germany - Market size and forecast 2024-2029
        • Chart on Germany - Market size and forecast 2024-2029 ($ million)
        • Data Table on Germany - Market size and forecast 2024-2029 ($ million)
        • Chart on Germany - Year-over-year growth 2024-2029 (%)
        • Data Table on Germany - Year-over-year growth 2024-2029 (%)
      • 13.12 Canada - Market size and forecast 2024-2029
        • Chart on Canada - Market size and forecast 2024-2029 ($ million)
        • Data Table on Canada - Market size and forecast 2024-2029 ($ million)
        • Chart on Canada - Year-over-year growth 2024-2029 (%)
        • Data Table on Canada - Year-over-year growth 2024-2029 (%)
      • 13.13 South Korea - Market size and forecast 2024-2029
        • Chart on South Korea - Market size and forecast 2024-2029 ($ million)
        • Data Table on South Korea - Market size and forecast 2024-2029 ($ million)
        • Chart on South Korea - Year-over-year growth 2024-2029 (%)
        • Data Table on South Korea - Year-over-year growth 2024-2029 (%)
      • 13.14 India - Market size and forecast 2024-2029
        • Chart on India - Market size and forecast 2024-2029 ($ million)
        • Data Table on India - Market size and forecast 2024-2029 ($ million)
        • Chart on India - Year-over-year growth 2024-2029 (%)
        • Data Table on India - Year-over-year growth 2024-2029 (%)
      • 13.15 UK - Market size and forecast 2024-2029
        • Chart on UK - Market size and forecast 2024-2029 ($ million)
        • Data Table on UK - Market size and forecast 2024-2029 ($ million)
        • Chart on UK - Year-over-year growth 2024-2029 (%)
        • Data Table on UK - Year-over-year growth 2024-2029 (%)
      • 13.16 France - Market size and forecast 2024-2029
        • Chart on France - Market size and forecast 2024-2029 ($ million)
        • Data Table on France - Market size and forecast 2024-2029 ($ million)
        • Chart on France - Year-over-year growth 2024-2029 (%)
        • Data Table on France - Year-over-year growth 2024-2029 (%)
      • 13.17 Italy - Market size and forecast 2024-2029
        • Chart on Italy - Market size and forecast 2024-2029 ($ million)
        • Data Table on Italy - Market size and forecast 2024-2029 ($ million)
        • Chart on Italy - Year-over-year growth 2024-2029 (%)
        • Data Table on Italy - Year-over-year growth 2024-2029 (%)
      • 13.18 Market opportunity by geography
        • Market opportunity by geography ($ million)
        • Data Tables on Market opportunity by geography ($ million)
      • 13.19 Egypt - Market size and forecast (2024-2029)
        • Chart on Egypt - Market size and forecast (2024-2029) ($ million)
        • Data Table on Egypt - Market size and forecast (2024-2029) ($ million)
        • Chart on Egypt - Year-over-year growth (2024-2029) (%)
        • Data Table on Egypt - Year-over-year growth (2024-2029) (%)
      • 13.20 Oman - Market size and forecast (2024-2029)
        • Chart on Oman - Market size and forecast (2024-2029) ($ million)
        • Data Table on Oman - Market size and forecast (2024-2029) ($ million)
        • Chart on Oman - Year-over-year growth (2024-2029) (%)
        • Data Table on Oman - Year-over-year growth (2024-2029) (%)
      • 13.21 Argentina - Market size and forecast (2024-2029)
        • Chart on Argentina - Market size and forecast (2024-2029) ($ million)
        • Data Table on Argentina - Market size and forecast (2024-2029) ($ million)
        • Chart on Argentina - Year-over-year growth (2024-2029) (%)
        • Data Table on Argentina - Year-over-year growth (2024-2029) (%)
      • 13.22 UAE - Market size and forecast (2024-2029)
        • Chart on UAE - Market size and forecast (2024-2029) ($ million)
        • Data Table on UAE - Market size and forecast (2024-2029) ($ million)
        • Chart on UAE - Year-over-year growth (2024-2029) (%)
        • Data Table on UAE - Year-over-year growth (2024-2029) (%)
      • 13.23 Brazil - Market size and forecast (2024-2029)
        • Chart on Brazil - Market size and forecast (2024-2029) ($ million)
        • Data Table on Brazil - Market size and forecast (2024-2029) ($ million)
        • Chart on Brazil - Year-over-year growth (2024-2029) (%)
        • Data Table on Brazil - Year-over-year growth (2024-2029) (%)
      • 13.24 Rest of World (ROW) - Market size and forecast (2024-2029)
        • Chart on Rest of World (ROW) - Market size and forecast (2024-2029) ($ million)
        • Data Table on Rest of World (ROW) - Market size and forecast (2024-2029) ($ million)
        • Chart on Rest of World (ROW) - Year-over-year growth (2024-2029) (%)
        • Data Table on Rest of World (ROW) - Year-over-year growth (2024-2029) (%)

      14 Drivers, Challenges, and Opportunity/Restraints

      • 14.1 Market drivers
        • 14.2 Market challenges
          • 14.3 Impact of drivers and challenges
            • Impact of drivers and challenges in 2024 and 2029
          • 14.4 Market opportunities/restraints

            15 Competitive Landscape

            • 15.1 Overview
              • 15.2 Competitive Landscape
                • Overview on criticality of inputs and factors of differentiation
              • 15.3 Landscape disruption
                • Overview on factors of disruption
              • 15.4 Industry risks
                • Impact of key risks on business

              16 Competitive Analysis

              • 16.1 Companies profiled
                • Companies covered
              • 16.2 Market positioning of companies
                • Matrix on companies position and classification
              • 16.3 Amprobe (Fluke Corporation)
                • Amprobe (Fluke Corporation) - Overview
                • Amprobe (Fluke Corporation) - Product / Service
                • Amprobe (Fluke Corporation) - Key offerings
              • 16.4 Appion Inc.
                • Appion Inc. - Overview
                • Appion Inc. - Product / Service
                • Appion Inc. - Key offerings
              • 16.5 Bacharach Inc.
                • Bacharach Inc. - Overview
                • Bacharach Inc. - Product / Service
                • Bacharach Inc. - Key offerings
              • 16.6 CPS Products Inc.
                • CPS Products Inc. - Overview
                • CPS Products Inc. - Product / Service
                • CPS Products Inc. - Key offerings
              • 16.7 Dwyer Instruments Inc.
                • Dwyer Instruments Inc. - Overview
                • Dwyer Instruments Inc. - Product / Service
                • Dwyer Instruments Inc. - Key offerings
              • 16.8 Extech Instruments (FLIR Systems)
                • Extech Instruments (FLIR Systems) - Overview
                • Extech Instruments (FLIR Systems) - Product / Service
                • Extech Instruments (FLIR Systems) - Key offerings
              • 16.9 Fieldpiece Instruments Inc.
                • Fieldpiece Instruments Inc. - Overview
                • Fieldpiece Instruments Inc. - Product / Service
                • Fieldpiece Instruments Inc. - Key offerings
              • 16.10 Fluke Corporation
                • Fluke Corporation - Overview
                • Fluke Corporation - Product / Service
                • Fluke Corporation - Key offerings
              • 16.11 INFICON Holding AG
                • INFICON Holding AG - Overview
                • INFICON Holding AG - Product / Service
                • INFICON Holding AG - Key offerings
              • 16.12 Kane International Ltd.
                • Kane International Ltd. - Overview
                • Kane International Ltd. - Product / Service
                • Kane International Ltd. - Key offerings
              • 16.13 KIMO Instruments
                • KIMO Instruments - Overview
                • KIMO Instruments - Product / Service
                • KIMO Instruments - Key offerings
              • 16.14 Klein Tools Inc.
                • Klein Tools Inc. - Overview
                • Klein Tools Inc. - Product / Service
                • Klein Tools Inc. - Key offerings
              • 16.15 Megger Group Limited
                • Megger Group Limited - Overview
                • Megger Group Limited - Product / Service
                • Megger Group Limited - Key offerings
              • 16.16 Sauermann Group
                • Sauermann Group - Overview
                • Sauermann Group - Product / Service
                • Sauermann Group - Key offerings
              • 16.17 Supco (Sealed Unit Parts Co. Inc.)
                • Supco (Sealed Unit Parts Co. Inc.) - Overview
                • Supco (Sealed Unit Parts Co. Inc.) - Product / Service
                • Supco (Sealed Unit Parts Co. Inc.) - Key offerings
              • 16.18 Testo SE & Co. KGaA
                • Testo SE & Co. KGaA - Overview
                • Testo SE & Co. KGaA - Product / Service
                • Testo SE & Co. KGaA - Key offerings
              • 16.19 Trotec GmbH
                • Trotec GmbH - Overview
                • Trotec GmbH - Product / Service
                • Trotec GmbH - Key offerings
              • 16.20 TSI Incorporated
                • TSI Incorporated - Overview
                • TSI Incorporated - Product / Service
                • TSI Incorporated - Key offerings
              • 16.21 UEi Test Instruments
                • UEi Test Instruments - Overview
                • UEi Test Instruments - Product / Service
                • UEi Test Instruments - Key offerings
              • 16.22 Yellow Jacket (Ritchie Engineering)
                • Yellow Jacket (Ritchie Engineering) - Overview
                • Yellow Jacket (Ritchie Engineering) - Product / Service
                • Yellow Jacket (Ritchie Engineering) - Key offerings
              • 16.23 Daikin Industries Ltd.
                • Daikin Industries Ltd. - Overview
                • Daikin Industries Ltd. - Product / Service
                • Daikin Industries Ltd. - Key offerings
              • 16.24 Dwyer Instruments LLC
                • Dwyer Instruments LLC - Overview
                • Dwyer Instruments LLC - Product / Service
                • Dwyer Instruments LLC - Key offerings
              • 16.25 Emerson Electric Co.
                • Emerson Electric Co. - Overview
                • Emerson Electric Co. - Product / Service
                • Emerson Electric Co. - Key offerings
              • 16.26 Fieldpiece Instruments Inc.
                • Fieldpiece Instruments Inc. - Overview
                • Fieldpiece Instruments Inc. - Product / Service
                • Fieldpiece Instruments Inc. - Key offerings
              • 16.27 Fluke Corp.
                • Fluke Corp. - Overview
                • Fluke Corp. - Product / Service
                • Fluke Corp. - Key offerings
              • 16.28 Kane International Ltd.
                • Kane International Ltd. - Overview
                • Kane International Ltd. - Product / Service
                • Kane International Ltd. - Key offerings
              • 16.29 Kanomax USA Inc.
                • Kanomax USA Inc. - Overview
                • Kanomax USA Inc. - Product / Service
                • Kanomax USA Inc. - Key offerings
              • 16.30 Klein Tools Inc.
                • Klein Tools Inc. - Overview
                • Klein Tools Inc. - Product / Service
                • Klein Tools Inc. - Key offerings
              • 16.31 Legend Corp. Ltd.
                • Legend Corp. Ltd. - Overview
                • Legend Corp. Ltd. - Product / Service
                • Legend Corp. Ltd. - Key offerings
              • 16.32 Mastercool Inc.
                • Mastercool Inc. - Overview
                • Mastercool Inc. - Product / Service
                • Mastercool Inc. - Key offerings
              • 16.33 PCE Holding GmbH
                • PCE Holding GmbH - Overview
                • PCE Holding GmbH - Product / Service
                • PCE Holding GmbH - Key offerings
              • 16.34 Ritchie Engineering Inc.
                • Ritchie Engineering Inc. - Overview
                • Ritchie Engineering Inc. - Product / Service
                • Ritchie Engineering Inc. - Key offerings
              • 16.35 Robert Bosch GmbH
                • Robert Bosch GmbH - Overview
                • Robert Bosch GmbH - Product / Service
                • Robert Bosch GmbH - Key offerings
              • 16.36 Sauermann Group
                • Sauermann Group - Overview
                • Sauermann Group - Product / Service
                • Sauermann Group - Key offerings
              • 16.37 TASI Group
                • TASI Group - Overview
                • TASI Group - Product / Service
                • TASI Group - Key offerings
              • 16.38 TENMARS Electronics Co. Ltd.
                • TENMARS Electronics Co. Ltd. - Overview
                • TENMARS Electronics Co. Ltd. - Product / Service
                • TENMARS Electronics Co. Ltd. - Key offerings
              • 16.39 Testo SE and Co. KGaA
                • Testo SE and Co. KGaA - Overview
                • Testo SE and Co. KGaA - Product / Service
                • Testo SE and Co. KGaA - Key offerings
              • 16.40 VTech Process Equipment LLC
                • VTech Process Equipment LLC - Overview
                • VTech Process Equipment LLC - Product / Service
                • VTech Process Equipment LLC - Key offerings
              • 16.41 WW Grainger Inc.
                • WW Grainger Inc. - Overview
                • WW Grainger Inc. - Product / Service
                • WW Grainger Inc. - Key offerings

              17 Appendix

              • 17.1 Scope of the report
                • 17.2 Inclusions and exclusions checklist
                  • Inclusions checklist
                  • Exclusions checklist
                • 17.3 Currency conversion rates for US$
                  • Currency conversion rates for US$
                • 17.4 Research methodology
                  • Research methodology
                • 17.5 Data procurement
                  • Information sources
                • 17.6 Data validation
                  • Data validation
                • 17.7 Validation techniques employed for market sizing
                  • Validation techniques employed for market sizing
                • 17.8 Data synthesis
                  • Data synthesis
                • 17.9 360 degree market analysis
                  • 360 degree market analysis
                • 17.10 List of abbreviations
                  • List of abbreviations

                Research Methodology

                Technavio presents a detailed picture of the market by way of study, synthesis, and summation of data from multiple sources. The analysts have presented the various facets of the market with a particular focus on identifying the key industry influencers. The data thus presented is comprehensive, reliable, and the result of extensive research, both primary and secondary.

                INFORMATION SOURCES

                Primary sources

                • Manufacturers and suppliers
                • Channel partners
                • Industry experts
                • Strategic decision makers

                Secondary sources

                • Industry journals and periodicals
                • Government data
                • Financial reports of key industry players
                • Historical data
                • Press releases

                DATA ANALYSIS

                Data Synthesis

                • Collation of data
                • Estimation of key figures
                • Analysis of derived insights

                Data Validation

                • Triangulation with data models
                • Reference against proprietary databases
                • Corroboration with industry experts

                REPORT WRITING

                Qualitative

                • Market drivers
                • Market challenges
                • Market trends
                • Five forces analysis

                Quantitative

                • Market size and forecast
                • Market segmentation
                • Geographical insights
                • Competitive landscape

                Interested in this report?

                Get your sample now to see our research methodology and insights!

                Download Now

                Frequently Asked Questions

                Hvac Test Instruments market growth will increase by $ 237.9 mn during 2025-2029 .

                The Hvac Test Instruments market is expected to grow at a CAGR of 7% during 2025-2029 .

                Hvac Test Instruments market is segmented by Application( Airflow and quality, Temperature and humidity, Electrical, Others) Product Type( Dye injector kit, Refrigerant measuring and monitoring, Gauges, MEA, South America)

                Amprobe (Fluke Corporation), Appion Inc., Bacharach Inc., CPS Products Inc., Dwyer Instruments Inc., Extech Instruments (FLIR Systems), Fieldpiece Instruments Inc., Fluke Corporation, INFICON Holding AG, Kane International Ltd., KIMO Instruments, Klein Tools Inc., Megger Group Limited, Sauermann Group, Supco (Sealed Unit Parts Co. Inc.), Testo SE & Co. KGaA, Trotec GmbH, TSI Incorporated, UEi Test Instruments, Yellow Jacket (Ritchie Engineering) are a few of the key vendors in the Hvac Test Instruments market.

                APAC will register the highest growth rate of 55% among the other regions. Therefore, the Hvac Test Instruments market in APAC is expected to garner significant business opportunities for the vendors during the forecast period.

                US, Canada, Germany, UK, Italy, France, China, India, Japan, Brazil, Egypt, UAE, Oman, Argentina, UAE, Brazil, Rest of World (ROW)

                • Growing demand for HVAC systemsGlobally is the driving factor this market.
                • the global demand for HVAC systems is growing continuously is the driving factor this market.
                • owing to the growth in disposable income and living standards of people across many developing economies. The presence of extreme hot weather conditions in emerging economies is also a crucial factor behind the growing demand for HVAC systems. According to the International Energy Agency in its report is the driving factor this market.
                • the Future of Cooling forecasted the global cumulative demand for HVAC systems to be 5.6 billion units by 2050; currently is the driving factor this market.
                • annual demand for HVAC systems across the world is more than 110 million units is the driving factor this market.
                • with China leading the global market with a share. Hence is the driving factor this market.
                • APAC is the largest adopter of HVAC systems across the world. This is creating significant demand for HVAC test instruments in the region. Technavio expects that the growing adoption of HVAC systems is the most crucial driver for the growth of the market.Developed economies in North America are the largest adopters of commercial HVAC systems is the driving factor this market.
                • while China is the largest adopter of residential HVAC systems. Emerging economies such as India is the driving factor this market.
                • Indonesia is the driving factor this market.
                • and Mexico are witnessing significant growth in HVAC demand from both residential and commercial customers. As the demand for HVAC systems increases is the driving factor this market.
                • regulators in respective countries will implement stringent regulations to increase the share of highly efficient HVAC systems is the driving factor this market.
                • as this will allow the country to efficiently meet energy demand. The growing demand for efficient HVAC systems will also be a positive driver for the market is the driving factor this market.
                • as periodic maintenance activities are essential for maintaining the efficiency of HVAC systems. All such developments are expected to boost the growth of the global HVAC test instruments market during the forecast period. is the driving factor this market.

                The Hvac Test Instruments market vendors should focus on grabbing business opportunities from the Airflow and quality segment as it accounted for the largest market share in the base year.