Induced Pluripotent Stem Cells Production (iPSCs) Market Analysis North America, Europe, Asia, Rest of World (ROW) - US, Canada, UK, Germany, China - Size and Forecast 2024-2028

Induced Pluripotent Stem Cells Production (iPSCs) Market Analysis North America, Europe, Asia, Rest of World (ROW) - US, Canada, UK, Germany, China - Size and Forecast 2024-2028

Published: May 2024 169 Pages SKU: IRTNTR71329

Market Overview at a Glance

$1.84 B
Market Opportunity
11.66%
CAGR
10.09
YoY growth 2023-2024(%)

Induced Pluripotent Stem Cells Production Market Size 2024-2028 

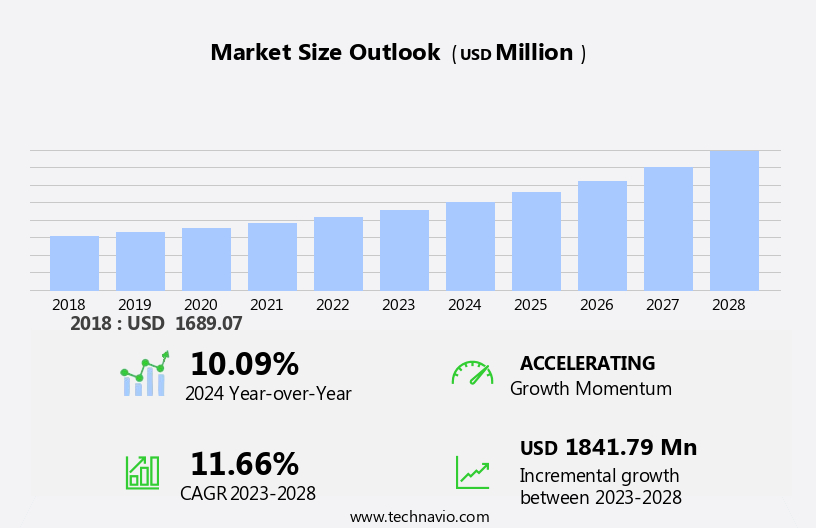
The induced pluripotent stem cells production market size is forecast to increase by USD 1.84 billion at a CAGR of 11.66% between 2023 and 2028.

  • Induced pluripotent stem cells (iPSCs) have emerged as a promising solution in the biotechnology industry for the production of various cell types, including hepatocytes, fibroblasts, and keratinocytes, for therapeutic applications. The market for iPSCs is experiencing significant growth due to the increasing prevalence of chronic disorders and the advancements in cell characterization and engineering techniques.
  • However, the high costs associated with cell reprogramming remain a challenge for the market. Hospitals and clinics are increasingly adopting iPSCs for disease modeling, drug discovery, and cell therapy. The production of iPSCs involves the reprogramming of adult cells, such as fibroblasts, into pluripotent cells, which have the ability to differentiate into any cell type in the body.

What will be the Induced Pluripotent Stem Cells Production Market Size During the Forecast Period?

Induced Pluripotent Stem Cells Production Market Size

 Request Free Sample

  • Induced pluripotent stem cells (iPSCs) are a type of pluripotent stem cells that can be generated from adult cells, such as skin or blood cells, through a reprogramming process. This innovative technology has gained significant attention in the scientific community due to its potential applications in various fields, including regenerative medicine, drug discovery, and toxicology studies. The iPSCs production market has witnessed substantial growth in recent years, driven by the increasing demand for alternative sources of pluripotent stem cells to embryonic stem cells. IPSCs offer several advantages, including ethical considerations, reduced immunogenicity, and the ability to generate cells from a patient's own tissue. Automated platforms and consumables and kits are essential components of iPSCs production.
  • The market for these technologies is expected to grow significantly due to the increasing demand for iPSCs and the need for standardization and automation in stem cell research. Toxicology studies represent a significant application area for iPSCs. These studies involve the use of iPSCs-derived cells, such as hepatocytes, fibroblasts, keratinocytes, neurons, and others, to assess the safety and efficacy of drugs and chemicals. The ability of iPSCs to differentiate into various cell types that closely mimic human cells makes them an ideal model system for toxicity testing. The increasing number of clinical trials and animal models using iPSCs is expected to drive the growth of the iPSCs production market.
  • In conclusion, the iPSCs production market is poised for significant growth due to the increasing demand for alternative sources of pluripotent stem cells and the potential applications of iPSCs in various fields, including regenerative medicine, drug discovery, and toxicology studies. The market for automated platforms and consumables and kits is expected to grow significantly due to the need for standardization and automation in stem cell research. The ability of iPSCs to differentiate into various cell types makes them an ideal model system for toxicity testing and a promising source of cells for cell therapy applications.

How is this market segmented and which is the largest segment?

The market research report provides comprehensive data (region-wise segment analysis), with forecasts and estimates in "USD million" for the period 2024-2028, as well as historical data from 2018-2022 for the following segments.
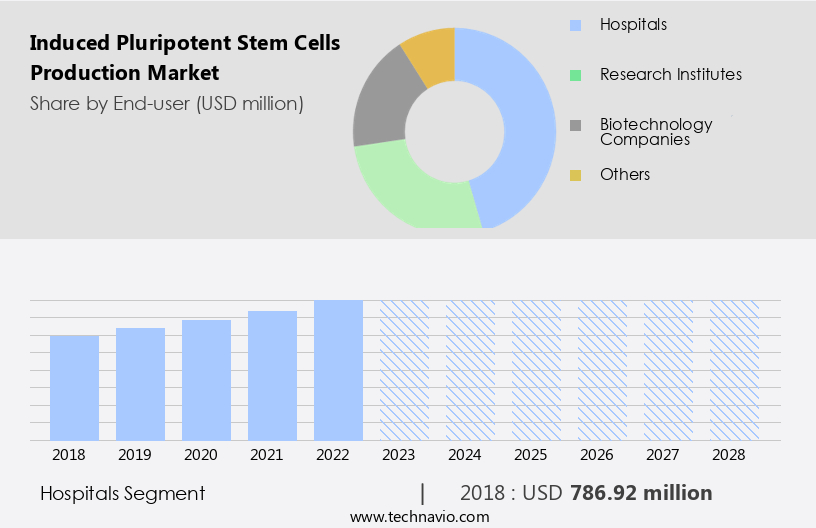
  • End-user
    • Hospitals
    • Research institutes
    • Biotechnology companies
    • Others
  • Product
    • Consumable and kits
    • Instrument
    • Services and others
  • Geography
    • North America
      • Canada
      • US
    • Europe
      • Germany
      • UK
    • Asia
      • China
    • Rest of World (ROW)

By End-user Insights

  • The hospitals segment is estimated to witness significant growth during the forecast period.

In the United States, hospitals serve as a significant customer base for the Induced Pluripotent Stem Cells (iPSCs) production market. IPSCs are utilized extensively in hospitals for various applications in the fields of regenerative medicine, drug development, and tissue engineering. Neurological disorders, cardiovascular diseases, and genetic conditions are among the many disease areas where iPSCs and iPSC-derived therapies are being explored for innovative treatment options. These personalized treatments cater to the unique genetic makeup and disease characteristics of individual patients, thereby revolutionizing healthcare. Hospitals are instrumental in translating iPSC-based therapies into clinical applications through conducting clinical studies and offering advanced treatments to patients.

This clinical translation process is expected to fuel the growth of the hospitals segment within the US iPSCs production market.

Induced Pluripotent Stem Cells Production Market Size

Get a glance at the market report of share of various segments Request Free Sample

The Hospitals segment was valued at USD 786.92 million in 2018 and showed a gradual increase during the forecast period.

Regional Analysis

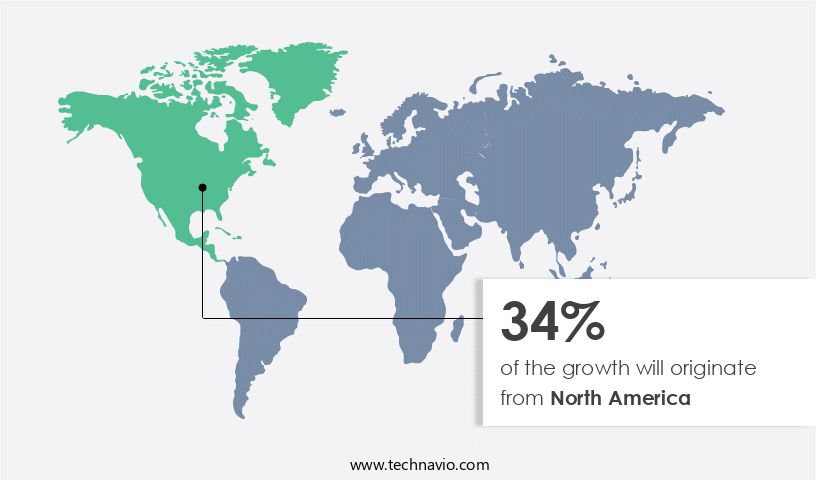
  • North America is estimated to contribute 34% to the growth of the global market during the forecast period.

Technavio's analysts have elaborately explained the regional trends and drivers that shape the market during the forecast period.

Induced Pluripotent Stem Cells Production Market Share by Geography

For more insights on the market share of various regions Request Free Sample

In North America, the market for Induced Pluripotent Stem Cells (iPSCs) production holds a significant share due to the presence of prominent players such as Fate Therapeutics Inc. And Applied StemCell. These companies offer a comprehensive range of analytical testing services to biopharmaceutical companies, aiding them in various stages of drug discovery, development, and manufacturing. According to the Centers for Disease Control and Prevention (CDC), cancer and heart disease are leading causes of death in the US, with over 500,000 and 610,000 fatalities, respectively, each year. Biopharmaceutical companies are continually seeking innovative treatments for diseases with limited options. These potential therapies must undergo rigorous testing to meet regulatory requirements, ensuring safety, efficacy, and quality.

IPSCs, derived from adult cells, offer a promising avenue for stem cell-based therapies and regenerative medicine, including cell therapy. Automated platforms, consumables, and kits are essential tools for the production and manipulation of iPSCs. The demand for these technologies is increasing due to their potential to revolutionize oncology and other fields in healthcare. Biopharmaceutical companies rely on these solutions to advance their research and development efforts, ultimately bringing new treatments to the market. The iPSCs production market is poised for growth as the demand for advanced testing solutions continues to rise.

Market Dynamics

Our researchers analyzed the data with 2023 as the base year, along with the key drivers, trends, and challenges. A holistic analysis of drivers will help companies refine their marketing strategies to gain a competitive advantage.

What are the key market drivers leading to the rise in adoption of Induced Pluripotent Stem Cells Production Market?

Rising prevalence of several chronic disorders is the key driver of the market.

  • In the realm of healthcare and life sciences, chronic diseases such as cardiovascular disorders, neurodegenerative conditions, and diabetes continue to pose significant challenges. These conditions, which include cardiovascular diseases (CVDs), cancer, chronic obstructive pulmonary disease, and type 2 diabetes, are predominantly caused by factors such as high blood pressure, high cholesterol levels, overweight, physical inactivity, unhealthy diet, and tobacco use. The global prevalence of these diseases has risen due to changing lifestyle patterns. Induced Pluripotent Stem Cells (iPSCs) have emerged as a promising solution for disease modeling, drug discovery, and cell-based therapies. Researchers can generate patient-specific cell models using iPSCs, enabling the development of personalized treatments tailored to individual disease profiles.

    Toxicology studies play a crucial role in ensuring the safety and efficacy of these innovative therapies. Clinical trials using animal models are underway to assess the potential of iPSCs in disease intervention. Fate Therapeutics, a leading company in the field, is at the forefront of this research. This advancement in healthcare holds immense potential for improving patient outcomes and addressing the global burden of chronic diseases.

What are the market trends shaping the Induced Pluripotent Stem Cells Production Market?

Advancements in cell reprogramming techniques is the upcoming trend in the market.

  • The global market for Induced Pluripotent Stem Cells (iPSCs) production is experiencing significant growth due to advancements in cell characterization and engineering techniques. These innovations enable the transformation of adult cells, such as fibroblasts and keratinocytes, into iPSCs, which can differentiate into various cell types, including hepatocytes. This development has accelerated the use of iPSCs in research and therapeutic applications, including drug discovery and regenerative medicine. Key players in the biotechnology industry, like Cellular Dynamics International (CDI), a subsidiary of FUJIFILM Corporation, have contributed significantly to the field by producing human iPSC-derived cells and tissues for numerous applications. The availability of reliable and efficient methods for iPSCs production is expected to further fuel market growth.

What challenges does Induced Pluripotent Stem Cells Production Market face during the growth?

High costs associated with reprogramming of cells is a key challenge affecting the market growth.

  • Producing Induced Pluripotent Stem Cells (iPSCs) from adult cells is a complex process that involves several intricate steps, such as introducing reprogramming factors, maintaining cell culture, and implementing quality control assessments. These procedures necessitate the use of specialized equipment, reagents, and expertise, leading to substantial expenses. Furthermore, stringent quality control measures are essential to ensure the genetic stability and safety of iPSC-derived cells, which adds to the overall cost. Consequently, researchers, academic institutions, and biotechnology companies face significant financial hurdles in establishing and operating iPSC production facilities and executing large-scale reprogramming projects. The estimated cost of producing iPSCs in a dedicated academic facility using the current transfection method is around USD 15,000.

    This financial barrier can be mitigated by employing advanced reprogramming methods, such as the Mantarray platform, which utilizes non-viral reprogramming techniques, reducing the risk of chromosomal and genetic instability associated with retroviruses. By adopting innovative approaches, the cost of iPSC production can be optimized while maintaining the highest standards of safety and quality.

Exclusive Customer Landscape

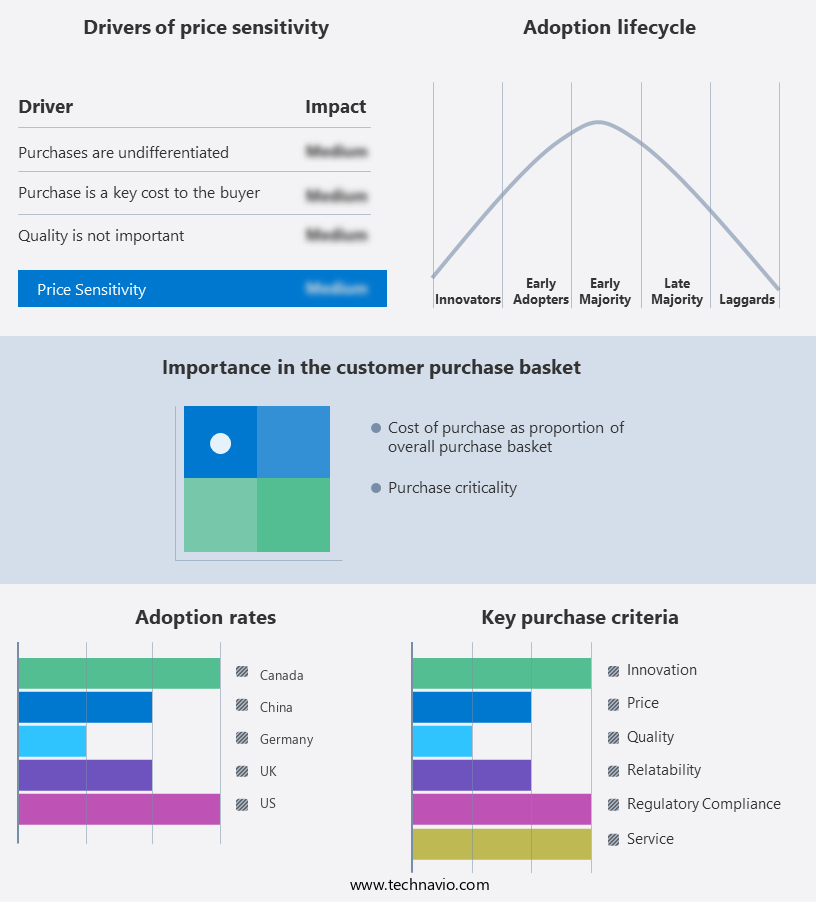
The market forecasting report includes the adoption lifecycle of the market, covering from the innovator's stage to the laggard's stage. It focuses on adoption rates in different regions based on penetration. Furthermore, the market report also includes key purchase criteria and drivers of price sensitivity to help companies evaluate and develop their market growth analysis strategies.

Induced Pluripotent Stem Cells Production Market Share by Geography

 Customer Landscape

Key Companies & Market Insights

Companies are implementing various strategies, such as strategic alliances, market forecast, partnerships, mergers and acquisitions, geographical expansion, and product/service launches, to enhance their presence in the market.

The market research and growth report includes detailed analyses of the competitive landscape of the market and information about key companies, including:

  • Allele Biotechnology and Pharmaceuticals Inc.
  • ALSTEM
  • Applied Biological Materials Inc.
  • Applied StemCell
  • ATCC
  • Axol Biosciences Ltd.
  • Becton Dickinson and Co.
  • Bio Techne Corp.
  • Board of Regents of the University of Wisconsin System
  • Creative Biolabs
  • Cyagen Biosciences
  • Cynata Therapeutics Ltd.
  • Evotec SE
  • Fate Therapeutics Inc.
  • FUJIFILM Corp.
  • Hitachi Ltd.
  • LIFE and BRAIN GmbH
  • Lonza Group Ltd.
  • Ncardia Services B.V.
  • REPROCELL Inc.
  • Sartorius AG
  • STEMCELL Technologies Inc.
  • Takara Bio Inc.
  • Thermo Fisher Scientific Inc.

Qualitative and quantitative analysis of companies has been conducted to help clients understand the wider business environment as well as the strengths and weaknesses of key market players. Data is qualitatively analyzed to categorize companies as pure play, category-focused, industry-focused, and diversified; it is quantitatively analyzed to categorize companies as dominant, leading, strong, tentative, and weak.

Research Analyst Overview

Induced pluripotent stem cells (iPSCs) have revolutionized the field of regenerative medicine and cell therapy. These cells, derived from somatic cells, can be reprogrammed to a pluripotent state, enabling them to differentiate into various cell types, including hepatocytes, fibroblasts, keratinocytes, neurons, and more. IPSCs hold immense potential for disease intervention, particularly in areas such as oncology and cancer research, where they can be used for toxicology studies, drug development, and clinical trials. The production of iPSCs involves several stages, including cell culture, cell characterization, and engineering. Various reprogramming methods, such as the use of retroviruses, have been employed, although concerns regarding chromosomal and genetic instability persist.

Automated platforms and consumables and kits have streamlined the production process, making it more efficient and cost-effective. IPSCs have applications in various healthcare and life sciences sectors, including hospitals and clinics. They have shown promise in the treatment of psychiatric diseases, wound healing, and type 2 diabetes. Research collaborations and license agreements have been crucial in advancing the field, with government funding playing a significant role. Ethical concerns surrounding the use of iPSCs continue to be a topic of debate. In the mesoderm subgroup, iPSCs have shown potential in the regeneration of ischemic tissues, including blood vessels. The Mantarray platform, a novel technology for the production of iPSCs, has gained attention for its ability to generate high-quality cells.

The future of iPSCs lies in their ability to provide personalized medicines and contribute to the development of car-T cell treatment for various diseases.

Market Scope

Report Coverage

Details

Page number

169

Base year

2023

Historic period

2018-2022

Forecast period

2024-2028

Growth momentum & CAGR

Accelerate at a CAGR of 11.66%

Market growth 2024-2028

USD 1.84 billion

Market structure

Fragmented

YoY growth 2023-2024(%)

10.09

Key countries

US, Canada, UK, Germany, and China

Competitive landscape

Leading Companies, Market Positioning of Companies, Competitive Strategies, and Industry Risks

Request Free Sample

What are the Key Data Covered in this Market Research and Growth Report?

  • CAGR of the market during the forecast period
  • Detailed information on factors that will drive the market growth and forecasting between 2024 and 2028
  • Precise estimation of the size of the market  and its contribution of the market in focus to the parent market
  • Accurate predictions about upcoming market growth and trends and changes in consumer behaviour
  • Growth of the market across North America, Europe, Asia, and Rest of World (ROW)
  • Thorough analysis of the market's competitive landscape and detailed information about companies
  • Comprehensive analysis of factors that will challenge the growth of market companies

We can help! Our analysts can customize this market research report to meet your requirements. Get in touch

1 Executive Summary

  • 1.1 Market overview
    • Exhibit 01: Executive Summary – Chart on Market Overview
    • Exhibit 02: Executive Summary – Data Table on Market Overview
    • Exhibit 03: Executive Summary – Chart on Global Market Characteristics
    • Exhibit 04: Executive Summary – Chart on Market by Geography
    • Exhibit 05: Executive Summary – Chart on Market Segmentation by End-user
    • Exhibit 06: Executive Summary – Chart on Market Segmentation by Product
    • Exhibit 07: Executive Summary – Chart on Incremental Growth
    • Exhibit 08: Executive Summary – Data Table on Incremental Growth
    • Exhibit 09: Executive Summary – Chart on Vendor Market Positioning

2 Market Landscape

  • 2.1 Market ecosystem
    • Exhibit 10: Parent market
    • Exhibit 11: Market Characteristics

3 Market Sizing

  • 3.1 Market definition
    • Exhibit 12: Offerings of vendors included in the market definition
  • 3.2 Market segment analysis
    • Exhibit 13: Market segments
  • 3.3 Market size 2023
    • 3.4 Market outlook: Forecast for 2023-2028
      • Exhibit 14: Chart on Global - Market size and forecast 2023-2028 ($ million)
      • Exhibit 15: Data Table on Global - Market size and forecast 2023-2028 ($ million)
      • Exhibit 16: Chart on Global Market: Year-over-year growth 2023-2028 (%)
      • Exhibit 17: Data Table on Global Market: Year-over-year growth 2023-2028 (%)

    4 Historic Market Size

    • 4.1 Global induced pluripotent stem cells production market 2018 - 2022
      • Exhibit 18: Historic Market Size – Data Table on global induced pluripotent stem cells production market 2018 - 2022 ($ million)
    • 4.2 End-user Segment Analysis 2018 - 2022
      • Exhibit 19: Historic Market Size – End-user Segment 2018 - 2022 ($ million)
    • 4.3 Product Segment Analysis 2018 - 2022
      • Exhibit 20: Historic Market Size – Product Segment 2018 - 2022 ($ million)
    • 4.4 Geography Segment Analysis 2018 - 2022
      • Exhibit 21: Historic Market Size – Geography Segment 2018 - 2022 ($ million)
    • 4.5 Country Segment Analysis 2018 - 2022
      • Exhibit 22: Historic Market Size – Country Segment 2018 - 2022 ($ million)

    5 Five Forces Analysis

    • 5.1 Five forces summary
      • Exhibit 23: Five forces analysis - Comparison between 2023 and 2028
    • 5.2 Bargaining power of buyers
      • Exhibit 24: Chart on Bargaining power of buyers – Impact of key factors 2023 and 2028
    • 5.3 Bargaining power of suppliers
      • Exhibit 25: Bargaining power of suppliers – Impact of key factors in 2023 and 2028
    • 5.4 Threat of new entrants
      • Exhibit 26: Threat of new entrants – Impact of key factors in 2023 and 2028
    • 5.5 Threat of substitutes
      • Exhibit 27: Threat of substitutes – Impact of key factors in 2023 and 2028
    • 5.6 Threat of rivalry
      • Exhibit 28: Threat of rivalry – Impact of key factors in 2023 and 2028
    • 5.7 Market condition
      • Exhibit 29: Chart on Market condition - Five forces 2023 and 2028

    6 Market Segmentation by End-user

    • 6.1 Market segments
      • Exhibit 30: Chart on End-user - Market share 2023-2028 (%)
      • Exhibit 31: Data Table on End-user - Market share 2023-2028 (%)
    • 6.2 Comparison by End-user
      • Exhibit 32: Chart on Comparison by End-user
      • Exhibit 33: Data Table on Comparison by End-user
    • 6.3 Hospitals - Market size and forecast 2023-2028
      • Exhibit 34: Chart on Hospitals - Market size and forecast 2023-2028 ($ million)
      • Exhibit 35: Data Table on Hospitals - Market size and forecast 2023-2028 ($ million)
      • Exhibit 36: Chart on Hospitals - Year-over-year growth 2023-2028 (%)
      • Exhibit 37: Data Table on Hospitals - Year-over-year growth 2023-2028 (%)
    • 6.4 Research institutes - Market size and forecast 2023-2028
      • Exhibit 38: Chart on Research institutes - Market size and forecast 2023-2028 ($ million)
      • Exhibit 39: Data Table on Research institutes - Market size and forecast 2023-2028 ($ million)
      • Exhibit 40: Chart on Research institutes - Year-over-year growth 2023-2028 (%)
      • Exhibit 41: Data Table on Research institutes - Year-over-year growth 2023-2028 (%)
    • 6.5 Biotechnology companies - Market size and forecast 2023-2028
      • Exhibit 42: Chart on Biotechnology companies - Market size and forecast 2023-2028 ($ million)
      • Exhibit 43: Data Table on Biotechnology companies - Market size and forecast 2023-2028 ($ million)
      • Exhibit 44: Chart on Biotechnology companies - Year-over-year growth 2023-2028 (%)
      • Exhibit 45: Data Table on Biotechnology companies - Year-over-year growth 2023-2028 (%)
    • 6.6 Others - Market size and forecast 2023-2028
      • Exhibit 46: Chart on Others - Market size and forecast 2023-2028 ($ million)
      • Exhibit 47: Data Table on Others - Market size and forecast 2023-2028 ($ million)
      • Exhibit 48: Chart on Others - Year-over-year growth 2023-2028 (%)
      • Exhibit 49: Data Table on Others - Year-over-year growth 2023-2028 (%)
    • 6.7 Market opportunity by End-user
      • Exhibit 50: Market opportunity by End-user ($ million)
      • Exhibit 51: Data Table on Market opportunity by End-user ($ million)

    7 Market Segmentation by Product

    • 7.1 Market segments
      • Exhibit 52: Chart on Product - Market share 2023-2028 (%)
      • Exhibit 53: Data Table on Product - Market share 2023-2028 (%)
    • 7.2 Comparison by Product
      • Exhibit 54: Chart on Comparison by Product
      • Exhibit 55: Data Table on Comparison by Product
    • 7.3 Consumable and kits - Market size and forecast 2023-2028
      • Exhibit 56: Chart on Consumable and kits - Market size and forecast 2023-2028 ($ million)
      • Exhibit 57: Data Table on Consumable and kits - Market size and forecast 2023-2028 ($ million)
      • Exhibit 58: Chart on Consumable and kits - Year-over-year growth 2023-2028 (%)
      • Exhibit 59: Data Table on Consumable and kits - Year-over-year growth 2023-2028 (%)
    • 7.4 Instrument - Market size and forecast 2023-2028
      • Exhibit 60: Chart on Instrument - Market size and forecast 2023-2028 ($ million)
      • Exhibit 61: Data Table on Instrument - Market size and forecast 2023-2028 ($ million)
      • Exhibit 62: Chart on Instrument - Year-over-year growth 2023-2028 (%)
      • Exhibit 63: Data Table on Instrument - Year-over-year growth 2023-2028 (%)
    • 7.5 Services and others - Market size and forecast 2023-2028
      • Exhibit 64: Chart on Services and others - Market size and forecast 2023-2028 ($ million)
      • Exhibit 65: Data Table on Services and others - Market size and forecast 2023-2028 ($ million)
      • Exhibit 66: Chart on Services and others - Year-over-year growth 2023-2028 (%)
      • Exhibit 67: Data Table on Services and others - Year-over-year growth 2023-2028 (%)
    • 7.6 Market opportunity by Product
      • Exhibit 68: Market opportunity by Product ($ million)
      • Exhibit 69: Data Table on Market opportunity by Product ($ million)

    8 Customer Landscape

    • 8.1 Customer landscape overview
      • Exhibit 70: Analysis of price sensitivity, lifecycle, customer purchase basket, adoption rates, and purchase criteria

    9 Geographic Landscape

    • 9.1 Geographic segmentation
      • Exhibit 71: Chart on Market share by geography 2023-2028 (%)
      • Exhibit 72: Data Table on Market share by geography 2023-2028 (%)
    • 9.2 Geographic comparison
      • Exhibit 73: Chart on Geographic comparison
      • Exhibit 74: Data Table on Geographic comparison
    • 9.3 North America - Market size and forecast 2023-2028
      • Exhibit 75: Chart on North America - Market size and forecast 2023-2028 ($ million)
      • Exhibit 76: Data Table on North America - Market size and forecast 2023-2028 ($ million)
      • Exhibit 77: Chart on North America - Year-over-year growth 2023-2028 (%)
      • Exhibit 78: Data Table on North America - Year-over-year growth 2023-2028 (%)
    • 9.4 Europe - Market size and forecast 2023-2028
      • Exhibit 79: Chart on Europe - Market size and forecast 2023-2028 ($ million)
      • Exhibit 80: Data Table on Europe - Market size and forecast 2023-2028 ($ million)
      • Exhibit 81: Chart on Europe - Year-over-year growth 2023-2028 (%)
      • Exhibit 82: Data Table on Europe - Year-over-year growth 2023-2028 (%)
    • 9.5 Asia - Market size and forecast 2023-2028
      • Exhibit 83: Chart on Asia - Market size and forecast 2023-2028 ($ million)
      • Exhibit 84: Data Table on Asia - Market size and forecast 2023-2028 ($ million)
      • Exhibit 85: Chart on Asia - Year-over-year growth 2023-2028 (%)
      • Exhibit 86: Data Table on Asia - Year-over-year growth 2023-2028 (%)
    • 9.6 Rest of World (ROW) - Market size and forecast 2023-2028
      • Exhibit 87: Chart on Rest of World (ROW) - Market size and forecast 2023-2028 ($ million)
      • Exhibit 88: Data Table on Rest of World (ROW) - Market size and forecast 2023-2028 ($ million)
      • Exhibit 89: Chart on Rest of World (ROW) - Year-over-year growth 2023-2028 (%)
      • Exhibit 90: Data Table on Rest of World (ROW) - Year-over-year growth 2023-2028 (%)
    • 9.7 US - Market size and forecast 2023-2028
      • Exhibit 91: Chart on US - Market size and forecast 2023-2028 ($ million)
      • Exhibit 92: Data Table on US - Market size and forecast 2023-2028 ($ million)
      • Exhibit 93: Chart on US - Year-over-year growth 2023-2028 (%)
      • Exhibit 94: Data Table on US - Year-over-year growth 2023-2028 (%)
    • 9.8 China - Market size and forecast 2023-2028
      • Exhibit 95: Chart on China - Market size and forecast 2023-2028 ($ million)
      • Exhibit 96: Data Table on China - Market size and forecast 2023-2028 ($ million)
      • Exhibit 97: Chart on China - Year-over-year growth 2023-2028 (%)
      • Exhibit 98: Data Table on China - Year-over-year growth 2023-2028 (%)
    • 9.9 UK - Market size and forecast 2023-2028
      • Exhibit 99: Chart on UK - Market size and forecast 2023-2028 ($ million)
      • Exhibit 100: Data Table on UK - Market size and forecast 2023-2028 ($ million)
      • Exhibit 101: Chart on UK - Year-over-year growth 2023-2028 (%)
      • Exhibit 102: Data Table on UK - Year-over-year growth 2023-2028 (%)
    • 9.10 Germany - Market size and forecast 2023-2028
      • Exhibit 103: Chart on Germany - Market size and forecast 2023-2028 ($ million)
      • Exhibit 104: Data Table on Germany - Market size and forecast 2023-2028 ($ million)
      • Exhibit 105: Chart on Germany - Year-over-year growth 2023-2028 (%)
      • Exhibit 106: Data Table on Germany - Year-over-year growth 2023-2028 (%)
    • 9.11 Canada - Market size and forecast 2023-2028
      • Exhibit 107: Chart on Canada - Market size and forecast 2023-2028 ($ million)
      • Exhibit 108: Data Table on Canada - Market size and forecast 2023-2028 ($ million)
      • Exhibit 109: Chart on Canada - Year-over-year growth 2023-2028 (%)
      • Exhibit 110: Data Table on Canada - Year-over-year growth 2023-2028 (%)
    • 9.12 Market opportunity by geography
      • Exhibit 111: Market opportunity by geography ($ million)
      • Exhibit 112: Data Tables on Market opportunity by geography ($ million)

    10 Drivers, Challenges, and Trends

    • 10.1 Market drivers
      • 10.2 Market challenges
        • 10.3 Impact of drivers and challenges
          • Exhibit 113: Impact of drivers and challenges in 2023 and 2028
        • 10.4 Market trends

          11 Vendor Landscape

          • 11.1 Overview
            • 11.2 Vendor landscape
              • Exhibit 114: Overview on Criticality of inputs and Factors of differentiation
            • 11.3 Landscape disruption
              • Exhibit 115: Overview on factors of disruption
            • 11.4 Industry risks
              • Exhibit 116: Impact of key risks on business

            12 Vendor Analysis

            • 12.1 Vendors covered
              • Exhibit 117: Vendors covered
            • 12.2 Market positioning of vendors
              • Exhibit 118: Matrix on vendor position and classification
            • 12.3 Allele Biotechnology and Pharmaceuticals Inc.
              • Exhibit 119: Allele Biotechnology and Pharmaceuticals Inc. - Overview
              • Exhibit 120: Allele Biotechnology and Pharmaceuticals Inc. - Product / Service
              • Exhibit 121: Allele Biotechnology and Pharmaceuticals Inc. - Key offerings
            • 12.4 Applied Biological Materials Inc.
              • Exhibit 122: Applied Biological Materials Inc. - Overview
              • Exhibit 123: Applied Biological Materials Inc. - Product / Service
              • Exhibit 124: Applied Biological Materials Inc. - Key offerings
            • 12.5 Applied StemCell
              • Exhibit 125: Applied StemCell - Overview
              • Exhibit 126: Applied StemCell - Product / Service
              • Exhibit 127: Applied StemCell - Key offerings
            • 12.6 ATCC
              • Exhibit 128: ATCC - Overview
              • Exhibit 129: ATCC - Product / Service
              • Exhibit 130: ATCC - Key offerings
            • 12.7 Axol Biosciences Ltd.
              • Exhibit 131: Axol Biosciences Ltd. - Overview
              • Exhibit 132: Axol Biosciences Ltd. - Product / Service
              • Exhibit 133: Axol Biosciences Ltd. - Key offerings
            • 12.8 Cynata Therapeutics Ltd.
              • Exhibit 134: Cynata Therapeutics Ltd. - Overview
              • Exhibit 135: Cynata Therapeutics Ltd. - Product / Service
              • Exhibit 136: Cynata Therapeutics Ltd. - Key offerings
            • 12.9 Evotec SE
              • Exhibit 137: Evotec SE - Overview
              • Exhibit 138: Evotec SE - Business segments
              • Exhibit 139: Evotec SE - Key offerings
              • Exhibit 140: Evotec SE - Segment focus
            • 12.10 Fate Therapeutics Inc.
              • Exhibit 141: Fate Therapeutics Inc. - Overview
              • Exhibit 142: Fate Therapeutics Inc. - Product / Service
              • Exhibit 143: Fate Therapeutics Inc. - Key offerings
            • 12.11 FUJIFILM Corp.
              • Exhibit 144: FUJIFILM Corp. - Overview
              • Exhibit 145: FUJIFILM Corp. - Business segments
              • Exhibit 146: FUJIFILM Corp. - Key news
              • Exhibit 147: FUJIFILM Corp. - Key offerings
              • Exhibit 148: FUJIFILM Corp. - Segment focus
            • 12.12 Hitachi Ltd.
              • Exhibit 149: Hitachi Ltd. - Overview
              • Exhibit 150: Hitachi Ltd. - Business segments
              • Exhibit 151: Hitachi Ltd. - Key news
              • Exhibit 152: Hitachi Ltd. - Key offerings
              • Exhibit 153: Hitachi Ltd. - Segment focus
            • 12.13 LIFE and BRAIN GmbH
              • Exhibit 154: LIFE and BRAIN GmbH - Overview
              • Exhibit 155: LIFE and BRAIN GmbH - Product / Service
              • Exhibit 156: LIFE and BRAIN GmbH - Key offerings
            • 12.14 Lonza Group Ltd.
              • Exhibit 157: Lonza Group Ltd. - Overview
              • Exhibit 158: Lonza Group Ltd. - Business segments
              • Exhibit 159: Lonza Group Ltd. - Key news
              • Exhibit 160: Lonza Group Ltd. - Key offerings
              • Exhibit 161: Lonza Group Ltd. - Segment focus
            • 12.15 Ncardia Services B.V.
              • Exhibit 162: Ncardia Services B.V. - Overview
              • Exhibit 163: Ncardia Services B.V. - Product / Service
              • Exhibit 164: Ncardia Services B.V. - Key offerings
            • 12.16 REPROCELL Inc.
              • Exhibit 165: REPROCELL Inc. - Overview
              • Exhibit 166: REPROCELL Inc. - Product / Service
              • Exhibit 167: REPROCELL Inc. - Key offerings
            • 12.17 Takara Bio Inc.
              • Exhibit 168: Takara Bio Inc. - Overview
              • Exhibit 169: Takara Bio Inc. - Product / Service
              • Exhibit 170: Takara Bio Inc. - Key offerings

            13 Appendix

            • 13.1 Scope of the report
              • 13.2 Inclusions and exclusions checklist
                • Exhibit 171: Inclusions checklist
                • Exhibit 172: Exclusions checklist
              • 13.3 Currency conversion rates for US$
                • Exhibit 173: Currency conversion rates for US$
              • 13.4 Research methodology
                • Exhibit 174: Research methodology
                • Exhibit 175: Validation techniques employed for market sizing
                • Exhibit 176: Information sources
              • 13.5 List of abbreviations
                • Exhibit 177: List of abbreviations

              Research Methodology

              Technavio presents a detailed picture of the market by way of study, synthesis, and summation of data from multiple sources. The analysts have presented the various facets of the market with a particular focus on identifying the key industry influencers. The data thus presented is comprehensive, reliable, and the result of extensive research, both primary and secondary.

              INFORMATION SOURCES

              Primary sources

              • Manufacturers and suppliers
              • Channel partners
              • Industry experts
              • Strategic decision makers

              Secondary sources

              • Industry journals and periodicals
              • Government data
              • Financial reports of key industry players
              • Historical data
              • Press releases

              DATA ANALYSIS

              Data Synthesis

              • Collation of data
              • Estimation of key figures
              • Analysis of derived insights

              Data Validation

              • Triangulation with data models
              • Reference against proprietary databases
              • Corroboration with industry experts

              REPORT WRITING

              Qualitative

              • Market drivers
              • Market challenges
              • Market trends
              • Five forces analysis

              Quantitative

              • Market size and forecast
              • Market segmentation
              • Geographical insights
              • Competitive landscape

              Interested in this report?

              Get your sample now to see our research methodology and insights!

              Download Now

              Frequently Asked Questions

              Induced Pluripotent Stem Cells Production market growth will increase by $ 1841.79 mn during 2024-2028 .

              The Induced Pluripotent Stem Cells Production market is expected to grow at a CAGR of 11.66% during 2024-2028 .

              Induced Pluripotent Stem Cells Production market is segmented by End-user( Hospitals, Research institutes, Biotechnology companies, Others) Product( Consumable and kits, Instrument, Services and others, ROW)

              Allele Biotechnology and Pharmaceuticals Inc., ALSTEM, Applied Biological Materials Inc., Applied StemCell, ATCC, Axol Biosciences Ltd., Becton Dickinson and Co., Bio Techne Corp., Board of Regents of the University of Wisconsin System, Creative Biolabs, Cyagen Biosciences, Cynata Therapeutics Ltd., Evotec SE, Fate Therapeutics Inc., FUJIFILM Corp., Hitachi Ltd., LIFE and BRAIN GmbH, Lonza Group Ltd., Ncardia Services B.V., REPROCELL Inc., Sartorius AG, STEMCELL Technologies Inc., Takara Bio Inc., Thermo Fisher Scientific Inc. are a few of the key vendors in the Induced Pluripotent Stem Cells Production market.

              North America will register the highest growth rate of 34% among the other regions. Therefore, the Induced Pluripotent Stem Cells Production market in North America is expected to garner significant business opportunities for the vendors during the forecast period.

              US, Canada, UK, Germany, China

              • Rising prevalence of several chronic disordersChronic diseases such as cardiovascular disorders is the driving factor this market.
              • neurodegenerative conditions is the driving factor this market.
              • and diabetes pose significant healthcare challenges worldwide is the driving factor this market.
              • driving the demand for innovative therapeutic approaches. iPSCs offer a promising avenue for disease modeling is the driving factor this market.
              • drug discovery is the driving factor this market.
              • and cell-based therapies is the driving factor this market.
              • as they enable researchers to generate patient-specific cell models and develop personalized treatments tailored to individual disease profiles. The four major chronic diseases prevalent worldwide are cardiovascular diseases (CVDs) is the driving factor this market.
              • cancer is the driving factor this market.
              • chronic obstructive pulmonary disease is the driving factor this market.
              • and type 2 diabetes is the driving factor this market.
              • which mostly occur due to high blood pressure is the driving factor this market.
              • high cholesterol levels is the driving factor this market.
              • overweight is the driving factor this market.
              • physical inactivity is the driving factor this market.
              • unhealthy diet is the driving factor this market.
              • and the use of tobacco. Globally is the driving factor this market.
              • changing lifestyle patterns have increased the prevalence of such diseases among all socioeconomic classes. Chronic diseases in 2022 accounted for 72.94% of all deaths worldwide and 59.96% of the global burden of disease. However is the driving factor this market.
              • 78.92% of the deaths from these diseases occur in developing countries. Chronic diseases such as asthma is the driving factor this market.
              • heart disease is the driving factor this market.
              • cancer is the driving factor this market.
              • and diabetes are usually incurable illnesses or conditions. These diseases can be prevented through exercise is the driving factor this market.
              • improved diet is the driving factor this market.
              • and early detection. These diseases result in the increased demand for iPSCs against chronic diseases. Therefore is the driving factor this market.
              • the rising prevalence of several chronic disorders will drive the growth of the global iPSCs production market during the forecast period. is the driving factor this market.

              The Induced Pluripotent Stem Cells Production market vendors should focus on grabbing business opportunities from the Hospitals segment as it accounted for the largest market share in the base year.