Industrial Girth Gear Market Size 2025-2029
The industrial girth gear market size is forecast to increase by USD 62.9 million at a CAGR of 2.1% between 2024 and 2029.
- The market is experiencing significant growth, driven by advancements in manufacturing technologies that enhance efficiency and productivity. These innovations enable girth gears to handle larger volumes and higher torque, making them increasingly valuable in various industries, particularly in power generation and wastewater treatment. Moreover, the growing investments in solid waste management initiatives are fueling the demand for girth gears in waste management applications. These gears are essential in the operation of wastewater treatment plants and landfills, ensuring the smooth functioning of these critical infrastructure projects. However, regulatory hurdles impact adoption, as stringent safety and environmental regulations necessitate rigorous testing and certification processes.
- Additionally, supply chain inconsistencies temper growth potential due to the reliance on specialized materials and complex manufacturing processes. Companies seeking to capitalize on market opportunities must navigate these challenges effectively by building robust supply chains and adhering to regulatory requirements. The refurbishment of existing girth gears is also a growing trend, providing cost-effective alternatives to new purchases and reducing the overall market demand for new girth gears.
What will be the Size of the Industrial Girth Gear Market during the forecast period?

- The market is experiencing significant advancements, driven by the integration of technology and innovation. Three-dimensional printing is revolutionizing gear manufacturing, enabling customized designs and faster production. Training programs are adapting to include machine learning and gear design software, enhancing the skills of industry professionals. Research and development in industrial automation is leading to extended warranties, modular design, and predictive analytics, allowing for more efficient maintenance schedules. Vibration analysis and condition monitoring are crucial aspects of gear maintenance, now enhanced by advanced technologies such as finite element analysis and artificial intelligence. Big data and cloud computing facilitate failure prediction and remote diagnostics, improving overall equipment effectiveness.
- Composite materials, including carbon fiber and steel alloys, are gaining popularity for their strength and durability. Additive manufacturing, or 3D printing, is transforming the production of girth gears, allowing for customized designs and faster turnaround times. Machine learning algorithms are integrated into gear design software, optimizing designs for efficiency and durability. Industrial automation and remote diagnostics enable preventative maintenance, reducing downtime and increasing productivity. Predictive analytics and condition monitoring, fueled by big data and artificial intelligence, are revolutionizing gear maintenance. Finite element analysis and vibration analysis are essential tools for assessing gear performance and identifying potential issues before they become critical.
- Extended warranties and service contracts ensure that maintenance is performed regularly and effectively, reducing the risk of unexpected downtime. Modern girth gear designs incorporate advanced materials, such as carbon fiber and steel alloys, for improved strength and durability. Machine learning and artificial intelligence are used to optimize gear designs, reducing weight and increasing efficiency. Industrial automation and remote diagnostics enable preventative maintenance, reducing downtime and increasing productivity. Trade shows and industry events are essential platforms for showcasing the latest technologies and innovations in the girth gear market. Lubricating oils and maintenance schedules are critical components of gear maintenance, with new formulations and scheduling methods continually being developed to improve performance and reduce downtime.
- The integration of technology, from machine learning to additive manufacturing, is driving the market forward, offering significant benefits to businesses in terms of efficiency, productivity, and cost savings.
How is this Industrial Girth Gear Industry segmented?
The industrial girth gear industry research report provides comprehensive data (region-wise segment analysis), with forecasts and estimates in "USD million" for the period 2025-2029, as well as historical data from 2019-2023 for the following segments.
- Type
- Flange mounted girth gear
- Tangential spring mounted girth gear
- Application
- Cement
- Mining
- Chemical and petrochemicals
- Metal fabrication
- Others
- Material
- Alloy steel
- Ductile iron
- Cast steel
- Others
- Geography
- North America
- US
- Canada
- Europe
- France
- Germany
- Russia
- UK
- APAC
- China
- India
- Japan
- South Korea
- Rest of World (ROW)
- North America
By Type Insights
The flange mounted girth gear segment is estimated to witness significant growth during the forecast period. Flange-mounted industrial girth gears play a crucial role in powering equipment such as autogenous grinding mills and ball mills, which are integral to the cement industry and mining sector for cold-processing operations. The manufacturing industry has established stringent standards for these gears to ensure stability and rigidity in mills for efficient operations. The escalating energy demand in industries like cement, mining, and chemicals, coupled with the escalating industrialization and substantial investments in renewable energy projects, will fuel the expansion of the flange-mounted girth gear market. Material handling applications, particularly in heavy machinery and drive systems, require girth gears with high wear resistance and corrosion resistance.
Gear ratios are meticulously engineered to optimize process improvement and operational efficiency. Industry consolidation and supply chain management have led to the adoption of contract manufacturing, heat treatment, and surface finishing techniques to enhance product quality and performance metrics. Environmental regulations necessitate the use of eco-friendly materials and energy-efficient gears. Safety standards and technical support are essential components of the girth gear market, ensuring the safety and reliability of equipment. After-sales services, including predictive maintenance and remote monitoring, have gained traction to minimize downtime and improve overall equipment effectiveness. Power generation applications, such as wind and hydroelectric power, also rely on girth gears for efficient energy conversion.
Material selection, life cycle analysis, and process improvement are critical factors in the girth gear market. Steel industry players are continuously innovating to develop high-performance gears with superior wear resistance and energy efficiency. The mining industry's girth gear market is expected to grow significantly due to the increasing demand for material handling and process optimization. In summary, the flange-mounted market is experiencing substantial growth due to the increasing energy demand, industrialization, and investments in renewable energy projects. The market is driven by factors such as material handling applications, operational optimization, supply chain management, gear ratio, environmental regulations, safety standards, technical support, performance metrics, surface finishing, project management, quality control, after-sales service, predictive maintenance, remote monitoring, and power generation.
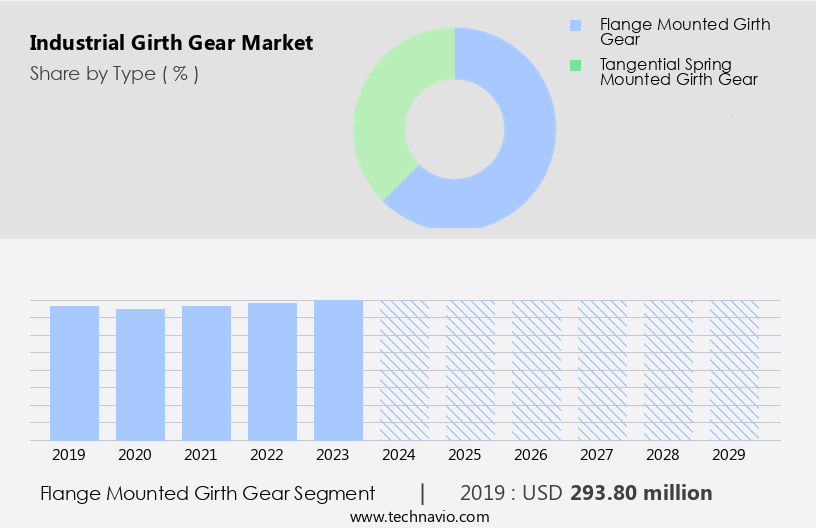
The Flange mounted girth gear segment was valued at USD 293.80 million in 2019 and showed a gradual increase during the forecast period.
Regional Analysis
APAC is estimated to contribute 58% to the growth of the global market during the forecast period. Technavio's analysts have elaborately explained the regional trends and drivers that shape the market during the forecast period.

The market is experiencing significant growth, particularly in regions like APAC, where countries such as China and India are expanding their cement production capacities. With the presence of major industrial players in the cement, chemical, and manufacturing industries, the region contributes substantially to the global market. China, being the leading lime producer in the region in 2024, is a significant contributor to the demand for girth gears due to the rapid expansion of industries like construction, automotive, and technology. The high demand for metals like steel, aluminum, and copper fuels the need for efficient material handling systems and girth gears in these industries.
To maintain operational optimization and cost reduction, companies are focusing on process improvement and supply chain management. The importance of spare parts and predictive maintenance in ensuring the longevity of girth gears is increasingly recognized. Industry consolidation and life cycle analysis are essential aspects of strategic decision-making. Material selection and wear resistance are critical factors in the steel industry, where girth gears are extensively used. Environmental regulations and safety standards are driving the demand for corrosion resistance and energy efficiency in girth gears. Drive systems and heavy machinery in industries like mining and cement rely on girth gears for optimal performance.
Technical support, performance metrics, surface finishing, project management, quality control, and after-sales service are essential components of the girth gear market. Remote monitoring and predictive maintenance are becoming increasingly popular to ensure minimal downtime and maximize productivity. Power generation industries are also significant consumers of girth gears due to their role in maintaining the efficiency of the power transmission systems.
Market Dynamics
Our researchers analyzed the data with 2024 as the base year, along with the key drivers, trends, and challenges. A holistic analysis of drivers will help companies refine their marketing strategies to gain a competitive advantage.
What are the Industrial Girth Gear market drivers leading to the rise in the adoption of Industry?
- The advancement of girth gear manufacturing technologies is the primary catalyst fueling market growth. Girth gear manufacturing technologies have experienced significant improvements, which serve as the primary catalyst for market expansion. The evolution of sophisticated girth gear manufacturing techniques is the driving force propelling market progression. Industrial girth gears have become increasingly popular in various industries, particularly in autogenous grinding (AG) and semi-autogenous grinding (SAG) mills, as operators seek cost-effective solutions for large gear manufacturing. The advancement of gear manufacturing technologies has enabled the production of larger girth gears, up to 45-49 feet in diameter, using technologies like MAGMA and Finite Element Analysis (FEA). These automated inspection software tools facilitate the prototyping and development process, ensuring precise rotor movement with a hollow shaft and minimal vibration. Ball mills, rotary kilns, dryers, and steel processing are among the major industries that utilize industrial girth gears. The mining industry, in particular, benefits significantly from the use of these gears due to their durability and wear resistance.
- Industry consolidation has led to increased competition among manufacturers, resulting in continuous improvements in the quality and efficiency of girth gear production. Life cycle analysis and material selection are crucial factors in the manufacturing process. Steel industry experts collaborate with girth gear manufacturers to select the optimal material for each application, ensuring the gear can withstand the harsh operating conditions of industrial processes. The use of advanced materials, such as high-strength steel, further enhances the girth gear's wear resistance and longevity. The shift towards industrial girth gears and drives is driven by the need for cost-effective solutions and the continuous advancement of manufacturing technologies.
What are the Industrial Girth Gear market trends shaping the Industry?
- The trend in the market is shifting towards increased investments in solid waste management. This sector is poised for significant growth due to heightened awareness and regulations regarding effective waste disposal methods. The market is experiencing significant growth due to the increasing focus on environmental sustainability and energy efficiency in various industries, particularly in the cement sector. As waste generation continues to rise, reaching 2.01 billion tons annually according to The World Bank Group, governments worldwide are implementing initiatives to reduce solid waste through waste-to-energy plants. In these facilities, rotary kilns play a crucial role in treating contaminated solid waste thermally and disposing of it in an environmentally responsible manner. Heat treatment is a critical process in rotary kilns, ensuring the effective incineration of hazardous wastes.
- Furthermore, the emphasis on safety standards and corrosion resistance in drive systems for heavy machinery is driving demand for industrial girth gears. Additionally, environmental regulations are pushing industries to adopt energy-efficient technologies, making girth gears an attractive option due to their ability to improve energy efficiency in drive systems. The market is poised for growth as industries prioritize environmental sustainability, energy efficiency, and safety standards. The increasing generation of solid waste and subsequent government initiatives to reduce it through waste-to-energy plants will continue to fuel market demand. Rotary kilns, which rely on industrial girth gears, are an essential component of these waste-to-energy facilities, making the market an attractive investment opportunity.
How does Industrial Girth Gear market faces challenges during its growth?
- The demand for refurbished girth gears poses a significant challenge to the industry's growth trajectory. This trend, driven by cost savings and sustainability considerations, necessitates a strategic response from industry players to maintain competitiveness and meet evolving customer needs. The market faces a significant challenge with the increasing demand for refurbished gears over new ones. Many manufacturers, particularly in Asia, prefer refurbished segments due to their cost-effectiveness and ease of replacement. This trend allows these manufacturers to manage their capital investments and expenditures effectively. Replacing industrial girth gears with new ones, however, comes with long lead times, with a minimum construction and delivery period of 60-90 days. To maintain optimal performance, manufacturers require robust technical support, project management, and quality control processes. Performance metrics and surface finishing are crucial factors in ensuring the longevity and efficiency of these gears.
- After-sales service, predictive maintenance, and remote monitoring are essential for the timely identification and resolution of potential issues. By focusing on these areas, manufacturers can minimize downtime and enhance their overall operational efficiency. The market requires a strategic approach to address the growing preference for refurbished gears and the associated challenges. By prioritizing technical support, performance metrics, surface finishing, project management, quality control, after-sales service, predictive maintenance, and remote monitoring, manufacturers can ensure the longevity and efficiency of their girth gears while managing their capital investments effectively.
Exclusive Customer Landscape
The industrial girth gear market forecasting report includes the adoption lifecycle of the market, covering from the innovator's stage to the laggard's stage. It focuses on adoption rates in different regions based on penetration. Furthermore, the industrial girth gear market report also includes key purchase criteria and drivers of price sensitivity to help companies evaluate and develop their market growth analysis strategies.

Customer Landscape
Key Companies & Market Insights
Companies are implementing various strategies, such as strategic alliances, industrial girth gear market forecast, partnerships, mergers and acquisitions, geographical expansion, and product/service launches, to enhance their presence in the industry.
ASHOKA MACHORD PVT. LTD. - The company specializes in manufacturing and supplying industrial girth gear solutions for various sectors, including mills, kiln drive systems, steel re-rolling mills, and paper industries.
The industry research and growth report includes detailed analyses of the competitive landscape of the market and information about key companies, including:
- ASHOKA MACHORD PVT. LTD.
- Chanderpur Group
- DB Santasalo Sarl
- FLSmidth and Co. AS
- Galbiati Costruzioni Meccaniche Srl
- Harcliff Mining Services Pty Ltd.
- Hofmann Engineering Pty Ltd.
- Kohara Gear Industry Co. Ltd.
- Kumera Corp.
- Marshall Gears
- Nippon Chuzo K.K.
- P. van der Wegen Gears
- SEW-EURODRIVE GmbH and Co KG
- Siemens AG
- Stotz Gears Pvt. Ltd.
- SYMMEN
- The KCP Ltd.
- Ueda Heavy Gear Works Ltd.
- VULCAN Industrial Engg. Co. Pvt. Ltd.
- Xinxiang Great Wall Machinery Co. Ltd.
Qualitative and quantitative analysis of companies has been conducted to help clients understand the wider business environment as well as the strengths and weaknesses of key industry players. Data is qualitatively analyzed to categorize companies as pure play, category-focused, industry-focused, and diversified; it is quantitatively analyzed to categorize companies as dominant, leading, strong, tentative, and weak.
Recent Development and News in Industrial Girth Gear Market
- In February 2023, leading girth gear manufacturer, Wärtsilä, announced the launch of its new product line, the Wärtsilä Gearbox GenSet, integrating girth gears with their engine-generator sets. This innovation aims to simplify power plant design and maintenance (Wärtsilä Press Release, 2023).
- In October 2024, Toshiba and Mitsubishi Heavy Industries (MHI) formed a strategic partnership to co-develop large-scale girth gears, targeting the power generation sector. This collaboration is expected to strengthen both companies' market presence and enhance their competitive edge (MHI Press Release, 2024).
- In March 2025, Siemens Energy secured a significant order from the Abu Dhabi National Oil Company (ADNOC) to supply girth gears for their new gas compression project. This deal represents a substantial expansion into the Middle East market for Siemens Energy (Siemens Energy Press Release, 2025)
Research Analyst Overview
The market is characterized by continuous evolution and dynamic market activities, driven by the ever-changing demands of various sectors such as material handling, mining, cement, steel, and power generation. Girth gears play a crucial role in drive systems of heavy machinery, particularly in conveyor belts, where operational optimization and cost reduction are paramount. Manufacturers of girth gears focus on providing seamless integration of technical support, performance metrics, surface finishing, project management, quality control, after-sales service, predictive maintenance, and remote monitoring to ensure optimal functionality and longevity. These entities are essential for improving processes, enhancing safety standards, and ensuring energy efficiency.
Material selection, wear resistance, and corrosion resistance are key considerations in the design and manufacturing of girth gears. As environmental regulations evolve, manufacturers are increasingly focusing on heat treatment and other advanced processes to improve the durability and sustainability of their products. Industry consolidation and supply chain management are shaping the competitive landscape, with contract manufacturing and life cycle analysis becoming increasingly important. The ongoing focus on process improvement and predictive maintenance is driving innovation in the market, with remote monitoring and advanced analytics playing a growing role in optimizing girth gear performance.
Dive into Technavio's strong research methodology, blending expert interviews, extensive data synthesis, and validated models for unparalleled Industrial Girth Gear Market insights. See full methodology.
|
Market Scope |
|
|
Report Coverage |
Details |
|
Page number |
225 |
|
Base year |
2024 |
|
Historic period |
2019-2023 |
|
Forecast period |
2025-2029 |
|
Growth momentum & CAGR |
Accelerate at a CAGR of 2.1% |
|
Market growth 2025-2029 |
USD 62.9 million |
|
Market structure |
Fragmented |
|
YoY growth 2024-2025(%) |
2.1 |
|
Key countries |
China, US, India, Russia, Japan, UK, South Korea, Germany, Canada, and France |
|
Competitive landscape |
Leading Companies, Market Positioning of Companies, Competitive Strategies, and Industry Risks |
What are the Key Data Covered in this Industrial Girth Gear Market Research and Growth Report?
- CAGR of the Industrial Girth Gear industry during the forecast period
- Detailed information on factors that will drive the growth and forecasting between 2025 and 2029
- Precise estimation of the size of the market and its contribution of the industry in focus to the parent market
- Accurate predictions about upcoming growth and trends and changes in consumer behaviour
- Growth of the market across APAC, Europe, North America, Middle East and Africa, and South America
- Thorough analysis of the market's competitive landscape and detailed information about companies
- Comprehensive analysis of factors that will challenge the industrial girth gear market growth of industry companies
We can help! Our analysts can customize this industrial girth gear market research report to meet your requirements.
 RIA -
RIA - 
