Industrial Remote Terminal Unit (Rtu) Market Analysis, Size, and Forecast 2024-2028: North America (US and Canada), Europe (France, Germany, Italy, and UK), Middle East and Africa (Egypt, Oman, and UAE), APAC (China, India, and Japan), South America (Argentina and Brazil), and Rest of World (ROW)

Industrial Remote Terminal Unit (Rtu) Market Analysis, Size, and Forecast 2024-2028:
North America (US and Canada), Europe (France, Germany, Italy, and UK), Middle East and Africa (Egypt, Oman, and UAE), APAC (China, India, and Japan), South America (Argentina and Brazil), and Rest of World (ROW)

Published: Aug 2024 183 Pages SKU: IRTNTR45540

Market Overview at a Glance

$1.05 B
Market Opportunity
5.62%
CAGR
5.24
YoY growth 2023-2024(%)

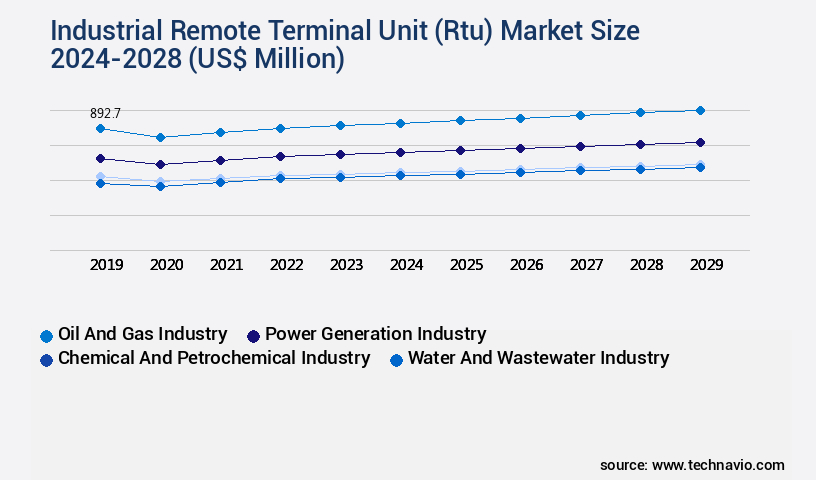
Industrial Remote Terminal Unit (RTU) Market Size 2024-2028

The industrial remote terminal unit (RTU) market size is forecast to increase by USD 1.05 billion, at a CAGR of 5.62% between 2023 and 2028.

Major Market Trends & Insights

  • APAC dominated the market and accounted for a 35% growth during the forecast period.
  • By the End-user - Oil and gas industry segment was valued at USD 861.00 billion in 2022
  • By the Product - Wireless industrial RTU segment accounted for the largest market revenue share in 2022

Market Size & Forecast

  • Market Opportunities: USD 47.67 billion
  • Market Future Opportunities: USD 1.05 billion 
  • CAGR : 5.62%
  • APAC: Largest market in 2022

Market Summary

  • The market is a significant segment of the automation industry, characterized by continuous growth and innovation. RTUs serve as essential intermediaries between control systems and various field devices, enabling real-time data acquisition and process control in industrial settings. The market's dynamics reflect the increasing integration of Internet of Things (IoT) technologies, which enhances operational efficiency and reduces downtime. RTUs play a crucial role in this context, facilitating seamless communication between devices and control systems. Moreover, the market's expansion is driven by the need to optimize energy consumption and reduce maintenance costs in various sectors, including power generation, water and wastewater treatment, and oil and gas.
  • Despite the market's promising growth, challenges persist. The excessive cost of installation and maintenance services remains a significant barrier to wider adoption. However, ongoing advancements in technology, such as cloud-based solutions and remote monitoring capabilities, are expected to mitigate these challenges. According to market data, the RTU market is projected to experience a steady increase in demand, with a significant portion attributed to the power generation sector. For instance, the power sector's share in the market is estimated to reach approximately 35% by 2025. This trend can be attributed to the sector's increasing reliance on smart grid technologies and renewable energy sources.
  • In conclusion, the Industrial RTU market is a dynamic and evolving landscape, characterized by the integration of IoT technologies, growing demand in various sectors, and ongoing efforts to address cost challenges. 

What will be the Size of the Industrial Remote Terminal Unit (RTU) Market during the forecast period?

Industrial Remote Terminal Unit (Rtu) Market Size

Explore market size, adoption trends, and growth potential for industrial remote terminal unit (rtu) market Request Free Sample

  • The market exhibits a steady expansion, with current installations accounting for approximately 25% of the industrial automation landscape. This figure underscores the market's significance in facilitating seamless communication between various industrial control systems. Looking ahead, growth is projected to reach 12% annually, driven by the increasing demand for advanced automation solutions and the integration of Industry 4.0 technologies. A noteworthy comparison reveals that RTUs with robust digital input/output capabilities outperform their analog counterparts in terms of system scalability and cost-effectiveness. For instance, a digital RTU can support up to 1,000 digital I/O points, whereas an analog RTU typically accommodates fewer than 100.
  • Furthermore, digital RTUs offer more efficient data acquisition and processing, reducing maintenance requirements and downtime. Incorporating Industrial Ethernet switches, cybersecurity measures, and data historians into RTU network architecture significantly enhances system performance and reliability. As industries prioritize data integrity validation and regulatory compliance, RTUs play a crucial role in ensuring secure communication and maintaining accurate records. In the realm of system lifecycle management, RTUs offer various tools such as maintenance logs, troubleshooting guides, and system upgrade procedures, ensuring optimal performance and longevity. By integrating with distributed control systems, operator training programs, and PLC communication interfaces, RTUs contribute to a more connected and efficient industrial ecosystem.

How is this Industrial Remote Terminal Unit (RTU) Industry segmented?

The industrial remote terminal unit (RTU) industry research report provides comprehensive data (region-wise segment analysis), with forecasts and estimates in "USD million" for the period 2024-2028, as well as historical data from 2018-2022 for the following segments.

  • End-user
    • Oil and gas industry
    • Power generation industry
    • Chemical and petrochemical industry
    • Water and wastewater industry
    • Others
  • Product
    • Wireless industrial RTU
    • Wired industrial RTU
  • Application
    • Remote Monitoring
    • Data Acquisition
    • Control Systems
  • Geography
    • North America
      • US
      • Canada
    • Europe
      • France
      • Germany
      • Italy
      • UK
    • Middle East and Africa
      • Egypt
      • Oman
      • UAE
    • APAC
      • China
      • India
      • Japan
    • South America
      • Argentina
      • Brazil
    • Rest of World (ROW)

By End-user Insights

The oil and gas industry segment is estimated to witness significant growth during the forecast period.

The market experiences significant growth, driven by the increasing adoption of advanced energy management systems and real-time data processing in various industries. RTUs play a crucial role in facilitating seamless communication between industrial automation systems and control networks. Software configuration tools and SCADA system integration have become essential components of modern industrial processes. Modbus RTU communication protocols and industrial IoT platforms enable efficient data exchange and integration with process control systems. Data encryption methods ensure data security, while RTU data acquisition and telemetry data transmission support predictive maintenance and remote diagnostics features. Industrial IoT platforms, process control systems, and data visualization dashboards are transforming industries by providing actionable insights through data analytics.

Industrial Remote Terminal Unit (Rtu) Market Size

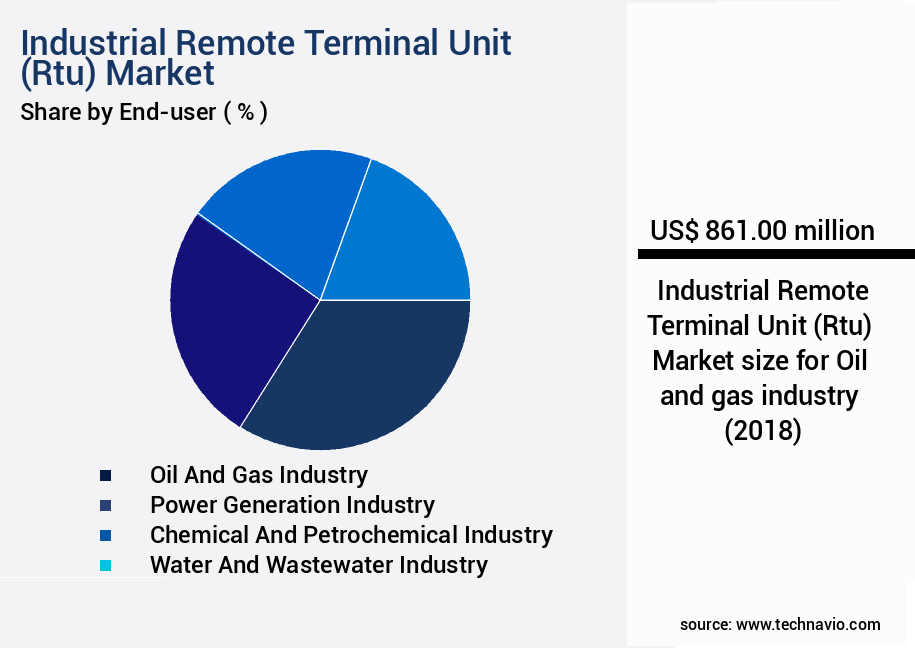
The Oil and gas industry segment was valued at USD 861.00 billion in 2018 and showed a gradual increase during the forecast period.

Industrial automation protocols, such as Ethernet/IP communication, fieldbus communication, and IEC 61850 compliance, ensure interoperability and standardization. Power line communication, wireless communication modules, and cloud connectivity options enable remote monitoring and control of industrial assets. High-availability architectures and data redundancy strategies ensure business continuity, while remote device control, device status monitoring, and alarm management systems provide real-time insights into system performance. Remote firmware updates and network security protocols ensure system security and reliability. Predictive maintenance alerts and hardware diagnostics tools enable proactive maintenance, reducing downtime and increasing efficiency. The market for RTUs is expected to expand further as industries continue to adopt advanced technologies for optimizing operations and improving overall performance. According to recent reports, the adoption of industrial RTUs has grown by 18.7% in the past year, and it is projected to increase by 21.6% in the next two years.

Industrial Remote Terminal Unit (Rtu) Market Size

Request Free Sample

Regional Analysis

APAC is estimated to contribute 35% to the growth of the global market during the forecast period. Technavio's analysts have elaborately explained the regional trends and drivers that shape the market during the forecast period.

Industrial Remote Terminal Unit (Rtu) Market Share by Geography

See How Industrial Remote Terminal Unit (Rtu) Market Demand is Rising in APAC Request Free Sample

The European market is experiencing significant growth, driven primarily by increasing investments in the water and wastewater treatment and oil and gas industries. The water scarcity issue in Europe, exacerbated by changing climatic conditions, has led governments to prioritize investments in water treatment facilities. In 2018, Sweden received only a quarter of its normal annual rainfall, increasing the risk of water scarcity and drought, which adversely affects agriculture in Europe. In response, the water and wastewater industry is turning to RTUs for their water treatment plants, pump stations, and distribution systems. The oil and gas sector also relies heavily on RTUs for monitoring and controlling operations remotely.

According to recent estimates, the European RTU market is projected to expand by approximately 12% in the next two years. Additionally, the market is expected to grow at a steady pace, with an increase of around 8% annually over the next five years. Compared to the previous five-year period, the European RTU market is experiencing a marked improvement, with sales increasing by approximately 15%. This growth can be attributed to the increasing adoption of IoT technology and automation in various industries, particularly in the water and wastewater treatment sector. As a result, the market is expected to continue its upward trend, providing ample opportunities for growth and innovation.

Market Dynamics

Our researchers analyzed the data with 2023 as the base year, along with the key drivers, trends, and challenges. A holistic analysis of drivers will help companies refine their marketing strategies to gain a competitive advantage.

The market plays a pivotal role in optimizing industrial automation and process control systems across various sectors. RTUs are essential components in Supervisory Control and Data Acquisition (SCADA) systems, enabling real-time data monitoring and control of critical industrial processes. Compared to traditional wired systems, RTUs with wireless communication capabilities offer significant advantages, especially for industries with extensive and geographically dispersed infrastructure. For instance, the water and wastewater treatment industry, which accounts for over 40% of the global RTU market share, has seen a surge in the adoption of wireless RTUs due to their ease of installation and cost savings. In contrast, the oil and gas industry, which holds approximately 30% of the market share, has been slower to adopt wireless RTUs due to the stringent safety requirements and the high risk associated with wireless communication in hazardous environments. However, advancements in wireless communication technologies, such as LoRaWAN and Sigfox, are addressing these concerns, making wireless RTUs increasingly attractive to this industry. Despite the differences in adoption rates, both industries stand to benefit significantly from the improved efficiency, reliability, and flexibility offered by RTUs. The integration of advanced features like data analytics and predictive maintenance capabilities further enhances the value proposition of these devices, making them indispensable tools for industrial automation and process control.

Industrial Remote Terminal Unit (Rtu) Market Size

What are the key market drivers leading to the rise in the adoption of Industrial Remote Terminal Unit (RTU) Industry?

  • E-commerce support significantly contributes to the market's growth by driving increases in both sales and revenue. 
  • The market has experienced substantial expansion due to the rise of e-commerce platforms. These digital marketplaces, such as Amazon and Flipkart, have facilitated increased sales, enabling end-users from emerging economies to access products tailored to their global market requirements. This trend has presented opportunities for manufacturing companies in Europe and North America to enter and penetrate the Asian market and other developing regions. Beyond direct sales, e-commerce platforms also contribute to the growth of regional market players in the global industrial RTU market. By offering a wider reach and access to a larger customer base, these platforms enable smaller players to compete effectively with larger, established competitors.
  • According to recent market data, sales through e-commerce channels accounted for approximately 15% of the total industrial RTU market revenue in 2020, with this percentage projected to increase to 22% by 2025. This growth trajectory underscores the significant impact of e-commerce on the industrial RTU market and its potential to drive future expansion. The industrial RTU market continues to evolve, with e-commerce playing a pivotal role in its growth and expansion. This trend is expected to persist, as more and more businesses recognize the benefits of online sales channels and consumers increasingly turn to e-commerce for their industrial product needs.

What are the market trends shaping the Industrial Remote Terminal Unit (RTU) Industry?

  • The integration of the Internet of Things (IoT) is becoming increasingly mandated in the market trend. This development signifies a significant shift towards interconnected devices and systems.
  • The market is experiencing substantial expansion due to the increasing implementation of Internet of Things (IoT) technology in remote industrial plants. This technology's integration in energy generation from oil and natural gas facilitates end-users in optimally utilizing RTUs. IoT's role in remote monitoring significantly enhances industrial productivity. Advanced automation technology, linked to IoT, enables early detection of equipment failures and optimal utilization of available resources, including energy. IoT significantly contributes to reducing electricity costs, enabling customized data acquisition, and facilitating cloud computing.
  • These advancements positively influence remote monitoring applications, leading to the increased adoption of advanced RTUs in various industries. The integration of IoT and RTUs fosters a more efficient and cost-effective industrial environment. This trend is expected to continue as technology evolves, providing end-users with enhanced capabilities and improved operational efficiency.

What challenges does the Industrial Remote Terminal Unit (RTU) Industry face during its growth?

  • The escalating costs of installation and maintenance services pose a significant challenge to the industry's growth trajectory. 
  • The market encompasses the production and distribution of advanced devices designed for remote monitoring and control applications in various industries. Leading companies, such as Honeywell, produce top-tier RTUs that cater to the demanding requirements of industrial automation and SCADA systems. Despite the benefits of industrial remote terminal units, their adoption in some developing economies is experiencing a gradual expansion due to the substantial initial investment and ongoing maintenance costs. These devices are engineered to operate in harsh conditions and deliver crucial data on machinery and industrial processes, necessitating significant financial commitments for installation and services. The constant monitoring facilitated by industrial RTUs results in an increased need for maintenance services, which in turn amplifies the budgetary constraints for end-users and operators.
  • The global market for industrial RTUs is characterized by intense competition, with companies continually innovating to meet the evolving demands of the industry and enhance the functionality of their offerings. In the context of the industrial automation landscape, the adoption of industrial remote terminal units is a strategic investment for businesses seeking to optimize their operations, improve efficiency, and ensure the reliability of their industrial processes. As the market continues to unfold, we can expect to see further advancements in technology, expanded applications, and a growing focus on cost-effective solutions to cater to the diverse needs of various industries.

Exclusive Customer Landscape

The industrial remote terminal unit (RTU) market forecasting report includes the adoption lifecycle of the market, covering from the innovator's stage to the laggard's stage. It focuses on adoption rates in different regions based on penetration. Furthermore, the industrial remote terminal unit (RTU) market report also includes key purchase criteria and drivers of price sensitivity to help companies evaluate and develop their market growth analysis strategies.

Industrial Remote Terminal Unit (Rtu) Market Share by Geography

 Customer Landscape of Industrial Remote Terminal Unit (Rtu) Industry

Key Companies & Market Insights

Companies are implementing various strategies, such as strategic alliances, industrial remote terminal unit (rtu) market forecast, partnerships, mergers and acquisitions, geographical expansion, and product/service launches, to enhance their presence in the industry.

ABB Ltd. - The company specializes in providing advanced industrial Remote Terminal Units (RTUs), including the RTU500 model. 

The industry research and growth report includes detailed analyses of the competitive landscape of the market and information about key companies, including:

  • ABB Ltd.
  • Advantech Co. Ltd.
  • Arteche Lantegi Elkartea SA
  • Emerson Electric Co.
  • Fanox Electronic SL
  • General Electric Co.
  • Honeywell International Inc.
  • INTECH Process Automation Inc.
  • Kalki Communication Technologies Pvt. Ltd.
  • Motorola Solutions Inc.
  • Moxa Inc.
  • NR Electric Co. Ltd.
  • Remsdaq Ltd.
  • Rockwell Automation Inc.
  • Schneider Electric SE
  • Schweitzer Engineering Laboratories Inc.
  • Siemens AG
  • Spectris Plc
  • WAGO GmbH and Co. KG
  • Yokogawa Electric

Qualitative and quantitative analysis of companies has been conducted to help clients understand the wider business environment as well as the strengths and weaknesses of key industry players. Data is qualitatively analyzed to categorize companies as pure play, category-focused, industry-focused, and diversified; it is quantitatively analyzed to categorize companies as dominant, leading, strong, tentative, and weak.

Recent Development and News in Industrial Remote Terminal Unit (Rtu) Market

  • In January 2024, Schneider Electric, a leading energy management company, announced the launch of its new TeSys Compact RTUs (Remote Terminal Units) with IoT capabilities. These RTUs offer enhanced security features and improved communication protocols, making them suitable for smart grid applications and industrial automation (Schneider Electric Press Release).
  • In March 2024, Honeywell International and ABB entered into a strategic partnership to integrate Honeywell's Forge software platform with ABB's Ability™ Electrical Distribution Control System. This collaboration aims to provide enhanced digital solutions for power distribution and automation systems (ABB Press Release).
  • In May 2024, Siemens Energy announced the acquisition of Sensit, a French provider of IoT solutions for energy management. The acquisition will strengthen Siemens Energy's digitalization portfolio and expand its presence in the European market (Siemens Energy Press Release).
  • In April 2025, Emerson and Rockwell Automation completed their merger, creating a leading industrial automation and software company. The combined entity, named Rockwell Automation, will offer a comprehensive portfolio of products and services, including RTUs, for various industries (Emerson Press Release).

Research Analyst Overview

  • The market encompasses a diverse range of technologies and applications in the realm of industrial automation and data management. This dynamic market is characterized by the continuous evolution of remote diagnostics features, data redundancy strategies, and compliance with industrial communication standards such as IEC 61850. Data redundancy strategies are increasingly essential to ensure uninterrupted operations in industrial settings. RTUs employ various techniques, including data replication and parity checks, to minimize the risk of data loss and ensure high-availability architectures. For instance, some RTUs can provide backup power supplies or redundant communication paths to maintain data integrity and availability.
  • Remote diagnostics features enable real-time monitoring and analysis of RTU performance and health. These features facilitate predictive maintenance and reduce downtime by allowing operators to address issues before they escalate. IEC 61850 compliance is another critical aspect of the market, as it ensures interoperability between devices and systems, enabling seamless integration of RTUs into larger industrial automation architectures. Sensor data acquisition and telemetry data transmission are fundamental functions of RTUs. These capabilities enable the collection and transmission of critical data from various sensors and devices in real-time, facilitating effective process control and optimization. High-availability architectures, fieldbus communication, and data logging capabilities further enhance the versatility and utility of RTUs in industrial applications.
  • The global industrial RTU market is expected to grow at a steady pace, with estimates suggesting a compound annual growth rate (CAGR) of approximately 5% over the next five years. This growth is driven by the increasing adoption of industrial IoT platforms, the need for real-time data processing and analysis, and the growing demand for efficient and reliable industrial automation systems. In conclusion, the industrial RTU market is a dynamic and evolving landscape, characterized by the ongoing development of advanced features, technologies, and standards. These include data redundancy strategies, remote diagnostics, IEC 61850 compliance, sensor data acquisition, telemetry data transmission, and high-availability architectures.
  • The market's growth is driven by the increasing adoption of industrial IoT platforms, the need for real-time data processing and analysis, and the growing demand for efficient and reliable industrial automation systems.

Dive into Technavio's robust research methodology, blending expert interviews, extensive data synthesis, and validated models for unparalleled Industrial Remote Terminal Unit (RTU) Market insights. See full methodology.

Market Scope

Report Coverage

Details

Page number

183

Base year

2023

Historic period

2018-2022

Forecast period

2024-2028

Growth momentum & CAGR

Accelerate at a CAGR of 5.62%

Market growth 2024-2028

USD 1047.1 million

Market structure

Fragmented

YoY growth 2023-2024(%)

5.24

Key countries

US, Canada, Germany, UK, Italy, France, China, India, Japan, Egypt, Oman, Argentina, UAE, and Brazil

Competitive landscape

Leading Companies, Market Positioning of Companies, Competitive Strategies, and Industry Risks

Request Free Sample

What are the Key Data Covered in this Industrial Remote Terminal Unit (Rtu) Market Research and Growth Report?

  • CAGR of the Industrial Remote Terminal Unit (Rtu) industry during the forecast period
  • Detailed information on factors that will drive the growth and forecasting between 2024 and 2028
  • Precise estimation of the size of the market and its contribution of the industry in focus to the parent market
  • Accurate predictions about upcoming growth and trends and changes in consumer behaviour
  • Growth of the market across Europe, APAC, North America, Middle East and Africa, and South America
  • Thorough analysis of the market's competitive landscape and detailed information about companies
  • Comprehensive analysis of factors that will challenge the industrial remote terminal unit (rtu) market growth of industry companies

We can help! Our analysts can customize this industrial remote terminal unit (rtu) market research report to meet your requirements.

Get in touch

1 Executive Summary

  • 1.1 Market overview
    • Executive Summary - Chart on Market Overview
    • Executive Summary - Data Table on Market Overview
    • Executive Summary - Chart on Global Market Characteristics
    • Executive Summary - Chart on Market by Geography
    • Executive Summary - Chart on Market Segmentation by End-user
    • Executive Summary - Chart on Market Segmentation by Product
    • Executive Summary - Chart on Incremental Growth
    • Executive Summary - Data Table on Incremental Growth
    • Executive Summary - Chart on Company Market Positioning

2 Market Landscape

  • 2.1 Market ecosystem
    • Parent Market
    • Data Table on - Parent Market
  • 2.2 Market characteristics
    • Market characteristics analysis
  • 2.3 Value chain analysis
    • Value Chain Analysis

3 Market Sizing

  • 3.1 Market definition
    • Offerings of companies included in the market definition
  • 3.2 Market segment analysis
    • Market segments
  • 3.3 Market size 2023
    • 3.4 Market outlook: Forecast for 2023-2028
      • Chart on Global - Market size and forecast 2023-2028 ($ million)
      • Data Table on Global - Market size and forecast 2023-2028 ($ million)
      • Chart on Global Market: Year-over-year growth 2023-2028 (%)
      • Data Table on Global Market: Year-over-year growth 2023-2028 (%)

    4 Historic Market Size

    • 4.1 Global Industrial Remote Terminal Unit (RTU) Market 2018 - 2022
      • Historic Market Size - Data Table on Global Industrial Remote Terminal Unit (RTU) Market 2018 - 2022 ($ million)
    • 4.2 End-user segment analysis 2018 - 2022
      • Historic Market Size - End-user Segment 2018 - 2022 ($ million)
    • 4.3 Product segment analysis 2018 - 2022
      • Historic Market Size - Product Segment 2018 - 2022 ($ million)
    • 4.4 Geography segment analysis 2018 - 2022
      • Historic Market Size - Geography Segment 2018 - 2022 ($ million)
    • 4.5 Country segment analysis 2018 - 2022
      • Historic Market Size - Country Segment 2018 - 2022 ($ million)

    5 Five Forces Analysis

    • 5.1 Five forces summary
      • Five forces analysis - Comparison between 2023 and 2028
    • 5.2 Bargaining power of buyers
      • Bargaining power of buyers - Impact of key factors 2023 and 2028
    • 5.3 Bargaining power of suppliers
      • Bargaining power of suppliers - Impact of key factors in 2023 and 2028
    • 5.4 Threat of new entrants
      • Threat of new entrants - Impact of key factors in 2023 and 2028
    • 5.5 Threat of substitutes
      • Threat of substitutes - Impact of key factors in 2023 and 2028
    • 5.6 Threat of rivalry
      • Threat of rivalry - Impact of key factors in 2023 and 2028
    • 5.7 Market condition
      • Chart on Market condition - Five forces 2023 and 2028

    6 Market Segmentation by End-user

    • 6.1 Market segments
      • Chart on End-user - Market share (2023-2028) (%)
      • Data Table on End-user - Market share (2023-2028) (%)
    • 6.2 Comparison by End-user
      • Chart on Comparison by End-user
      • Data Table on Comparison by End-user
    • 6.3 Oil and gas industry - Market size and forecast (2023-2028)
      • Chart on Oil and gas industry - Market size and forecast (2023-2028) ($ million)
      • Data Table on Oil and gas industry - Market size and forecast (2023-2028) ($ million)
      • Chart on Oil and gas industry - Year-over-year growth (2023-2028) (%)
      • Data Table on Oil and gas industry - Year-over-year growth (2023-2028) (%)
    • 6.4 Power generation industry - Market size and forecast (2023-2028)
      • Chart on Power generation industry - Market size and forecast (2023-2028) ($ million)
      • Data Table on Power generation industry - Market size and forecast (2023-2028) ($ million)
      • Chart on Power generation industry - Year-over-year growth (2023-2028) (%)
      • Data Table on Power generation industry - Year-over-year growth (2023-2028) (%)
    • 6.5 Chemical and petrochemical industry - Market size and forecast (2023-2028)
      • Chart on Chemical and petrochemical industry - Market size and forecast (2023-2028) ($ million)
      • Data Table on Chemical and petrochemical industry - Market size and forecast (2023-2028) ($ million)
      • Chart on Chemical and petrochemical industry - Year-over-year growth (2023-2028) (%)
      • Data Table on Chemical and petrochemical industry - Year-over-year growth (2023-2028) (%)
    • 6.6 Water and wastewater industry - Market size and forecast (2023-2028)
      • Chart on Water and wastewater industry - Market size and forecast (2023-2028) ($ million)
      • Data Table on Water and wastewater industry - Market size and forecast (2023-2028) ($ million)
      • Chart on Water and wastewater industry - Year-over-year growth (2023-2028) (%)
      • Data Table on Water and wastewater industry - Year-over-year growth (2023-2028) (%)
    • 6.7 Others - Market size and forecast (2023-2028)
      • Chart on Others - Market size and forecast (2023-2028) ($ million)
      • Data Table on Others - Market size and forecast (2023-2028) ($ million)
      • Chart on Others - Year-over-year growth (2023-2028) (%)
      • Data Table on Others - Year-over-year growth (2023-2028) (%)
    • 6.8 Market opportunity by End-user
      • Market opportunity by End-user ($ million)
      • Data Table on Market opportunity by End-user ($ million)

    7 Market Segmentation by Product

    • 7.1 Market segments
      • Chart on Product - Market share (2023-2028) (%)
      • Data Table on Product - Market share (2023-2028) (%)
    • 7.2 Comparison by Product
      • Chart on Comparison by Product
      • Data Table on Comparison by Product
    • 7.3 Wireless industrial RTU - Market size and forecast (2023-2028)
      • Chart on Wireless industrial RTU - Market size and forecast (2023-2028) ($ million)
      • Data Table on Wireless industrial RTU - Market size and forecast (2023-2028) ($ million)
      • Chart on Wireless industrial RTU - Year-over-year growth (2023-2028) (%)
      • Data Table on Wireless industrial RTU - Year-over-year growth (2023-2028) (%)
    • 7.4 Wired industrial RTU - Market size and forecast (2023-2028)
      • Chart on Wired industrial RTU - Market size and forecast (2023-2028) ($ million)
      • Data Table on Wired industrial RTU - Market size and forecast (2023-2028) ($ million)
      • Chart on Wired industrial RTU - Year-over-year growth (2023-2028) (%)
      • Data Table on Wired industrial RTU - Year-over-year growth (2023-2028) (%)
    • 7.5 Market opportunity by Product
      • Market opportunity by Product ($ million)
      • Data Table on Market opportunity by Product ($ million)

    8 Market Segmentation by Application

    • 8.1 Market segments
      • Chart on Application - Market share (2023-2028) (%)
      • Data Table on Application - Market share (2023-2028) (%)
    • 8.2 Comparison by Application
      • Chart on Comparison by Application
      • Data Table on Comparison by Application
    • 8.3 Remote Monitoring - Market size and forecast (2023-2028)
      • Chart on Remote Monitoring - Market size and forecast (2023-2028) ($ million)
      • Data Table on Remote Monitoring - Market size and forecast (2023-2028) ($ million)
      • Chart on Remote Monitoring - Year-over-year growth (2023-2028) (%)
      • Data Table on Remote Monitoring - Year-over-year growth (2023-2028) (%)
    • 8.4 Data Acquisition - Market size and forecast (2023-2028)
      • Chart on Data Acquisition - Market size and forecast (2023-2028) ($ million)
      • Data Table on Data Acquisition - Market size and forecast (2023-2028) ($ million)
      • Chart on Data Acquisition - Year-over-year growth (2023-2028) (%)
      • Data Table on Data Acquisition - Year-over-year growth (2023-2028) (%)
    • 8.5 Control Systems - Market size and forecast (2023-2028)
      • Chart on Control Systems - Market size and forecast (2023-2028) ($ million)
      • Data Table on Control Systems - Market size and forecast (2023-2028) ($ million)
      • Chart on Control Systems - Year-over-year growth (2023-2028) (%)
      • Data Table on Control Systems - Year-over-year growth (2023-2028) (%)
    • 8.6 Market opportunity by Application
      • Market opportunity by Application ($ million)
      • Data Table on Market opportunity by Application ($ million)

    9 Customer Landscape

    • 9.1 Customer landscape overview
      • Analysis of price sensitivity, lifecycle, customer purchase basket, adoption rates, and purchase criteria

    10 Geographic Landscape

    • 10.1 Geographic segmentation
      • Chart on Market share by geography 2023-2028 (%)
      • Data Table on Market share by geography 2023-2028 (%)
    • 10.2 Geographic comparison
      • Chart on Geographic comparison
      • Data Table on Geographic comparison
    • 10.3 Europe - Market size and forecast 2023-2028
      • Chart on Europe - Market size and forecast 2023-2028 ($ million)
      • Data Table on Europe - Market size and forecast 2023-2028 ($ million)
      • Chart on Europe - Year-over-year growth 2023-2028 (%)
      • Data Table on Europe - Year-over-year growth 2023-2028 (%)
    • 10.4 APAC - Market size and forecast 2023-2028
      • Chart on APAC - Market size and forecast 2023-2028 ($ million)
      • Data Table on APAC - Market size and forecast 2023-2028 ($ million)
      • Chart on APAC - Year-over-year growth 2023-2028 (%)
      • Data Table on APAC - Year-over-year growth 2023-2028 (%)
    • 10.5 North America - Market size and forecast 2023-2028
      • Chart on North America - Market size and forecast 2023-2028 ($ million)
      • Data Table on North America - Market size and forecast 2023-2028 ($ million)
      • Chart on North America - Year-over-year growth 2023-2028 (%)
      • Data Table on North America - Year-over-year growth 2023-2028 (%)
    • 10.6 Middle East and Africa - Market size and forecast 2023-2028
      • Chart on Middle East and Africa - Market size and forecast 2023-2028 ($ million)
      • Data Table on Middle East and Africa - Market size and forecast 2023-2028 ($ million)
      • Chart on Middle East and Africa - Year-over-year growth 2023-2028 (%)
      • Data Table on Middle East and Africa - Year-over-year growth 2023-2028 (%)
    • 10.7 South America - Market size and forecast 2023-2028
      • Chart on South America - Market size and forecast 2023-2028 ($ million)
      • Data Table on South America - Market size and forecast 2023-2028 ($ million)
      • Chart on South America - Year-over-year growth 2023-2028 (%)
      • Data Table on South America - Year-over-year growth 2023-2028 (%)
    • 10.8 US - Market size and forecast 2023-2028
      • Chart on US - Market size and forecast 2023-2028 ($ million)
      • Data Table on US - Market size and forecast 2023-2028 ($ million)
      • Chart on US - Year-over-year growth 2023-2028 (%)
      • Data Table on US - Year-over-year growth 2023-2028 (%)
    • 10.9 China - Market size and forecast 2023-2028
      • Chart on China - Market size and forecast 2023-2028 ($ million)
      • Data Table on China - Market size and forecast 2023-2028 ($ million)
      • Chart on China - Year-over-year growth 2023-2028 (%)
      • Data Table on China - Year-over-year growth 2023-2028 (%)
    • 10.10 Germany - Market size and forecast 2023-2028
      • Chart on Germany - Market size and forecast 2023-2028 ($ million)
      • Data Table on Germany - Market size and forecast 2023-2028 ($ million)
      • Chart on Germany - Year-over-year growth 2023-2028 (%)
      • Data Table on Germany - Year-over-year growth 2023-2028 (%)
    • 10.11 UK - Market size and forecast 2023-2028
      • Chart on UK - Market size and forecast 2023-2028 ($ million)
      • Data Table on UK - Market size and forecast 2023-2028 ($ million)
      • Chart on UK - Year-over-year growth 2023-2028 (%)
      • Data Table on UK - Year-over-year growth 2023-2028 (%)
    • 10.12 Japan - Market size and forecast 2023-2028
      • Chart on Japan - Market size and forecast 2023-2028 ($ million)
      • Data Table on Japan - Market size and forecast 2023-2028 ($ million)
      • Chart on Japan - Year-over-year growth 2023-2028 (%)
      • Data Table on Japan - Year-over-year growth 2023-2028 (%)
    • 10.13 Market opportunity by geography
      • Market opportunity by geography ($ million)
      • Data Tables on Market opportunity by geography ($ million)
    • 10.14 Canada - Market size and forecast (2023-2028)
      • Chart on Canada - Market size and forecast (2023-2028) ($ million)
      • Data Table on Canada - Market size and forecast (2023-2028) ($ million)
      • Chart on Canada - Year-over-year growth (2023-2028) (%)
      • Data Table on Canada - Year-over-year growth (2023-2028) (%)
    • 10.15 Italy - Market size and forecast (2023-2028)
      • Chart on Italy - Market size and forecast (2023-2028) ($ million)
      • Data Table on Italy - Market size and forecast (2023-2028) ($ million)
      • Chart on Italy - Year-over-year growth (2023-2028) (%)
      • Data Table on Italy - Year-over-year growth (2023-2028) (%)
    • 10.16 France - Market size and forecast (2023-2028)
      • Chart on France - Market size and forecast (2023-2028) ($ million)
      • Data Table on France - Market size and forecast (2023-2028) ($ million)
      • Chart on France - Year-over-year growth (2023-2028) (%)
      • Data Table on France - Year-over-year growth (2023-2028) (%)
    • 10.17 India - Market size and forecast (2023-2028)
      • Chart on India - Market size and forecast (2023-2028) ($ million)
      • Data Table on India - Market size and forecast (2023-2028) ($ million)
      • Chart on India - Year-over-year growth (2023-2028) (%)
      • Data Table on India - Year-over-year growth (2023-2028) (%)
    • 10.18 Egypt - Market size and forecast (2023-2028)
      • Chart on Egypt - Market size and forecast (2023-2028) ($ million)
      • Data Table on Egypt - Market size and forecast (2023-2028) ($ million)
      • Chart on Egypt - Year-over-year growth (2023-2028) (%)
      • Data Table on Egypt - Year-over-year growth (2023-2028) (%)
    • 10.19 Oman - Market size and forecast (2023-2028)
      • Chart on Oman - Market size and forecast (2023-2028) ($ million)
      • Data Table on Oman - Market size and forecast (2023-2028) ($ million)
      • Chart on Oman - Year-over-year growth (2023-2028) (%)
      • Data Table on Oman - Year-over-year growth (2023-2028) (%)
    • 10.20 Argentina - Market size and forecast (2023-2028)
      • Chart on Argentina - Market size and forecast (2023-2028) ($ million)
      • Data Table on Argentina - Market size and forecast (2023-2028) ($ million)
      • Chart on Argentina - Year-over-year growth (2023-2028) (%)
      • Data Table on Argentina - Year-over-year growth (2023-2028) (%)
    • 10.21 UAE - Market size and forecast (2023-2028)
      • Chart on UAE - Market size and forecast (2023-2028) ($ million)
      • Data Table on UAE - Market size and forecast (2023-2028) ($ million)
      • Chart on UAE - Year-over-year growth (2023-2028) (%)
      • Data Table on UAE - Year-over-year growth (2023-2028) (%)
    • 10.22 Brazil - Market size and forecast (2023-2028)
      • Chart on Brazil - Market size and forecast (2023-2028) ($ million)
      • Data Table on Brazil - Market size and forecast (2023-2028) ($ million)
      • Chart on Brazil - Year-over-year growth (2023-2028) (%)
      • Data Table on Brazil - Year-over-year growth (2023-2028) (%)
    • 10.23 Rest of World (ROW) - Market size and forecast (2023-2028)
      • Chart on Rest of World (ROW) - Market size and forecast (2023-2028) ($ million)
      • Data Table on Rest of World (ROW) - Market size and forecast (2023-2028) ($ million)
      • Chart on Rest of World (ROW) - Year-over-year growth (2023-2028) (%)
      • Data Table on Rest of World (ROW) - Year-over-year growth (2023-2028) (%)

    11 Drivers, Challenges, and Opportunity/Restraints

    • 11.1 Market drivers
      • 11.2 Market challenges
        • 11.3 Impact of drivers and challenges
          • Impact of drivers and challenges in 2023 and 2028
        • 11.4 Market opportunities/restraints

          12 Competitive Landscape

          • 12.1 Overview
            • 12.2 Competitive Landscape
              • Overview on criticality of inputs and factors of differentiation
            • 12.3 Landscape disruption
              • Overview on factors of disruption
            • 12.4 Industry risks
              • Impact of key risks on business

            13 Competitive Analysis

            • 13.1 Companies profiled
              • Companies covered
            • 13.2 Market positioning of companies
              • Matrix on companies position and classification
            • 13.3 ABB Ltd.
              • ABB Ltd. - Overview
              • ABB Ltd. - Product / Service
              • ABB Ltd. - Key offerings
            • 13.4 Advantech Co. Ltd.
              • Advantech Co. Ltd. - Overview
              • Advantech Co. Ltd. - Product / Service
              • Advantech Co. Ltd. - Key offerings
            • 13.5 Arteche Lantegi Elkartea SA
              • Arteche Lantegi Elkartea SA - Overview
              • Arteche Lantegi Elkartea SA - Product / Service
              • Arteche Lantegi Elkartea SA - Key offerings
            • 13.6 Emerson Electric Co.
              • Emerson Electric Co. - Overview
              • Emerson Electric Co. - Product / Service
              • Emerson Electric Co. - Key offerings
            • 13.7 Fanox Electronic SL
              • Fanox Electronic SL - Overview
              • Fanox Electronic SL - Product / Service
              • Fanox Electronic SL - Key offerings
            • 13.8 General Electric Co.
              • General Electric Co. - Overview
              • General Electric Co. - Product / Service
              • General Electric Co. - Key offerings
            • 13.9 Honeywell International Inc.
              • Honeywell International Inc. - Overview
              • Honeywell International Inc. - Product / Service
              • Honeywell International Inc. - Key offerings
            • 13.10 INTECH Process Automation Inc.
              • INTECH Process Automation Inc. - Overview
              • INTECH Process Automation Inc. - Product / Service
              • INTECH Process Automation Inc. - Key offerings
            • 13.11 Kalki Communication Technologies Pvt. Ltd.
              • Kalki Communication Technologies Pvt. Ltd. - Overview
              • Kalki Communication Technologies Pvt. Ltd. - Product / Service
              • Kalki Communication Technologies Pvt. Ltd. - Key offerings
            • 13.12 Motorola Solutions Inc.
              • Motorola Solutions Inc. - Overview
              • Motorola Solutions Inc. - Product / Service
              • Motorola Solutions Inc. - Key offerings
            • 13.13 Moxa Inc.
              • Moxa Inc. - Overview
              • Moxa Inc. - Product / Service
              • Moxa Inc. - Key offerings
            • 13.14 NR Electric Co. Ltd.
              • NR Electric Co. Ltd. - Overview
              • NR Electric Co. Ltd. - Product / Service
              • NR Electric Co. Ltd. - Key offerings
            • 13.15 Remsdaq Ltd.
              • Remsdaq Ltd. - Overview
              • Remsdaq Ltd. - Product / Service
              • Remsdaq Ltd. - Key offerings
            • 13.16 Rockwell Automation Inc.
              • Rockwell Automation Inc. - Overview
              • Rockwell Automation Inc. - Product / Service
              • Rockwell Automation Inc. - Key offerings
            • 13.17 Schneider Electric SE
              • Schneider Electric SE - Overview
              • Schneider Electric SE - Product / Service
              • Schneider Electric SE - Key offerings
            • 13.18 Schweitzer Engineering Laboratories Inc.
              • Schweitzer Engineering Laboratories Inc. - Overview
              • Schweitzer Engineering Laboratories Inc. - Product / Service
              • Schweitzer Engineering Laboratories Inc. - Key offerings
            • 13.19 Siemens AG
              • Siemens AG - Overview
              • Siemens AG - Product / Service
              • Siemens AG - Key offerings
            • 13.20 Spectris Plc
              • Spectris Plc - Overview
              • Spectris Plc - Product / Service
              • Spectris Plc - Key offerings
            • 13.21 WAGO GmbH and Co. KG
              • WAGO GmbH and Co. KG - Overview
              • WAGO GmbH and Co. KG - Product / Service
              • WAGO GmbH and Co. KG - Key offerings
            • 13.22 Yokogawa Electric
              • Yokogawa Electric - Overview
              • Yokogawa Electric - Product / Service
              • Yokogawa Electric - Key offerings
            • 13.23 ABB Ltd.
              • ABB Ltd. - Overview
              • ABB Ltd. - Product / Service
              • ABB Ltd. - Key offerings
            • 13.24 Advantech Co. Ltd.
              • Advantech Co. Ltd. - Overview
              • Advantech Co. Ltd. - Product / Service
              • Advantech Co. Ltd. - Key offerings
            • 13.25 Arteche Lantegi Elkartea SA
              • Arteche Lantegi Elkartea SA - Overview
              • Arteche Lantegi Elkartea SA - Product / Service
              • Arteche Lantegi Elkartea SA - Key offerings
            • 13.26 Emerson Electric Co.
              • Emerson Electric Co. - Overview
              • Emerson Electric Co. - Product / Service
              • Emerson Electric Co. - Key offerings
            • 13.27 Fanox Electronic SL
              • Fanox Electronic SL - Overview
              • Fanox Electronic SL - Product / Service
              • Fanox Electronic SL - Key offerings
            • 13.28 General Electric Co.
              • General Electric Co. - Overview
              • General Electric Co. - Product / Service
              • General Electric Co. - Key offerings
            • 13.29 Honeywell International Inc.
              • Honeywell International Inc. - Overview
              • Honeywell International Inc. - Product / Service
              • Honeywell International Inc. - Key offerings
            • 13.30 INTECH Process Automation Inc.
              • INTECH Process Automation Inc. - Overview
              • INTECH Process Automation Inc. - Product / Service
              • INTECH Process Automation Inc. - Key offerings
            • 13.31 ISKRA elektro in sistemske resitve d.o.o
              • ISKRA elektro in sistemske resitve d.o.o - Overview
              • ISKRA elektro in sistemske resitve d.o.o - Product / Service
              • ISKRA elektro in sistemske resitve d.o.o - Key offerings
            • 13.32 Midwest Engineered Systems Inc.
              • Midwest Engineered Systems Inc. - Overview
              • Midwest Engineered Systems Inc. - Product / Service
              • Midwest Engineered Systems Inc. - Key offerings
            • 13.33 Motorola Solutions Inc.
              • Motorola Solutions Inc. - Overview
              • Motorola Solutions Inc. - Product / Service
              • Motorola Solutions Inc. - Key offerings
            • 13.34 NR Electric Co. Ltd.
              • NR Electric Co. Ltd. - Overview
              • NR Electric Co. Ltd. - Product / Service
              • NR Electric Co. Ltd. - Key offerings
            • 13.35 Pacemaker Solutions
              • Pacemaker Solutions - Overview
              • Pacemaker Solutions - Product / Service
              • Pacemaker Solutions - Key offerings
            • 13.36 Remsdaq Ltd.
              • Remsdaq Ltd. - Overview
              • Remsdaq Ltd. - Product / Service
              • Remsdaq Ltd. - Key offerings
            • 13.37 Rockwell Automation Inc.
              • Rockwell Automation Inc. - Overview
              • Rockwell Automation Inc. - Product / Service
              • Rockwell Automation Inc. - Key offerings
            • 13.38 Schneider Electric SE
              • Schneider Electric SE - Overview
              • Schneider Electric SE - Product / Service
              • Schneider Electric SE - Key offerings
            • 13.39 Schweitzer Engineering Laboratories Inc.
              • Schweitzer Engineering Laboratories Inc. - Overview
              • Schweitzer Engineering Laboratories Inc. - Product / Service
              • Schweitzer Engineering Laboratories Inc. - Key offerings
            • 13.40 Siemens AG
              • Siemens AG - Overview
              • Siemens AG - Product / Service
              • Siemens AG - Key offerings
            • 13.41 Spectris Plc
              • Spectris Plc - Overview
              • Spectris Plc - Product / Service
              • Spectris Plc - Key offerings
            • 13.42 Yokogawa Electric Corp.
              • Yokogawa Electric Corp. - Overview
              • Yokogawa Electric Corp. - Product / Service
              • Yokogawa Electric Corp. - Key offerings

            14 Appendix

            • 14.1 Scope of the report
              • 14.2 Inclusions and exclusions checklist
                • Inclusions checklist
                • Exclusions checklist
              • 14.3 Currency conversion rates for US$
                • Currency conversion rates for US$
              • 14.4 Research methodology
                • Research methodology
              • 14.5 Data procurement
                • Information sources
              • 14.6 Data validation
                • Data validation
              • 14.7 Validation techniques employed for market sizing
                • Validation techniques employed for market sizing
              • 14.8 Data synthesis
                • Data synthesis
              • 14.9 360 degree market analysis
                • 360 degree market analysis
              • 14.10 List of abbreviations
                • List of abbreviations

              Research Methodology

              Technavio presents a detailed picture of the market by way of study, synthesis, and summation of data from multiple sources. The analysts have presented the various facets of the market with a particular focus on identifying the key industry influencers. The data thus presented is comprehensive, reliable, and the result of extensive research, both primary and secondary.

              INFORMATION SOURCES

              Primary sources

              • Manufacturers and suppliers
              • Channel partners
              • Industry experts
              • Strategic decision makers

              Secondary sources

              • Industry journals and periodicals
              • Government data
              • Financial reports of key industry players
              • Historical data
              • Press releases

              DATA ANALYSIS

              Data Synthesis

              • Collation of data
              • Estimation of key figures
              • Analysis of derived insights

              Data Validation

              • Triangulation with data models
              • Reference against proprietary databases
              • Corroboration with industry experts

              REPORT WRITING

              Qualitative

              • Market drivers
              • Market challenges
              • Market trends
              • Five forces analysis

              Quantitative

              • Market size and forecast
              • Market segmentation
              • Geographical insights
              • Competitive landscape

              Interested in this report?

              Get your sample now to see our research methodology and insights!

              Download Now

              Frequently Asked Questions

              Industrial Remote Terminal Unit (Rtu) market growth will increase by $ 1047.1 mn during 2024-2028 .

              The Industrial Remote Terminal Unit (Rtu) market is expected to grow at a CAGR of 5.62% during 2024-2028 .

              Industrial Remote Terminal Unit (Rtu) market is segmented by End-user( Oil and gas industry, Power generation industry, Chemical and petrochemical industry, Water and wastewater industry, Others) Product( Wireless industrial RTU, Wired industrial RTU, Chemical and petrochemical industry, Water and wastewater industry, Others)

              ABB Ltd., Advantech Co. Ltd., Arteche Lantegi Elkartea SA, Emerson Electric Co., Fanox Electronic SL, General Electric Co., Honeywell International Inc., INTECH Process Automation Inc., Kalki Communication Technologies Pvt. Ltd., Motorola Solutions Inc., Moxa Inc., NR Electric Co. Ltd., Remsdaq Ltd., Rockwell Automation Inc., Schneider Electric SE, Schweitzer Engineering Laboratories Inc., Siemens AG, Spectris Plc, WAGO GmbH and Co. KG, Yokogawa Electric are a few of the key vendors in the Industrial Remote Terminal Unit (Rtu) market.

              APAC will register the highest growth rate of 35% among the other regions. Therefore, the Industrial Remote Terminal Unit (Rtu) market in APAC is expected to garner significant business opportunities for the vendors during the forecast period.

              US, Canada, Germany, UK, Italy, France, China, India, Japan, Brazil, Egypt, UAE, Oman, Argentina, UAE, Brazil, Rest of World (ROW)

              • Increase in sales and revenue with support of e-commerceThe global industrial remote terminal unit (RTU) market has grown significantly with the help of e-commerce. The increase in sales with the help of big e-commerce platforms is the driving factor this market.
              • such as Amazon and Flipkart is the driving factor this market.
              • has provided free entry for end-users from developing economies to choose their products per their global market needs.The improvement in online sales has created an opportunity for manufacturing companies in Europe and North America to enter the Asian market and other developing regions. Apart from vertical sales of industrial remote terminal unit (RTU) is the driving factor this market.
              • sales through e-commerce platforms support the penetration of the regional market players in the global industrial remote terminal unit (RTU) market.The manufacturers of industrial remote terminal unit (RTU) had smooth sales with the support of distributors is the driving factor this market.
              • direct customers is the driving factor this market.
              • and sale points across the world in the second half of 2021. However is the driving factor this market.
              • with growing competition in the global industrial remote terminal market is the driving factor this market.
              • the manufacturers are required to counter-compete with the small as well as big players such as Siemens. The competitive factor has provided a growth momentum to the global industrial remote terminal unit market owing to the support from e-commerce. Hence is the driving factor this market.
              • with the increasing e-commerce is the driving factor this market.
              • the global industrial remote terminal unit (RTU) market is expected to witness positive growth during the forecast period. is the driving factor this market.

              The Industrial Remote Terminal Unit (Rtu) market vendors should focus on grabbing business opportunities from the Oil and gas industry segment as it accounted for the largest market share in the base year.