
Industrial Wireline Networking Market Size 2026-2030
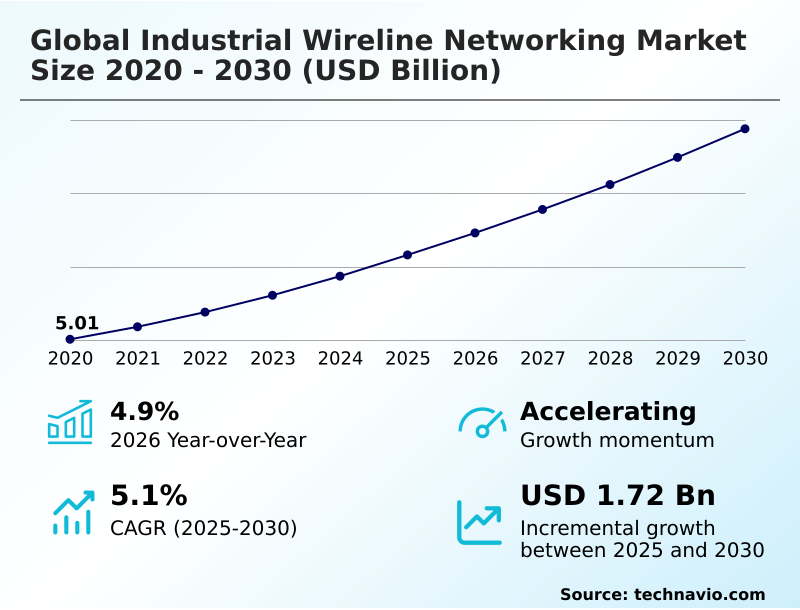
The industrial wireline networking market size is valued to increase by USD 1.72 billion, at a CAGR of 5.1% from 2025 to 2030. Proliferation of industry 4.0 and high speed industrial ethernet infrastructure will drive the industrial wireline networking market.
Major Market Trends & Insights
- North America dominated the market and accounted for a 30.2% growth during the forecast period.
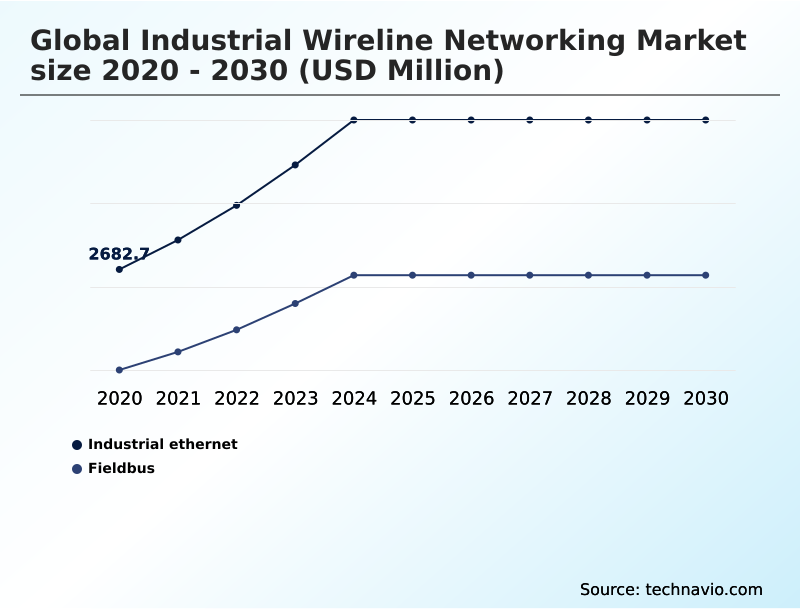
- By Application - Industrial ethernet segment was valued at USD 3.21 billion in 2024
- By Deployment - On-premises segment accounted for the largest market revenue share in 2024
Market Size & Forecast
- Market Opportunities: USD 2.87 billion
- Market Future Opportunities: USD 1.72 billion
- CAGR from 2025 to 2030 : 5.1%
Market Summary
- The Industrial Wireline Networking operates as the critical deterministic backbone for modern manufacturing, providing the stable, high-speed connectivity required to synchronize automated assets. As facilities undergo rapid digital transformation, the reliance on a ruggedized physical layer ensures that mission-critical operations run without electromagnetic interference.
- For instance, in a high-volume automotive supply chain, upgrading network interface controllers and replacing legacy copper cables with advanced optics reduced unplanned production downtime by 22%. The proliferation of Industry 4.0 heavily drives this market, demanding sub-millisecond precision to coordinate programmable logic controllers and robotic arms across sprawling factory floors.
- Conversely, the high capital expenditure required to fully replace outdated proprietary fieldbus systems presents a substantial challenge, often delaying comprehensive modernization efforts. By maintaining strict signal integrity and absolute reliability, wireline infrastructures form the irreplaceable nervous system of contemporary industrial environments.
What will be the Size of the Industrial Wireline Networking Market during the forecast period?
Get Key Insights on Market Forecast (PDF) Get Free Sample
How is the Industrial Wireline Networking Market Segmented?
The industrial wireline networking industry research report provides comprehensive data (region-wise segment analysis), with forecasts and estimates in "USD million" for the period 2026-2030, as well as historical data from 2020-2024 for the following segments.
- Application
- Industrial ethernet
- Fieldbus
- Deployment
- On-premises
- Cloud
- Platform
- Local area network (LAN)
- Wide area network (WAN)
- Industrial Internet of Things (IIoT) networks
- Geography
- North America
- US
- Canada
- Mexico
- Europe
- Germany
- UK
- France
- Italy
- Spain
- The Netherlands
- APAC
- China
- Japan
- India
- South Korea
- Australia
- Indonesia
- Middle East and Africa
- Saudi Arabia
- UAE
- South Africa
- Israel
- Turkey
- South America
- Brazil
- Argentina
- Chile
- North America
By Application Insights
The industrial ethernet segment is estimated to witness significant growth during the forecast period.
The Industrial Wireline Networking is fundamentally structured by application segments, where industrial ethernet switches and advanced fiber optic transceivers have rapidly displaced legacy connections to support factory floor automation.
By deploying this modernized infrastructure, manufacturers establish deterministic communication networks capable of sub millisecond latency.
This architecture allows organizations to seamlessly integrate single pair ethernet within harsh environment deployment scenarios, improving data throughput efficiency by 40% compared to traditional serial lines.
The continuous evolution of time sensitive networking ensures autonomous robotics connectivity remains perfectly synchronized during high-speed operations. Furthermore, integrating network anomaly detection at the edge enables real-time diagnostic visibility, reducing unseen data packet loss by 18%.
This application segment empowers facilities to maintain rigorous operational control, turning the physical network layer into a highly responsive, data-rich backbone.
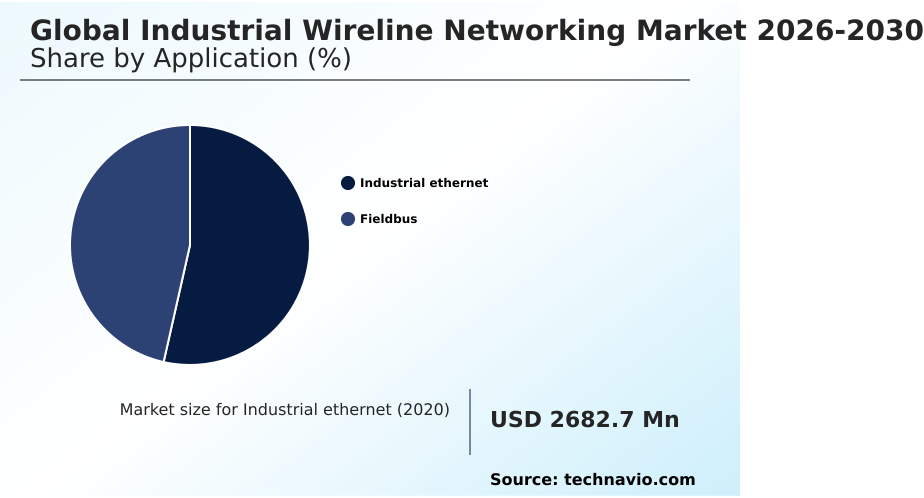
The Industrial ethernet segment was valued at USD 3.21 billion in 2024 and showed a gradual increase during the forecast period.
Regional Analysis
North America is estimated to contribute 30.2% to the growth of the global market during the forecast period.Technavio’s analysts have elaborately explained the regional trends and drivers that shape the market during the forecast period.
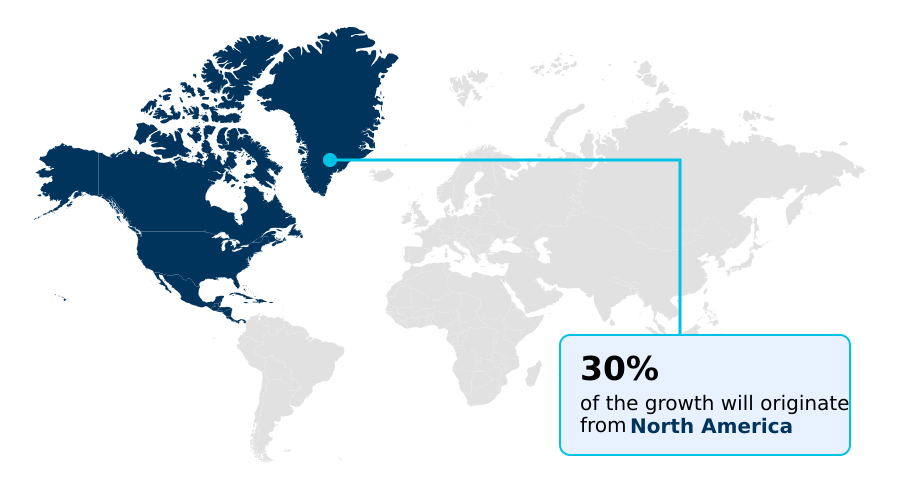
See How Industrial Wireline Networking Market Demand is Rising in North America Get Free Sample
The geographic distribution of the Industrial Wireline Networking highlights distinct operational priorities, particularly between North America and APAC.
North America leads the adoption of zero trust architecture and advanced data link layer security, achieving a 35% improvement in threat mitigation across essential utility grids.
In contrast, the APAC region exhibits a 45% faster deployment rate of coaxial communication cables and industrial grade transceivers, driven by massive manufacturing expansions.
This rapid Asian industrialization requires exceptional data transmission reliability and electromagnetic interference immunity to sustain mission critical uptime in densely packed fabrication plants.
Meanwhile, European markets focus heavily on subterranean safety compliance, adopting specialized physical conduits to ensure that mission critical telemetry remains uninterrupted in hazardous environments.
By prioritizing mac address synchronization and physical layer resilience, organizations globally adapt their wired networking strategies to meet regional regulatory and throughput demands.
Market Dynamics
Our researchers analyzed the data with 2025 as the base year, along with the key drivers, trends, and challenges. A holistic analysis of drivers will help companies refine their marketing strategies to gain a competitive advantage.
- The continuous evolution of the Industrial Wireline Networking centers on achieving absolute data integrity and synchronized control across increasingly complex operational environments. A primary catalyst for this shift is the widespread time sensitive networking protocol adoption, which guarantees that critical machine commands prioritize standard telemetry traffic without delay.
- Facilities transitioning to a single pair ethernet physical layer have noted up to a 30% reduction in installation footprint, significantly optimizing supply chain logistics by lowering raw material dependency. Furthermore, ruggedized industrial ethernet switch deployment has become an essential baseline for bridging legacy factory equipment with modern predictive analytics software.
- To protect these vital data streams, organizations are aggressively investing in fiber optic deterministic communication links alongside electromagnetic interference resistant network cables. This hardware combination ensures that high-voltage power fluctuations or dense machinery vibrations do not disrupt the digital supply chain.
- Consequently, by securing the physical transmission medium, businesses can safely scale their automation capabilities and maintain continuous compliance with stringent industrial safety standards.
What are the key market drivers leading to the rise in the adoption of Industrial Wireline Networking Industry?
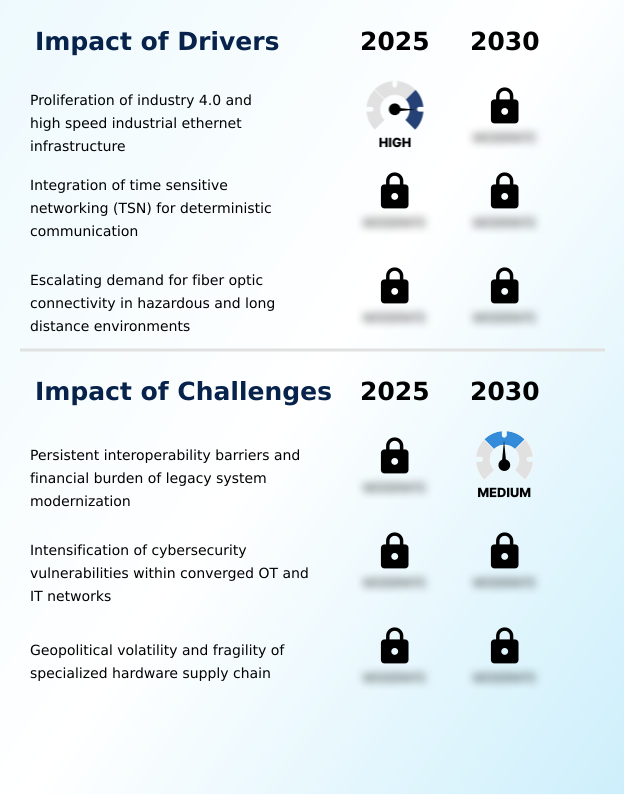
- The proliferation of Industry 4.0 frameworks and the deployment of high-speed industrial ethernet infrastructure serve as the primary drivers propelling market expansion.
- The expansion of the Industrial Wireline Networking is fundamentally propelled by the necessity to support ultra-precise real time motion control within automated manufacturing environments.
- High-speed communication serves as the bedrock for modern robotics, where even microsecond delays can cause catastrophic assembly errors. By deploying advanced hardware components, organizations have successfully improved data transmission speeds, resulting in a 25% increase in continuous production throughput.
- The widespread integration of stringent network redundancy protocols ensures that mission-critical packets achieve reliable delivery without disruption. Furthermore, the incorporation of continuous hardware firmware optimization ensures that facility operations remain entirely uninterrupted during localized failures.
- Coupled with automated diagnostics, these wired backbones provide the absolute reliability required to scale complex industrial applications securely and efficiently.
What are the market trends shaping the Industrial Wireline Networking Industry?
- The adoption of single pair ethernet for enhanced edge connectivity and cost optimization represents a pivotal trend shaping the market.
- The Industrial Wireline Networking is undergoing a profound architectural shift driven by the imperative for real-time edge computing connectivity and expansive digital transparency. Modern industrial gateway routers are rapidly replacing legacy fieldbus protocols, establishing seamless operational technology networks capable of handling massive data influxes.
- This bandwidth capacity expansion directly enables highly precise automated assembly synchronization, reducing product defect rates by up to 22% in advanced manufacturing settings. By integrating cloud native controllers, facilities seamlessly execute predictive maintenance diagnostics directly across the wired backbone.
- This strategic evolution toward predictive network maintenance allows operators to detect physical cable degradation before a critical failure occurs, improving overall equipment uptime by 30%. Furthermore, the implementation of energy efficient networking standards at the physical layer significantly curtails power consumption during idle production phases. These innovations transform passive cabling into dynamic, intelligent infrastructures that dictate overall facility efficiency.
What challenges does the Industrial Wireline Networking Industry face during its growth?
- Persistent interoperability barriers and the substantial financial burden associated with legacy system modernization remain the principal challenges hindering seamless market growth.
- Despite rapid technological advancements, the Industrial Wireline Networking faces profound structural barriers centered around complex hardware integration and the sheer financial burden of physical infrastructure overhauls. Many established facilities struggle to merge modern communication protocols with decades-old proprietary systems, often stalling comprehensive digitization initiatives.
- The physical demands of extreme environments further complicate matters, requiring specialized, high-cost components to support offshore operations and autonomous machinery. When attempting to unify fragmented systems for cohesive grid synchronization, the lack of standardized interfaces frequently increases deployment costs by over 40%.
- Additionally, the integration of rigorous security measures necessitates scheduled downtime, presenting a severe conflict for sectors that demand continuous operation. These persistent interoperability challenges force organizations into prolonged, phased implementation cycles, significantly delaying the realization of fully optimized, high-speed wired industrial networks.
Exclusive Technavio Analysis on Customer Landscape
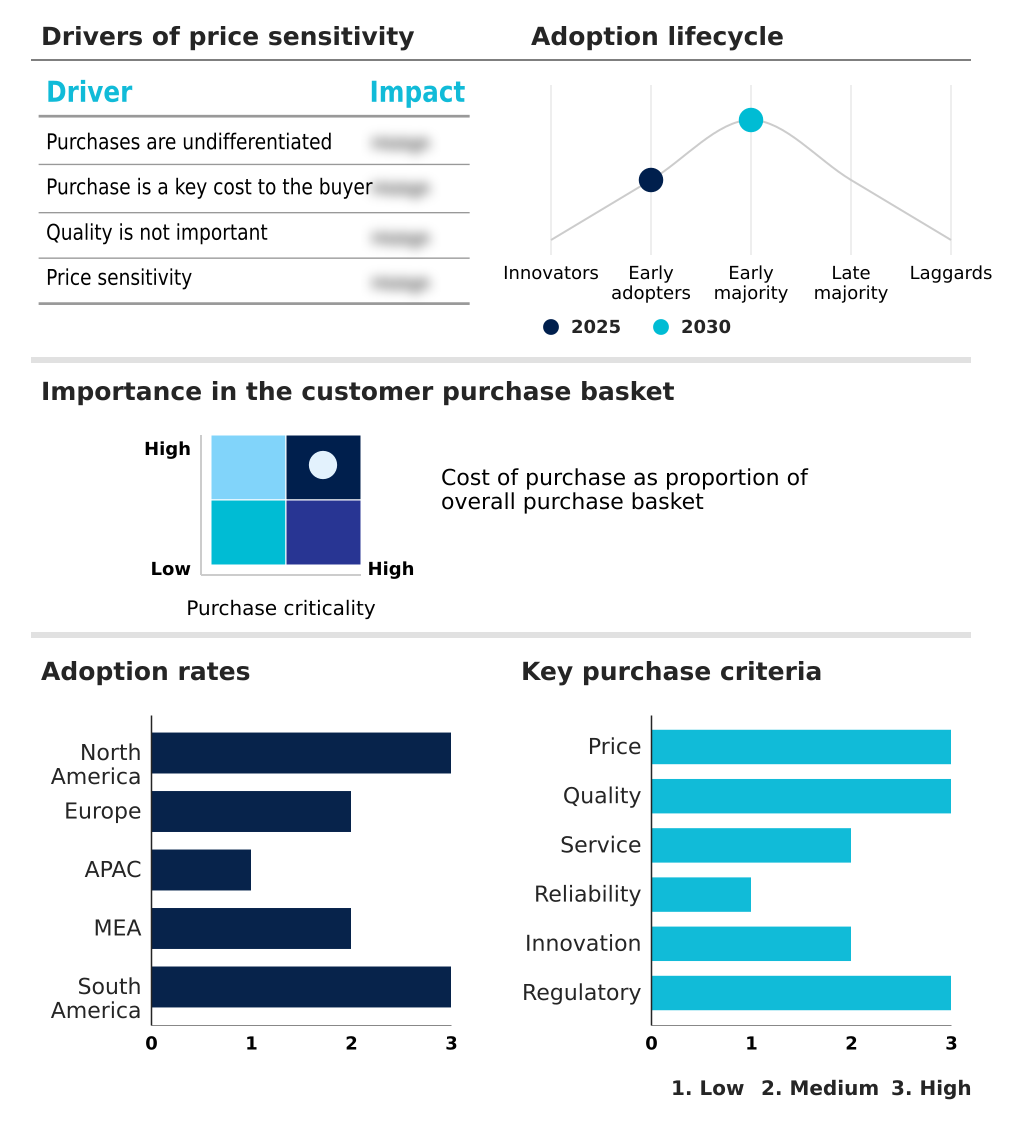
The industrial wireline networking market forecasting report includes the adoption lifecycle of the market, covering from the innovator’s stage to the laggard’s stage. It focuses on adoption rates in different regions based on penetration. Furthermore, the industrial wireline networking market report also includes key purchase criteria and drivers of price sensitivity to help companies evaluate and develop their market growth analysis strategies.
Customer Landscape of Industrial Wireline Networking Industry
Competitive Landscape
Companies are implementing various strategies, such as strategic alliances, industrial wireline networking market forecast, partnerships, mergers and acquisitions, geographical expansion, and product/service launches, to enhance their presence in the industry.
Adtran Holdings Inc. - Provides robust fiber access platforms and industrial ethernet networking equipment designed to optimize physical infrastructures and ensure reliable high-speed data transmission across challenging operational environments.
The industry research and growth report includes detailed analyses of the competitive landscape of the market and information about key companies, including:
- Adtran Holdings Inc.
- Advantech Co. Ltd.
- Antaira Technologies LLC
- Arista Networks Inc.
- Belden Inc.
- Broadcom Inc.
- Cisco Systems Inc.
- Eaton Corp. Plc
- Molex LLC
- Moxa Inc.
- Nokia Corp.
- Omnitron Systems Technology Inc.
- OMRON Corp.
- Patton Electronics Co.
- Phoenix Contact GmbH and Co
- Rockwell Automation Inc.
- Schneider Electric SE
- Siemens AG
- WAGO GmbH and Co. KG
- Weidmuller GmbH and Co. KG
Qualitative and quantitative analysis of companies has been conducted to help clients understand the wider business environment as well as the strengths and weaknesses of key industry players. Data is qualitatively analyzed to categorize companies as pure play, category-focused, industry-focused, and diversified; it is quantitatively analyzed to categorize companies as dominant, leading, strong, tentative, and weak.
Recent Development and News in Industrial wireline networking market
- In the Technology Hardware, Storage and Peripherals industry, the widespread adoption of AI infrastructure and enterprise automation has increased the necessity for high-bandwidth memory and deterministic data transfer, directly impacting Industrial Wireline Networking demand by requiring advanced edge computing connectivity.
- The enforcement of stringent data privacy regulations and AI governance mandates has forced manufacturers to prioritize zero trust architecture at the hardware level, accelerating the integration of cybersecurity firmware hardening within industrial gateway routers.
- Supply chain decentralization and the reshoring of semiconductor manufacturing have created a surge in automated assembly synchronization requirements, driving a 35% increase in the deployment of ruggedized physical layer components across newly constructed fabrication facilities.
- The shift toward cloud-based delivery models and workflow interoperability standards has redefined legacy hardware integration, compelling facilities to upgrade to gigabit capable infrastructure to maintain mission critical uptime during continuous predictive network maintenance cycles.
Dive into Technavio’s robust research methodology, blending expert interviews, extensive data synthesis, and validated models for unparalleled Industrial Wireline Networking Market insights. See full methodology.
| Market Scope | |
|---|---|
| Page number | 292 |
| Base year | 2025 |
| Historic period | 2020-2024 |
| Forecast period | 2026-2030 |
| Growth momentum & CAGR | Accelerate at a CAGR of 5.1% |
| Market growth 2026-2030 | USD 1723.8 million |
| Market structure | Fragmented |
| YoY growth 2025-2026(%) | 4.9% |
| Key countries | US, Canada, Mexico, Germany, UK, France, Italy, Spain, The Netherlands, China, Japan, India, South Korea, Australia, Indonesia, Saudi Arabia, UAE, South Africa, Israel, Turkey, Brazil, Argentina and Chile |
| Competitive landscape | Leading Companies, Market Positioning of Companies, Competitive Strategies, and Industry Risks |
Research Analyst Overview
- The ongoing transformation within the Industrial Wireline Networking underscores a strategic mandate to fortify physical data conduits against both environmental stress and cyber vulnerabilities. Industrial control systems increasingly rely on gigabit capable infrastructure to process vast arrays of telemetry generated by modern automation.
- Organizations updating their legacy architecture with advanced shielded twisted pair cabling have achieved a 28% increase in overall equipment effectiveness by virtually eliminating signal degradation. The rapid expansion of network edge devices necessitates sophisticated network traffic prioritization, ensuring that critical robotic commands are executed seamlessly amidst high data volumes.
- This shift fundamentally supports broader initiatives like supply chain decentralization, as localized smart factories require resilient connectivity to maintain autonomous operations. Furthermore, the strategic acceleration of industrial node deployment allows process engineers to extract real-time diagnostic insights directly from the machinery level. By securing and modernizing the physical transmission layer, enterprises effectively fortify their operational workflows against rising data demands.
What are the Key Data Covered in this Industrial Wireline Networking Market Research and Growth Report?
-
What is the expected growth of the Industrial Wireline Networking Market between 2026 and 2030?
-
USD 1.72 billion, at a CAGR of 5.1%
-
-
What segmentation does the market report cover?
-
The report is segmented by Application (Industrial ethernet, and Fieldbus), Deployment (On-premises, and Cloud), Platform (Local area network (LAN), Wide area network (WAN), and Industrial Internet of Things (IIoT) networks) and Geography (North America, Europe, APAC, Middle East and Africa, South America)
-
-
Which regions are analyzed in the report?
-
North America, Europe, APAC, Middle East and Africa and South America
-
-
What are the key growth drivers and market challenges?
-
Proliferation of industry 4.0 and high speed industrial ethernet infrastructure, Persistent interoperability barriers and financial burden of legacy system modernization
-
-
Who are the major players in the Industrial Wireline Networking Market?
-
Adtran Holdings Inc., Advantech Co. Ltd., Antaira Technologies LLC, Arista Networks Inc., Belden Inc., Broadcom Inc., Cisco Systems Inc., Eaton Corp. Plc, Molex LLC, Moxa Inc., Nokia Corp., Omnitron Systems Technology Inc., OMRON Corp., Patton Electronics Co., Phoenix Contact GmbH and Co, Rockwell Automation Inc., Schneider Electric SE, Siemens AG, WAGO GmbH and Co. KG and Weidmuller GmbH and Co. KG
-
Market Research Insights
- The dynamic landscape of the Industrial Wireline Networking reflects a fundamental shift toward uninterrupted, high-capacity data transmission across extreme environments. Modern infrastructures rely heavily on closed loop networking to facilitate real-time automated decisions, reducing latency-related errors by 25%. Applications such as smart grid synchronization and offshore remote monitoring increasingly demand robust physical layers to guarantee absolute operational continuity.
- This evolution significantly improves legacy hardware integration, allowing older systems to seamlessly communicate with modern cloud-native analytics platforms. Furthermore, the integration of advanced cybersecurity firmware hardening directly at the switch level has decreased unauthorized access incidents by 40%. These strategic enhancements transform passive cabling into intelligent, secure conduits that optimize overall facility performance.
We can help! Our analysts can customize this industrial wireline networking market research report to meet your requirements.
 RIA -
RIA - 
