
Intranet Software Market Size 2025-2029
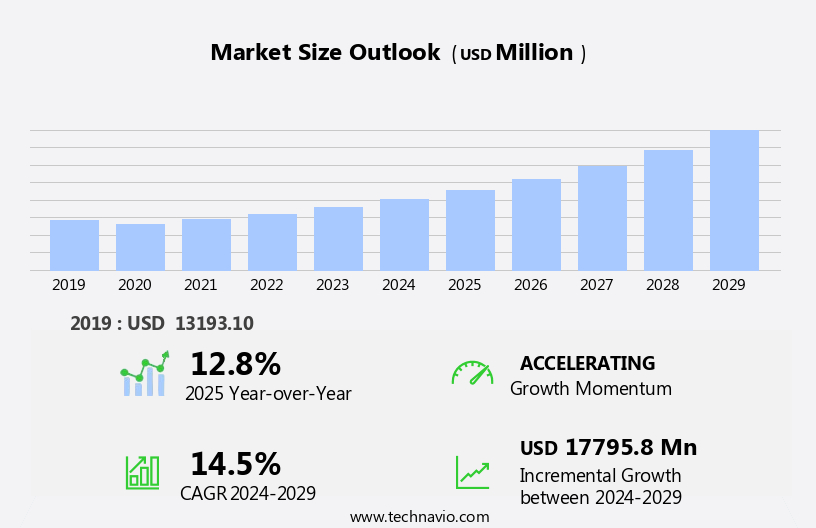
The intranet software market size is forecast to increase by USD 17.8 billion at a CAGR of 14.5% between 2024 and 2029.
- The market is experiencing significant growth, driven by the increasing adoption of cloud computing services and the implementation of bring your device (BYOD) policies in organizations. Cloud-based intranet solutions offer cost savings, flexibility, and scalability, making them an attractive option for businesses of all sizes. However, this shift towards cloud services also presents new challenges, particularly in the area of data privacy and security. As more sensitive information moves to the cloud, ensuring its protection becomes paramount. Another trend shaping the market is the integration of advanced features such as artificial intelligence and machine learning to enhance productivity and user experience. Cloud-based intranet software, while offering cost savings and flexibility, faces challenges in terms of data security and cyber threats.
- This is particularly relevant in large enterprises, where intranets serve as essential tools for managing complex workflows and streamlining internal communications. Despite these opportunities, market growth is not without challenges. Companies must navigate evolving regulatory requirements and keep up with the latest security threats to maintain customer trust and loyalty. Companies seeking to capitalize on market opportunities and navigate challenges effectively should focus on providing security features, seamless integration with other business applications, and user-friendly interfaces.
What will be the Size of the Intranet Software Market during the forecast period?
- The market is experiencing significant growth as businesses increasingly prioritize remote work solutions and digital workplace initiatives. This market encompasses a range of offerings, including internal resources, data recovery, cloud migration, employee engagement, business continuity, compliance management, access control, secure file sharing, team collaboration, and more. Key trends include the adoption of hybrid cloud solutions, network security, user authentication, performance optimization, and identity management. Digital transformation is a primary driver, with businesses seeking to enhance business agility, knowledge management, data governance, and employee productivity.
- Additionally, there is a focus on cost optimization through the implementation of security policies, communication channels, user experience, content management, and knowledge sharing platforms. Overall, the market is a dynamic and evolving landscape, with continued innovation in areas such as data backup, document sharing, IT infrastructure management, digital signage, enterprise social networking, employee onboarding software, learning management systems, and business process automation.
How is this Intranet Software Industry segmented?
The intranet software industry research report provides comprehensive data (region-wise segment analysis), with forecasts and estimates in "USD million" for the period 2025-2029, as well as historical data from 2019-2023 for the following segments.
- Deployment
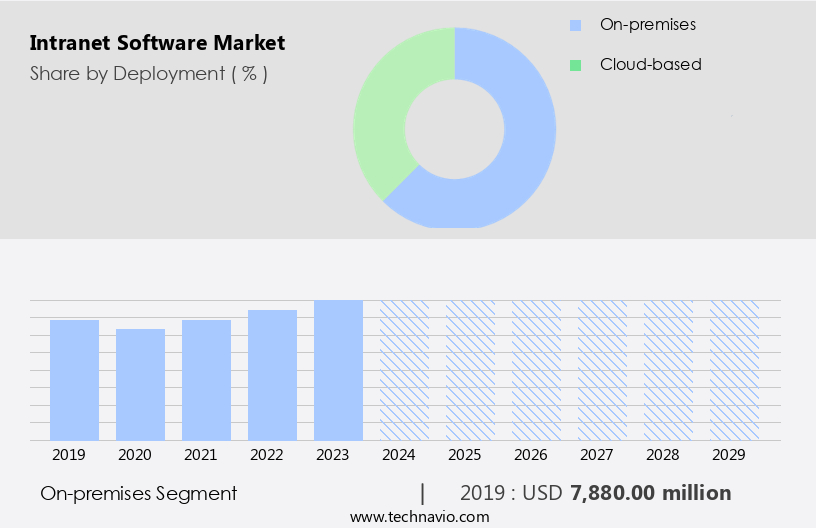
- On-premises
- Cloud-based
- Application
- BFSI
- Telecom
- Retail and e-commerce
- Others
- Organization Size
- Small and Medium Enterprises (SMEs)
- Large Enterprises
- By Type
- Communication
- Collaboration
- Document Management
- Device Type
- Desktop
- Mobile
- Geography
- North America
- US
- Canada
- Europe
- France
- Germany
- Italy
- The Netherlands
- UK
- APAC
- China
- India
- Japan
- Middle East and Africa
- South America
- North America
By Deployment Insights
The on-premises segment is estimated to witness significant growth during the forecast period. The market is experiencing steady growth, driven by the demand for centralized communication, document management, collaboration tools, and knowledge management solutions among large enterprises. On-premises intranet software continues to dominate the market due to its end-to-end quality control and enhanced security features, making it a preferred choice for data-intensive industries such as BFSI and telecom. These sectors deal with sensitive data and are subject to stringent regulations, necessitating high-security services.
The market is expected to witness significant advancements in areas such as machine learning, artificial intelligence, and remote work solutions. Companies are also investing in cloud-based security solutions and hybrid work models to enhance collaboration, employee productivity, and operational efficiency.
Get a glance at the market report of share of various segments Request Free Sample
The On-premises segment was valued at USD 7.88 billion in 2019 and showed a gradual increase during the forecast period.
Regional Analysis
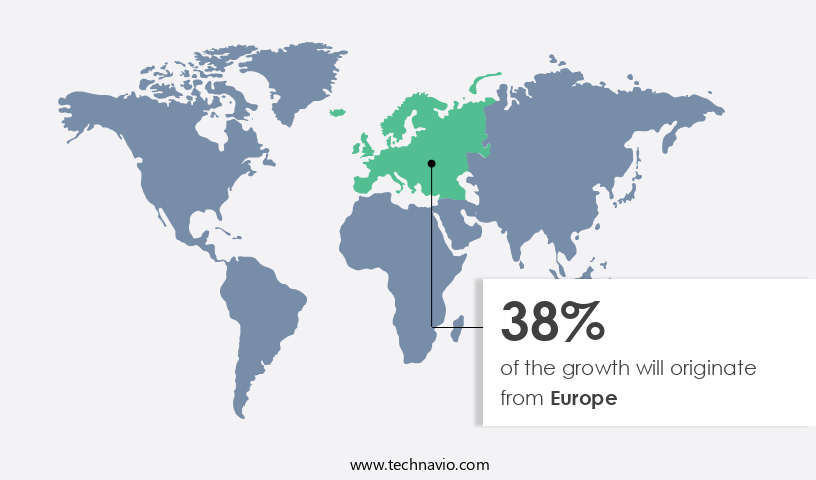
Europe is estimated to contribute 38% to the growth of the global market during the forecast period. Technavio's analysts have elaborately explained the regional trends and drivers that shape the market during the forecast period.
For more insights on the market size of various regions, Request Free Sample
The market in North America is projected to experience notable expansion during the forecast period. Key contributors to this growth include the BFSI, retail and e-commerce, telecom, and healthcare industries, which are undergoing significant technological advancements and digital transformation initiatives in the region. The presence of prominent companies, such as Microsoft, Speakap, Easysite, DevFacto, and Withum Smith Brown, is driving market growth. Intranet software is increasingly being adopted to facilitate centralized communication, document management, collaboration tools, and knowledge management within organizations. Cloud-based solutions, including cloud storage and cloud-based communication, are gaining popularity due to their flexibility, cost savings, and enhanced security features.
Additionally, the skilled workforce in North America is embracing new technologies, such as artificial intelligence and machine learning, to streamline business operations and improve operational efficiency. The market caters to various sectors, including IT and telecom, manufacturing, and the public sector, providing a single focal point for internal communication, employee engagement, and productivity tools.
Market Dynamics
Our researchers analyzed the data with 2024 as the base year, along with the key drivers, trends, and challenges. A holistic analysis of drivers will help companies refine their marketing strategies to gain a competitive advantage.
What are the key market drivers leading to the rise in the adoption of the Intranet Software Industry?
- Rising adoption of cloud computing services is the key driver of the market. The global market for Intranet software is experiencing growth as more businesses, both small and large, shift towards cloud solutions to minimize capital expenditure (CAPEX). Cloud platforms enable organizations to access hardware and resources on demand, reducing the need for costly data center infrastructure. This trend is particularly beneficial for small and medium-sized enterprises (SMEs), which can significantly lower their capital costs by moving to the cloud.
- Cloud service providers offer servers, storage space, and hardware, allowing businesses to pay only for the services they use instead of bearing the expense of data center setup. Consequently, the adoption of cloud platforms is becoming increasingly popular as a cost-effective alternative to traditional data center solutions. The IT and telecom industry and the BFSI sector are among the leading adopters of intranet software, recognizing its potential to improve operational efficiency, enhance employee engagement, and provide a competitive edge. The adoption of cloud-based intranet software has been particularly notable, as it offers cost savings, ease of deployment, and scalability. The market is experiencing strong growth, driven by the increasing demand for efficient internal communication and collaboration tools. The integration of cloud-based services, advanced security features, and new technologies is transforming the way businesses manage their operations and engage their workforce.
What are the market trends shaping the Intranet Software Industry?
- Increased adoption of bring your own device (BYOD) policy is the upcoming market trend. The Bring Your Own Device (BYOD) trend in enterprise mobility is gaining traction as employees increasingly prefer using their smartphones, tablets, and laptops for work. This shift necessitates specific management and IT service delivery frameworks to ensure secure and productive work environments.
- Companies are focusing on providing the appropriate mobile devices to their employees, leading to an increase in the diversity of operating systems and devices such as iOS, Android, Windows, smartphones, and tablets accessing secure computer networks. The adoption of BYOD is a prominent trend among global enterprises, driven by the desire to enhance employee productivity and satisfaction. The Intranet Software Market is evolving at an unprecedented pace, transforming the way businesses manage internal operations. This dynamic landscape encompasses a broad range of solutions designed to enhance 'information sharing', 'disaster recovery', and 'employee wellbeing'. Digital workplace solutions, including 'employee training platforms' and 'learning management systems', are at the forefront of this transformation. These platforms facilitate 'knowledge sharing' and 'employee training' through 'virtual reality training' and 'interactive whiteboards'.
What challenges does the Intranet Software Industry face during its growth?
- Data privacy and security risk in cloud-based services is a key challenge affecting the industry's growth. Cloud-based intranet software adoption in organizations faces significant challenges due to data privacy and security concerns. The protection of online data in a cloud environment is a complex task for businesses. Cloud infrastructure relies on various open-source codes, which can introduce vulnerabilities to cloud systems. Public clouds, in particular, are more susceptible due to their multi-tenant nature and the potential impact on multiple applications running in the cloud environment.
- Cyber-attackers can easily penetrate cloud-based data storage systems, putting the personal information of clients or customers at risk. The open architecture and shared resources of cloud infrastructure further complicate matters. Organizations must address these challenges to fully leverage the benefits of cloud-based intranet software. Moreover, 'employee recognition platforms' and 'internal communication platforms' foster a connected and engaged workforce, while 'employee portals' serve as a central hub for 'document management' and 'workflow automation'. Cloud-based 'intranet software' and 'team collaboration tools' enable 'hybrid work' and 'remote work' arrangements, ensuring business continuity in the face of disruptions. 'Knowledge base software' and 'content management systems' further streamline information access, ensuring that critical data is readily available. In summary, the Intranet Software Market offers an array of innovative solutions, from 'disaster recovery' and 'information sharing' to 'employee training' and 'team collaboration', empowering businesses to adapt, innovate, and thrive in today's dynamic work environment.
Exclusive Customer Landscape
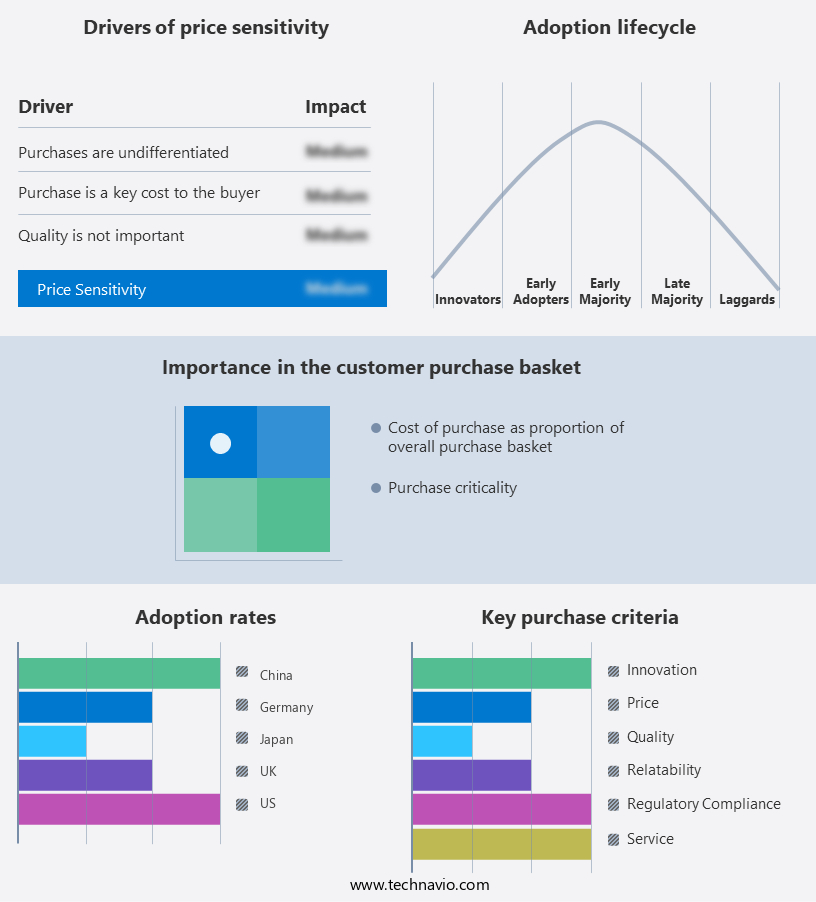
The intranet software market forecasting report includes the adoption lifecycle of the market, covering from the innovator's stage to the laggard's stage. It focuses on adoption rates in different regions based on penetration. Furthermore, the intranet software market report also includes key purchase criteria and drivers of price sensitivity to help companies evaluate and develop their market growth analysis strategies.
Customer Landscape
Key Companies & Market Insights
Companies are implementing various strategies, such as strategic alliances, intranet software market forecast, partnerships, mergers and acquisitions, geographical expansion, and product/service launches, to enhance their presence in the industry.
Akumina Inc. -The company offers intranet software such as Akumina Intranet.
The industry research and growth report includes detailed analyses of the competitive landscape of the market and information about key companies, including:
- Akumina Inc.
- Aurea Inc.
- Collab Hub
- Contentformula
- Creative Social Intranet
- DevFacto FZ LLC
- Easysite
- eXo Platform SAS
- HyperOffice
- Involv
- Microsoft Corp.
- Powell Software
- Speakap Inc.
- The Attollo Group Ltd.
- Withum Smith and Brown PC
Qualitative and quantitative analysis of companies has been conducted to help clients understand the wider business environment as well as the strengths and weaknesses of key industry players. Data is qualitatively analyzed to categorize companies as pure play, category-focused, industry-focused, and diversified; it is quantitatively analyzed to categorize companies as dominant, leading, strong, tentative, and weak.
Research Analyst Overview
The market continues to experience significant growth as businesses seek to enhance their internal communication and collaboration capabilities. This trend is driven by the increasing need for a skilled workforce to remain competitive in today's business landscape. Intranet software functions as an internal hub for companies, providing centralized communication, document management, and collaboration tools. Enterprise intranet solutions enable multinational IT companies and entertainment firms to streamline business operations by facilitating efficient communication and knowledge sharing among employees. These systems serve as a single focal point for company announcements, project management, and task management. Social features, such as chat rooms and activity feeds, foster enhanced collaboration and recognition systems help boost employee engagement.
Cloud-based communication and cloud storage solutions have become essential components of intranet software, offering secure access to important announcements and company knowledge from anywhere, at any time. The adoption of cloud-based services has led to increased operational efficiency, enabling remote work and hybrid work models. Data security remains a critical concern for businesses, with cyber threats posing a significant risk to business operations. Cloud-based security solutions have emerged as an effective response, offering advanced security features to protect sensitive information. The integration of artificial intelligence and machine learning into intranet software has further expanded its capabilities, allowing for personalized content, predictive analytics, and automation of workflows.
In addition, the use of interactive tools and communication features has enhanced employee productivity and engagement. The market is witnessing the emergence of new technologies, such as IoT solutions, customer engagement platforms, and data analytics tools. These advancements are transforming the way businesses manage their enterprise networks and supply chain management processes.
|
Market Scope |
|
|
Report Coverage |
Details |
|
Page number |
188 |
|
Base year |
2024 |
|
Historic period |
2019-2023 |
|
Forecast period |
2025-2029 |
|
Growth momentum & CAGR |
Accelerate at a CAGR of 14.5% |
|
Market growth 2025-2029 |
USD 17.79 billion |
|
Market structure |
Fragmented |
|
YoY growth 2024-2025(%) |
12.8 |
|
Key countries |
US, Canada, Germany, China, France, Italy, The Netherlands, UK, Japan, and India |
|
Competitive landscape |
Leading Companies, Market Positioning of Companies, Competitive Strategies, and Industry Risks |
What are the Key Data Covered in this Intranet Software Market Research and Growth Report?
- CAGR of the Intranet Software industry during the forecast period
- Detailed information on factors that will drive the growth and forecasting between 2025 and 2029
- Precise estimation of the size of the market and its contribution of the industry in focus to the parent market
- Accurate predictions about upcoming growth and trends and changes in consumer behaviour
- Growth of the market across North America, Europe, APAC, Middle East and Africa, and South America
- Thorough analysis of the market's competitive landscape and detailed information about companies
- Comprehensive analysis of factors that will challenge the intranet software market growth and forecasting
We can help! Our analysts can customize this intranet software market research report to meet your requirements.
 RIA -
RIA - 
