Iot Managed Services Market Analysis, Size, and Forecast 2026-2030: North America (US, Canada, and Mexico), Europe (Germany, UK, and France), APAC (China, Japan, and India), Middle East and Africa (Saudi Arabia, UAE, and South Africa), South America (Brazil and Argentina), and Rest of World (ROW)

Iot Managed Services Market Analysis, Size, and Forecast 2026-2030:
North America (US, Canada, and Mexico), Europe (Germany, UK, and France), APAC (China, Japan, and India), Middle East and Africa (Saudi Arabia, UAE, and South Africa), South America (Brazil and Argentina), and Rest of World (ROW)

Published: Apr 2026 332 Pages SKU: IRTNTR71514

Market Overview at a Glance

$733.72 B
Market Opportunity
34.1%
CAGR 2025 - 2030
32.9%
APAC Growth
$53.04 B
Network management services segment 2024

Iot Managed Services Market Size 2026-2030

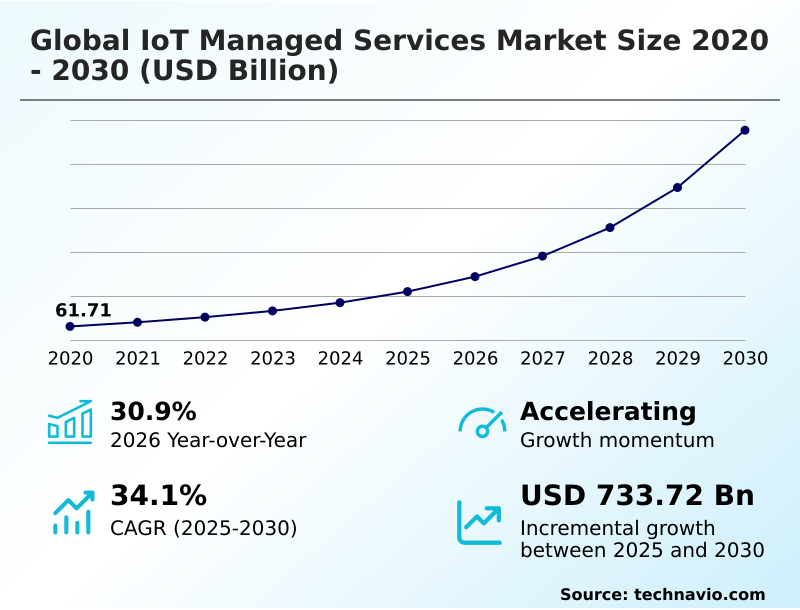
The iot managed services market size is valued to increase by USD 733.72 billion, at a CAGR of 34.1% from 2025 to 2030. Institutionalization of security by design and regulatory compliance frameworks will drive the iot managed services market.

Major Market Trends & Insights

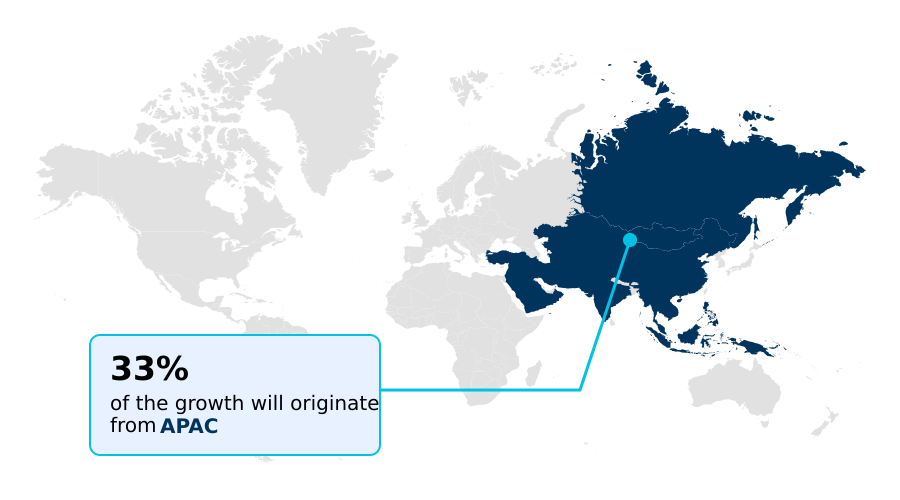
  • APAC dominated the market and accounted for a 32.9% growth during the forecast period.
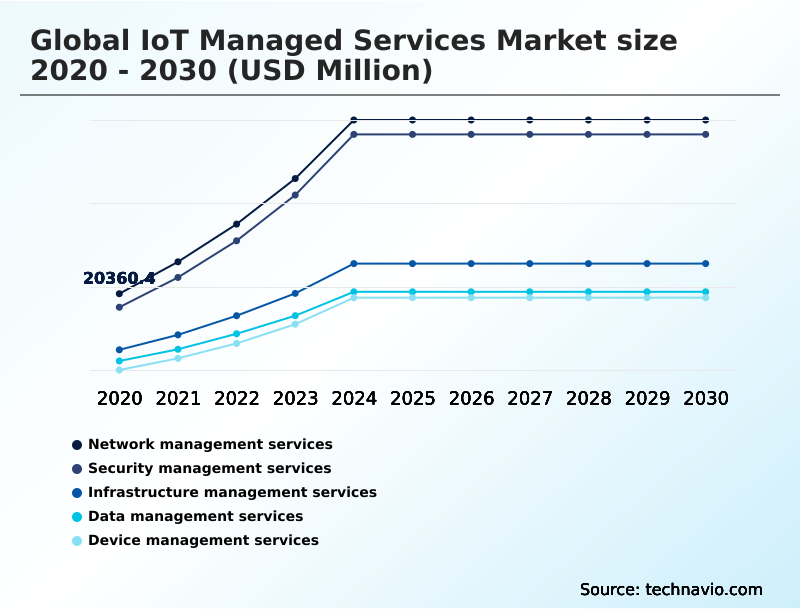
  • By Type - Network management services segment was valued at USD 53.04 billion in 2024
  • By Deployment - On-premises segment accounted for the largest market revenue share in 2024

Market Size & Forecast

  • Market Opportunities: USD 892.02 billion
  • Market Future Opportunities: USD 733.72 billion
  • CAGR from 2025 to 2030 : 34.1%

Market Summary

  • The IoT managed services market is undergoing a significant transformation, driven by the convergence of hyper-connectivity, edge intelligence, and the industrialization of AI. This evolution is supported by a structural shift from basic device monitoring toward delivering complex, outcome-based service models that prioritize operational resilience and data-driven decision-making.
  • As organizations scale their connected ecosystems, the complexity of managing heterogeneous networks and massive telemetry streams has created a reliance on expert providers. In a typical smart factory scenario, a managed service ensures thousands of sensors on a production line communicate seamlessly, leveraging predictive analytics to forecast equipment failures before they occur.
  • This allows the enterprise to focus on core competencies while mitigating risks associated with system downtime. A primary driver is the rise of private 5G and edge computing, enabling critical data processing at the source. This is compounded by the integration of agentic AI, which automates network troubleshooting and optimizes bandwidth in real-time.
  • Challenges such as device interoperability and a shortage of skilled technical talent persist, but the value proposition of outsourcing complex management functions continues to fuel market expansion as businesses seek to harness the full potential of their digital assets.

What will be the Size of the Iot Managed Services Market during the forecast period?

Get Key Insights on Market Forecast (PDF) Request Free Sample

How is the Iot Managed Services Market Segmented?

The iot managed services industry research report provides comprehensive data (region-wise segment analysis), with forecasts and estimates in "USD million" for the period 2026-2030, as well as historical data from 2020-2024 for the following segments.

  • Type
    • Network management services
    • Security management services
    • Infrastructure management services
    • Data management services
    • Device management services
  • Deployment
    • On-premises
    • Cloud
  • Sector
    • SMEs
    • Large enterprises
  • End-user
    • Healthcare
    • Manufacturing
    • Retail
    • BFSI
    • Others
  • Geography
    • North America
      • US
      • Canada
      • Mexico
    • Europe
      • Germany
      • UK
      • France
    • APAC
      • China
      • Japan
      • India
    • Middle East and Africa
      • Saudi Arabia
      • UAE
      • South Africa
    • South America
      • Brazil
      • Argentina
    • Rest of World (ROW)

By Type Insights

The network management services segment is estimated to witness significant growth during the forecast period.

The segment for network management services is fundamental, ensuring the uninterrupted communication of sensors and gateways. Providers use software-defined networking for dynamic network traffic pattern analysis and to manage hybrid connectivity across cellular, satellite, and LPWANs.

These services are evolving beyond uptime to include sophisticated edge-to-cloud orchestration, which optimizes data pathways for efficiency and cost.

By utilizing cloud-native connectivity solutions, providers deliver single-pane-of-glass solutions that centralize oversight, enabling predictive network maintenance that can improve issue resolution by over 40%.

This shift toward proactive management of low-latency connectivity is critical for applications in managed fleet and logistics and other sectors where real-time telemetry is non-negotiable, all increasingly offered through flexible consumption-based pricing models.

Request Free Sample

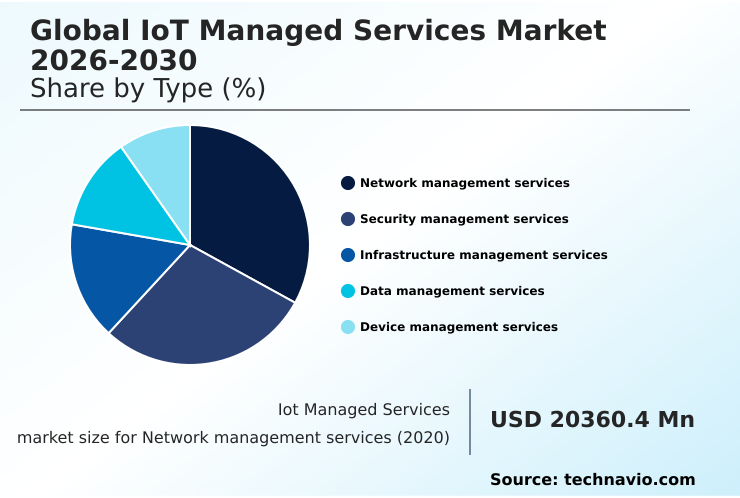
The Network management services segment was valued at USD 53.04 billion in 2024 and showed a gradual increase during the forecast period.

Request Free Sample

Regional Analysis

APAC is estimated to contribute 32.9% to the growth of the global market during the forecast period.Technavio’s analysts have elaborately explained the regional trends and drivers that shape the market during the forecast period.

See How Iot Managed Services Market Demand is Rising in APAC Request Free Sample

The APAC region, exhibiting the fastest growth at 39.5%, is a major driver, fueled by government investments in smart cities and industrial digitalization.

North America remains a dominant market, where stringent regulations and high labor costs accelerate the adoption of managed services for digital twin management and automated inventory tracking, contributing 28.03% to the global opportunity.

Europe is focused on sovereign cloud frameworks and sustainability, using managed services to comply with EU mandates.

Emerging applications in South America and Africa include precision farming initiatives and fintech, while healthcare in developed regions relies on these services for remote patient monitoring and managing connected medical devices with secure remote device configuration.

Market Dynamics

Our researchers analyzed the data with 2025 as the base year, along with the key drivers, trends, and challenges. A holistic analysis of drivers will help companies refine their marketing strategies to gain a competitive advantage.

  • Successfully navigating the global iot managed services market 2026-2030 requires addressing several complex, interconnected challenges. At the forefront is the task of managing interoperability in fragmented iot ecosystems, where a lack of standardization complicates deployments. Scaling data governance for massive iot networks is another critical hurdle, demanding robust security and compliance frameworks, especially for deploying private 5g for enterprise use.
  • The industry also faces the challenge of addressing iot technical talent shortages, which constrains the ability to deliver sophisticated services. A key opportunity lies in the convergence of 5g and edge orchestration, which enables iot data monetization at the network edge.
  • This transition is fueling the adoption of outcome-based models in iot managed services, particularly for iot managed services for industrial automation. Security remains a paramount concern, driving demand for ai-powered security for critical iot infrastructure and the implementation of zero-trust security for low-power iot devices.
  • Effective lifecycle management for diverse iot assets, including automating firmware compliance for iot devices, is essential. Providers that master unified connectivity for terrestrial and satellite networks for real-time monitoring of global supply chains will gain a significant competitive advantage. Orchestrating workloads in hybrid cloud environments has shown to improve resource efficiency by over 25% compared to legacy on-premise solutions.
  • Success also depends on ensuring data sovereignty with edge computing, securing decentralized network entry points, managing security for smart city infrastructure, and enabling predictive maintenance for industrial machinery while adhering to regulatory compliance in global iot managed services.

What are the key market drivers leading to the rise in the adoption of Iot Managed Services Industry?

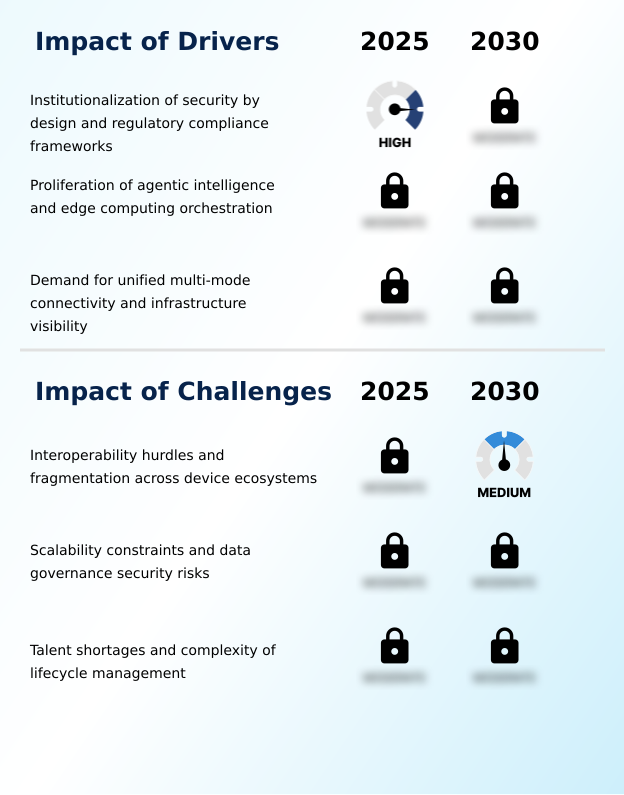
  • The institutionalization of security-by-design principles, underscored by increasingly stringent regulatory compliance frameworks, is a key driver of market growth.

  • The institutionalization of security-by-design, driven by tightening regulations, mandates stringent firmware compliance and zero-trust security principles. This has increased reliance on managed services, with organizations achieving over 95% compliance audit readiness.
  • The proliferation of agentic intelligence and decentralized data processing through edge computing orchestration is another key driver. Enterprises are outsourcing the management of these complex architectures to ensure the high-availability service level agreements required for mission-critical operations.
  • This trend is amplified by cellular network fabric integration, which embeds security directly into the connectivity layer, and supports digital energy-saving measures and innovative applications like usage-based insurance models through advanced automated anomaly detection.

What are the market trends shaping the Iot Managed Services Industry?

  • The industrialization of AI-powered managed security architectures is a significant upcoming market trend. This shift moves security from a reactive function to an integrated, autonomous core service.

  • The market is shifting toward industrialized, AI-powered managed security architectures that deliver autonomous incident response for industrial endpoint protection. This is driving demand for services that reduce cyber threats in critical infrastructure by up to 35%. Concurrently, there is a transition toward outcome-based service models where payment is tied to performance metrics, with some providers leveraging smart contract-based payments.
  • The 5G-advanced convergence with edge orchestration is enabling new applications like real-time remote surgery and the deployment of secure private campus networks, where service providers handle the entire infrastructure lifecycle. This requires robust strategic data governance to ensure compliance and data integrity across distributed environments.

What challenges does the Iot Managed Services Industry face during its growth?

  • Interoperability hurdles and significant fragmentation across diverse device ecosystems present a key challenge affecting the industry's growth trajectory.

  • The market's growth is constrained by interoperability hurdles across fragmented device ecosystems, complicating unified data orchestration and cross-platform integration. This fragmentation increases deployment times by an average of 25% and hinders effective autonomous systems management, particularly in smart factory automation and vehicle-to-everything communication systems.
  • Another significant challenge is the acute shortage of specialized talent needed for complex lifecycle management, from maintaining a software bill of materials to executing predictive maintenance. This deficit impacts the ability to manage sophisticated applications like real-time asset traceability and secure smart ATM management, forcing providers to invest heavily in automation and training.

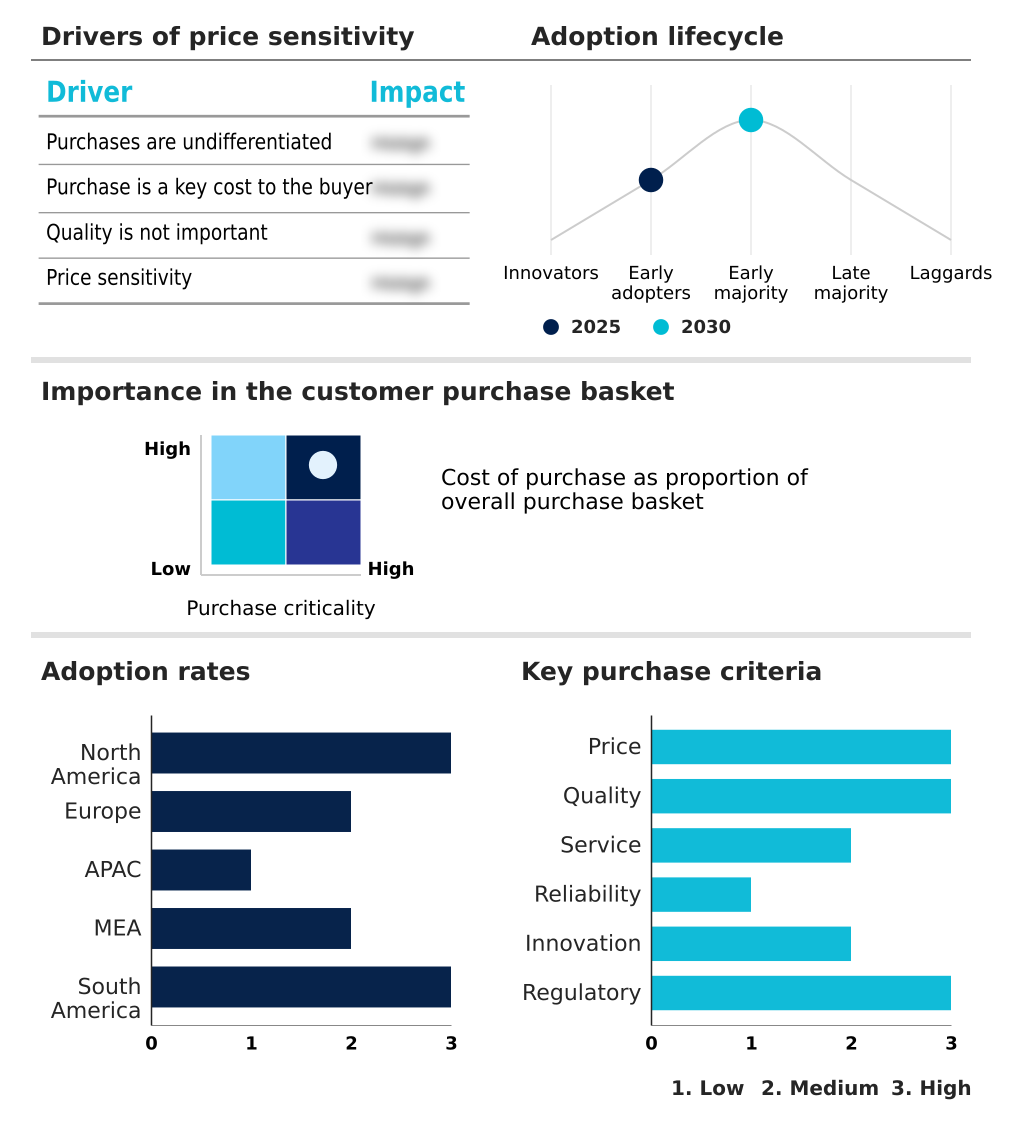
Exclusive Technavio Analysis on Customer Landscape

The iot managed services market forecasting report includes the adoption lifecycle of the market, covering from the innovator’s stage to the laggard’s stage. It focuses on adoption rates in different regions based on penetration. Furthermore, the iot managed services market report also includes key purchase criteria and drivers of price sensitivity to help companies evaluate and develop their market growth analysis strategies.

Customer Landscape of Iot Managed Services Industry

Competitive Landscape

Companies are implementing various strategies, such as strategic alliances, iot managed services market forecast, partnerships, mergers and acquisitions, geographical expansion, and product/service launches, to enhance their presence in the industry.

Accenture Plc - Offers end-to-end IoT lifecycle management, from connected asset management to Industry X services, enabling comprehensive digital transformation for enterprise clients.

The industry research and growth report includes detailed analyses of the competitive landscape of the market and information about key companies, including:

  • Accenture Plc
  • Amazon Web Services Inc.
  • AT and T Inc.
  • Cisco Systems Inc.
  • Cognizant Technology Solution
  • HCL Technologies Ltd.
  • IBM Corp.
  • Infosys Ltd.
  • KORE Group Holdings Inc.
  • Microsoft Corp.
  • Orange SA
  • Siemens AG
  • T Mobile US Inc.
  • Tata Consultancy Services
  • Tech Mahindra Ltd.
  • Telefonica Tech
  • Telit Cinterion
  • Verizon Communications Inc.
  • Vodafone Group Plc
  • Wipro Ltd.

Qualitative and quantitative analysis of companies has been conducted to help clients understand the wider business environment as well as the strengths and weaknesses of key industry players. Data is qualitatively analyzed to categorize companies as pure play, category-focused, industry-focused, and diversified; it is quantitatively analyzed to categorize companies as dominant, leading, strong, tentative, and weak.

Recent Development and News in Iot managed services market

  • In September 2024, a leading industrial automation firm launched its 'SecureEdge' platform, a managed service offering AI-powered threat detection and autonomous response for OT environments, as detailed in their Q3 product update.
  • In November 2024, a major telecommunications provider and a hyperscale cloud company announced a strategic partnership to deliver integrated 5G edge computing and IoT management solutions for smart manufacturing sectors in North America and Europe, reported by Bloomberg.
  • In January 2025, a specialized IoT connectivity provider acquired a European eSIM technology startup, aiming to integrate universal SIM provisioning into its global managed services platform to simplify device deployment, according to a company press release.
  • In April 2025, a European Union regulatory body published new guidelines for IoT device security, mandating stricter lifecycle management and data interoperability protocols for critical infrastructure applications, as outlined on the EU's digital policy portal.

Dive into Technavio’s robust research methodology, blending expert interviews, extensive data synthesis, and validated models for unparalleled Iot Managed Services Market insights. See full methodology.

Market Scope
Page number 332
Base year 2025
Historic period 2020-2024
Forecast period 2026-2030
Growth momentum & CAGR Accelerate at a CAGR of 34.1%
Market growth 2026-2030 USD 733721.3 million
Market structure Fragmented
YoY growth 2025-2026(%) 30.9%
Key countries US, Canada, Mexico, Germany, UK, France, Italy, Spain, The Netherlands, China, Japan, India, South Korea, Australia, Indonesia, Saudi Arabia, UAE, South Africa, Israel, Turkey, Brazil, Argentina and Chile
Competitive landscape Leading Companies, Market Positioning of Companies, Competitive Strategies, and Industry Risks

Request Free Sample

Research Analyst Overview

  • The market is defined by the strategic imperative to manage complex, hyper-connected environments. A core trend is the shift toward agentic intelligence and autonomous systems management, where decentralized data processing occurs at the edge. This requires sophisticated edge computing orchestration and unified data orchestration to handle real-time telemetry.
  • Boardroom decisions are now focused on achieving this through private 5G networks that provide the necessary low-latency connectivity. Security has moved from an add-on to an integrated function, with AI-powered managed security delivering automated threat detection and autonomous incident response. Service providers are mandated to ensure zero-trust security, full firmware compliance, and maintain a complete software bill of materials.
  • The use of digital twin management for predictive maintenance has demonstrated a 30% reduction in unplanned downtime. Providers must also master multi-mode connectivity, including hybrid connectivity and cellular network fabric integration, while offering seamless remote device configuration and over-the-air firmware updates.
  • This all supports the rise of industrial intelligence within sovereign cloud frameworks, which rely on deep network traffic pattern analysis for optimization.

What are the Key Data Covered in this Iot Managed Services Market Research and Growth Report?

  • What is the expected growth of the Iot Managed Services Market between 2026 and 2030?

    • USD 733.72 billion, at a CAGR of 34.1%

  • What segmentation does the market report cover?

    • The report is segmented by Type (Network management services, Security management services, Infrastructure management services, Data management services, and Device management services), Deployment (On-premises, and Cloud), Sector (SMEs, and Large enterprises), End-user (Healthcare, Manufacturing, Retail, BFSI, and Others) and Geography (North America, Europe, APAC, Middle East and Africa, South America)

  • Which regions are analyzed in the report?

    • North America, Europe, APAC, Middle East and Africa and South America

  • What are the key growth drivers and market challenges?

    • Institutionalization of security by design and regulatory compliance frameworks, Interoperability hurdles and fragmentation across device ecosystems

  • Who are the major players in the Iot Managed Services Market?

    • Accenture Plc, Amazon Web Services Inc., AT and T Inc., Cisco Systems Inc., Cognizant Technology Solution, HCL Technologies Ltd., IBM Corp., Infosys Ltd., KORE Group Holdings Inc., Microsoft Corp., Orange SA, Siemens AG, T Mobile US Inc., Tata Consultancy Services, Tech Mahindra Ltd., Telefonica Tech, Telit Cinterion, Verizon Communications Inc., Vodafone Group Plc and Wipro Ltd.

Market Research Insights

  • The dynamics of the IoT managed services market are increasingly shaped by a pivot to outcome-based service models and sophisticated monetization strategies that prioritize measurable business results. Organizations are leveraging high-availability service level agreements that guarantee performance metrics, with some achieving a 15% reduction in operational downtime.
  • This shift is supported by single-pane-of-glass solutions offering unified visibility into managed fleet and logistics, improving asset utilization by over 20%. The adoption of smart factory automation is facilitated by providers offering end-to-end management, while the integration of connected medical devices is enabling new remote patient monitoring capabilities.
  • Furthermore, the convergence with 5G-Advanced is creating opportunities for real-time applications that were previously unfeasible, reinforcing the value of expert third-party management.

We can help! Our analysts can customize this iot managed services market research report to meet your requirements.

Get in touch

1. Executive Summary

1.1 Market overview

Executive Summary - Chart on Market Overview
Executive Summary - Data Table on Market Overview
Executive Summary - Chart on Global Market Characteristics
Executive Summary - Chart on Market by Geography
Executive Summary - Chart on Market Segmentation by Type
Executive Summary - Chart on Market Segmentation by Deployment
Executive Summary - Chart on Market Segmentation by Sector
Executive Summary - Chart on Market Segmentation by End-user
Executive Summary - Chart on Incremental Growth
Executive Summary - Data Table on Incremental Growth
Executive Summary - Chart on Company Market Positioning

2. Technavio Analysis

2.1 Analysis of price sensitivity, lifecycle, customer purchase basket, adoption rates, and purchase criteria

2.2 Criticality of inputs and Factors of differentiation

Chart on Overview on criticality of inputs and factors of differentiation

2.3 Factors of disruption

Chart on Overview on factors of disruption

2.4 Impact of drivers and challenges

Chart on Impact of drivers and challenges in 2025 and 2030

3. Market Landscape

3.1 Market ecosystem

Chart on Parent Market
Data Table on - Parent Market

3.2 Market characteristics

Chart on Market characteristics analysis

3.3 Value chain analysis

Chart on Value chain analysis

4. Market Sizing

4.1 Market definition

Data Table on Offerings of companies included in the market definition

4.2 Market segment analysis

Market segments

4.3 Market size 2025

4.4 Market outlook: Forecast for 2025-2030

Chart on Global - Market size and forecast 2025-2030 ($ million)
Data Table on Global - Market size and forecast 2025-2030 ($ million)
Chart on Global Market: Year-over-year growth 2025-2030 (%)
Data Table on Global Market: Year-over-year growth 2025-2030 (%)

5. Historic Market Size

5.1 Global IoT Managed Services Market 2020 - 2024

Historic Market Size - Data Table on Global IoT Managed Services Market 2020 - 2024 ($ million)

5.2 Type segment analysis 2020 - 2024

Historic Market Size - Type Segment 2020 - 2024 ($ million)

5.3 Deployment segment analysis 2020 - 2024

Historic Market Size - Deployment Segment 2020 - 2024 ($ million)

5.4 Sector segment analysis 2020 - 2024

Historic Market Size - Sector Segment 2020 - 2024 ($ million)

5.5 End-user segment analysis 2020 - 2024

Historic Market Size - End-user Segment 2020 - 2024 ($ million)

5.6 Geography segment analysis 2020 - 2024

Historic Market Size - Geography Segment 2020 - 2024 ($ million)

5.7 Country segment analysis 2020 - 2024

Historic Market Size - Country Segment 2020 - 2024 ($ million)

6. Qualitative Analysis

6.1 Impact of AI in global IoT managed services market

6.2 Impact of geopolitical conflict on global IoT managed services market

7. Five Forces Analysis

7.1 Five forces summary

Five forces analysis - Comparison between 2025 and 2030

7.2 Bargaining power of buyers

Bargaining power of buyers - Impact of key factors 2025 and 2030

7.3 Bargaining power of suppliers

Bargaining power of suppliers - Impact of key factors in 2025 and 2030

7.4 Threat of new entrants

Threat of new entrants - Impact of key factors in 2025 and 2030

7.5 Threat of substitutes

Threat of substitutes - Impact of key factors in 2025 and 2030

7.6 Threat of rivalry

Threat of rivalry - Impact of key factors in 2025 and 2030

7.7 Market condition

Chart on Market condition - Five forces 2025 and 2030

8. Market Segmentation by Type

8.1 Market segments

Chart on Type - Market share 2025-2030 (%)
Data Table on Type - Market share 2025-2030 (%)

8.2 Comparison by Type

Chart on Comparison by Type
Data Table on Comparison by Type

8.3 Network management services - Market size and forecast 2025-2030

Chart on Network management services - Market size and forecast 2025-2030 ($ million)
Data Table on Network management services - Market size and forecast 2025-2030 ($ million)
Chart on Network management services - Year-over-year growth 2025-2030 (%)
Data Table on Network management services - Year-over-year growth 2025-2030 (%)

8.4 Security management services - Market size and forecast 2025-2030

Chart on Security management services - Market size and forecast 2025-2030 ($ million)
Data Table on Security management services - Market size and forecast 2025-2030 ($ million)
Chart on Security management services - Year-over-year growth 2025-2030 (%)
Data Table on Security management services - Year-over-year growth 2025-2030 (%)

8.5 Infrastructure management services - Market size and forecast 2025-2030

Chart on Infrastructure management services - Market size and forecast 2025-2030 ($ million)
Data Table on Infrastructure management services - Market size and forecast 2025-2030 ($ million)
Chart on Infrastructure management services - Year-over-year growth 2025-2030 (%)
Data Table on Infrastructure management services - Year-over-year growth 2025-2030 (%)

8.6 Data management services - Market size and forecast 2025-2030

Chart on Data management services - Market size and forecast 2025-2030 ($ million)
Data Table on Data management services - Market size and forecast 2025-2030 ($ million)
Chart on Data management services - Year-over-year growth 2025-2030 (%)
Data Table on Data management services - Year-over-year growth 2025-2030 (%)

8.7 Device management services - Market size and forecast 2025-2030

Chart on Device management services - Market size and forecast 2025-2030 ($ million)
Data Table on Device management services - Market size and forecast 2025-2030 ($ million)
Chart on Device management services - Year-over-year growth 2025-2030 (%)
Data Table on Device management services - Year-over-year growth 2025-2030 (%)

8.8 Market opportunity by Type

Market opportunity by Type ($ million)
Data Table on Market opportunity by Type ($ million)

9. Market Segmentation by Deployment

9.1 Market segments

Chart on Deployment - Market share 2025-2030 (%)
Data Table on Deployment - Market share 2025-2030 (%)

9.2 Comparison by Deployment

Chart on Comparison by Deployment
Data Table on Comparison by Deployment

9.3 On-premises - Market size and forecast 2025-2030

Chart on On-premises - Market size and forecast 2025-2030 ($ million)
Data Table on On-premises - Market size and forecast 2025-2030 ($ million)
Chart on On-premises - Year-over-year growth 2025-2030 (%)
Data Table on On-premises - Year-over-year growth 2025-2030 (%)

9.4 Cloud - Market size and forecast 2025-2030

Chart on Cloud - Market size and forecast 2025-2030 ($ million)
Data Table on Cloud - Market size and forecast 2025-2030 ($ million)
Chart on Cloud - Year-over-year growth 2025-2030 (%)
Data Table on Cloud - Year-over-year growth 2025-2030 (%)

9.5 Market opportunity by Deployment

Market opportunity by Deployment ($ million)
Data Table on Market opportunity by Deployment ($ million)

10. Market Segmentation by Sector

10.1 Market segments

Chart on Sector - Market share 2025-2030 (%)
Data Table on Sector - Market share 2025-2030 (%)

10.2 Comparison by Sector

Chart on Comparison by Sector
Data Table on Comparison by Sector

10.3 SMEs - Market size and forecast 2025-2030

Chart on SMEs - Market size and forecast 2025-2030 ($ million)
Data Table on SMEs - Market size and forecast 2025-2030 ($ million)
Chart on SMEs - Year-over-year growth 2025-2030 (%)
Data Table on SMEs - Year-over-year growth 2025-2030 (%)

10.4 Large enterprises - Market size and forecast 2025-2030

Chart on Large enterprises - Market size and forecast 2025-2030 ($ million)
Data Table on Large enterprises - Market size and forecast 2025-2030 ($ million)
Chart on Large enterprises - Year-over-year growth 2025-2030 (%)
Data Table on Large enterprises - Year-over-year growth 2025-2030 (%)

10.5 Market opportunity by Sector

Market opportunity by Sector ($ million)
Data Table on Market opportunity by Sector ($ million)

11. Market Segmentation by End-user

11.1 Market segments

Chart on End-user - Market share 2025-2030 (%)
Data Table on End-user - Market share 2025-2030 (%)

11.2 Comparison by End-user

Chart on Comparison by End-user
Data Table on Comparison by End-user

11.3 Healthcare - Market size and forecast 2025-2030

Chart on Healthcare - Market size and forecast 2025-2030 ($ million)
Data Table on Healthcare - Market size and forecast 2025-2030 ($ million)
Chart on Healthcare - Year-over-year growth 2025-2030 (%)
Data Table on Healthcare - Year-over-year growth 2025-2030 (%)

11.4 Manufacturing - Market size and forecast 2025-2030

Chart on Manufacturing - Market size and forecast 2025-2030 ($ million)
Data Table on Manufacturing - Market size and forecast 2025-2030 ($ million)
Chart on Manufacturing - Year-over-year growth 2025-2030 (%)
Data Table on Manufacturing - Year-over-year growth 2025-2030 (%)

11.5 Retail - Market size and forecast 2025-2030

Chart on Retail - Market size and forecast 2025-2030 ($ million)
Data Table on Retail - Market size and forecast 2025-2030 ($ million)
Chart on Retail - Year-over-year growth 2025-2030 (%)
Data Table on Retail - Year-over-year growth 2025-2030 (%)

11.6 BFSI - Market size and forecast 2025-2030

Chart on BFSI - Market size and forecast 2025-2030 ($ million)
Data Table on BFSI - Market size and forecast 2025-2030 ($ million)
Chart on BFSI - Year-over-year growth 2025-2030 (%)
Data Table on BFSI - Year-over-year growth 2025-2030 (%)

11.7 Others - Market size and forecast 2025-2030

Chart on Others - Market size and forecast 2025-2030 ($ million)
Data Table on Others - Market size and forecast 2025-2030 ($ million)
Chart on Others - Year-over-year growth 2025-2030 (%)
Data Table on Others - Year-over-year growth 2025-2030 (%)

11.8 Market opportunity by End-user

Market opportunity by End-user ($ million)
Data Table on Market opportunity by End-user ($ million)

12. Customer Landscape

12.1 Customer landscape overview

Analysis of price sensitivity, lifecycle, customer purchase basket, adoption rates, and purchase criteria

13. Geographic Landscape

13.1 Geographic segmentation

Chart on Market share by geography 2025-2030 (%)
Data Table on Market share by geography 2025-2030 (%)

13.2 Geographic comparison

Chart on Geographic comparison
Data Table on Geographic comparison

13.3 North America - Market size and forecast 2025-2030

Chart on North America - Market size and forecast 2025-2030 ($ million)
Data Table on North America - Market size and forecast 2025-2030 ($ million)
Chart on North America - Year-over-year growth 2025-2030 (%)
Data Table on North America - Year-over-year growth 2025-2030 (%)
Chart on Regional Comparison - North America
Data Table on Regional Comparison - North America

13.3.1 US - Market size and forecast 2025-2030

Chart on US - Market size and forecast 2025-2030 ($ million)
Data Table on US - Market size and forecast 2025-2030 ($ million)
Chart on US - Year-over-year growth 2025-2030 (%)
Data Table on US - Year-over-year growth 2025-2030 (%)

13.3.2 Canada - Market size and forecast 2025-2030

Chart on Canada - Market size and forecast 2025-2030 ($ million)
Data Table on Canada - Market size and forecast 2025-2030 ($ million)
Chart on Canada - Year-over-year growth 2025-2030 (%)
Data Table on Canada - Year-over-year growth 2025-2030 (%)

13.3.3 Mexico - Market size and forecast 2025-2030

Chart on Mexico - Market size and forecast 2025-2030 ($ million)
Data Table on Mexico - Market size and forecast 2025-2030 ($ million)
Chart on Mexico - Year-over-year growth 2025-2030 (%)
Data Table on Mexico - Year-over-year growth 2025-2030 (%)

13.4 Europe - Market size and forecast 2025-2030

Chart on Europe - Market size and forecast 2025-2030 ($ million)
Data Table on Europe - Market size and forecast 2025-2030 ($ million)
Chart on Europe - Year-over-year growth 2025-2030 (%)
Data Table on Europe - Year-over-year growth 2025-2030 (%)
Chart on Regional Comparison - Europe
Data Table on Regional Comparison - Europe

13.4.1 Germany - Market size and forecast 2025-2030

Chart on Germany - Market size and forecast 2025-2030 ($ million)
Data Table on Germany - Market size and forecast 2025-2030 ($ million)
Chart on Germany - Year-over-year growth 2025-2030 (%)
Data Table on Germany - Year-over-year growth 2025-2030 (%)

13.4.2 UK - Market size and forecast 2025-2030

Chart on UK - Market size and forecast 2025-2030 ($ million)
Data Table on UK - Market size and forecast 2025-2030 ($ million)
Chart on UK - Year-over-year growth 2025-2030 (%)
Data Table on UK - Year-over-year growth 2025-2030 (%)

13.4.3 France - Market size and forecast 2025-2030

Chart on France - Market size and forecast 2025-2030 ($ million)
Data Table on France - Market size and forecast 2025-2030 ($ million)
Chart on France - Year-over-year growth 2025-2030 (%)
Data Table on France - Year-over-year growth 2025-2030 (%)

13.4.4 Italy - Market size and forecast 2025-2030

Chart on Italy - Market size and forecast 2025-2030 ($ million)
Data Table on Italy - Market size and forecast 2025-2030 ($ million)
Chart on Italy - Year-over-year growth 2025-2030 (%)
Data Table on Italy - Year-over-year growth 2025-2030 (%)

13.4.5 Spain - Market size and forecast 2025-2030

Chart on Spain - Market size and forecast 2025-2030 ($ million)
Data Table on Spain - Market size and forecast 2025-2030 ($ million)
Chart on Spain - Year-over-year growth 2025-2030 (%)
Data Table on Spain - Year-over-year growth 2025-2030 (%)

13.4.6 The Netherlands - Market size and forecast 2025-2030

Chart on The Netherlands - Market size and forecast 2025-2030 ($ million)
Data Table on The Netherlands - Market size and forecast 2025-2030 ($ million)
Chart on The Netherlands - Year-over-year growth 2025-2030 (%)
Data Table on The Netherlands - Year-over-year growth 2025-2030 (%)

13.5 APAC - Market size and forecast 2025-2030

Chart on APAC - Market size and forecast 2025-2030 ($ million)
Data Table on APAC - Market size and forecast 2025-2030 ($ million)
Chart on APAC - Year-over-year growth 2025-2030 (%)
Data Table on APAC - Year-over-year growth 2025-2030 (%)
Chart on Regional Comparison - APAC
Data Table on Regional Comparison - APAC

13.5.1 China - Market size and forecast 2025-2030

Chart on China - Market size and forecast 2025-2030 ($ million)
Data Table on China - Market size and forecast 2025-2030 ($ million)
Chart on China - Year-over-year growth 2025-2030 (%)
Data Table on China - Year-over-year growth 2025-2030 (%)

13.5.2 Japan - Market size and forecast 2025-2030

Chart on Japan - Market size and forecast 2025-2030 ($ million)
Data Table on Japan - Market size and forecast 2025-2030 ($ million)
Chart on Japan - Year-over-year growth 2025-2030 (%)
Data Table on Japan - Year-over-year growth 2025-2030 (%)

13.5.3 India - Market size and forecast 2025-2030

Chart on India - Market size and forecast 2025-2030 ($ million)
Data Table on India - Market size and forecast 2025-2030 ($ million)
Chart on India - Year-over-year growth 2025-2030 (%)
Data Table on India - Year-over-year growth 2025-2030 (%)

13.5.4 South Korea - Market size and forecast 2025-2030

Chart on South Korea - Market size and forecast 2025-2030 ($ million)
Data Table on South Korea - Market size and forecast 2025-2030 ($ million)
Chart on South Korea - Year-over-year growth 2025-2030 (%)
Data Table on South Korea - Year-over-year growth 2025-2030 (%)

13.5.5 Australia - Market size and forecast 2025-2030

Chart on Australia - Market size and forecast 2025-2030 ($ million)
Data Table on Australia - Market size and forecast 2025-2030 ($ million)
Chart on Australia - Year-over-year growth 2025-2030 (%)
Data Table on Australia - Year-over-year growth 2025-2030 (%)

13.5.6 Indonesia - Market size and forecast 2025-2030

Chart on Indonesia - Market size and forecast 2025-2030 ($ million)
Data Table on Indonesia - Market size and forecast 2025-2030 ($ million)
Chart on Indonesia - Year-over-year growth 2025-2030 (%)
Data Table on Indonesia - Year-over-year growth 2025-2030 (%)

13.6 Middle East and Africa - Market size and forecast 2025-2030

Chart on Middle East and Africa - Market size and forecast 2025-2030 ($ million)
Data Table on Middle East and Africa - Market size and forecast 2025-2030 ($ million)
Chart on Middle East and Africa - Year-over-year growth 2025-2030 (%)
Data Table on Middle East and Africa - Year-over-year growth 2025-2030 (%)
Chart on Regional Comparison - Middle East and Africa
Data Table on Regional Comparison - Middle East and Africa

13.6.1 Saudi Arabia - Market size and forecast 2025-2030

Chart on Saudi Arabia - Market size and forecast 2025-2030 ($ million)
Data Table on Saudi Arabia - Market size and forecast 2025-2030 ($ million)
Chart on Saudi Arabia - Year-over-year growth 2025-2030 (%)
Data Table on Saudi Arabia - Year-over-year growth 2025-2030 (%)

13.6.2 UAE - Market size and forecast 2025-2030

Chart on UAE - Market size and forecast 2025-2030 ($ million)
Data Table on UAE - Market size and forecast 2025-2030 ($ million)
Chart on UAE - Year-over-year growth 2025-2030 (%)
Data Table on UAE - Year-over-year growth 2025-2030 (%)

13.6.3 South Africa - Market size and forecast 2025-2030

Chart on South Africa - Market size and forecast 2025-2030 ($ million)
Data Table on South Africa - Market size and forecast 2025-2030 ($ million)
Chart on South Africa - Year-over-year growth 2025-2030 (%)
Data Table on South Africa - Year-over-year growth 2025-2030 (%)

13.6.4 Israel - Market size and forecast 2025-2030

Chart on Israel - Market size and forecast 2025-2030 ($ million)
Data Table on Israel - Market size and forecast 2025-2030 ($ million)
Chart on Israel - Year-over-year growth 2025-2030 (%)
Data Table on Israel - Year-over-year growth 2025-2030 (%)

13.6.5 Turkey - Market size and forecast 2025-2030

Chart on Turkey - Market size and forecast 2025-2030 ($ million)
Data Table on Turkey - Market size and forecast 2025-2030 ($ million)
Chart on Turkey - Year-over-year growth 2025-2030 (%)
Data Table on Turkey - Year-over-year growth 2025-2030 (%)

13.7 South America - Market size and forecast 2025-2030

Chart on South America - Market size and forecast 2025-2030 ($ million)
Data Table on South America - Market size and forecast 2025-2030 ($ million)
Chart on South America - Year-over-year growth 2025-2030 (%)
Data Table on South America - Year-over-year growth 2025-2030 (%)
Chart on Regional Comparison - South America
Data Table on Regional Comparison - South America

13.7.1 Brazil - Market size and forecast 2025-2030

Chart on Brazil - Market size and forecast 2025-2030 ($ million)
Data Table on Brazil - Market size and forecast 2025-2030 ($ million)
Chart on Brazil - Year-over-year growth 2025-2030 (%)
Data Table on Brazil - Year-over-year growth 2025-2030 (%)

13.7.2 Argentina - Market size and forecast 2025-2030

Chart on Argentina - Market size and forecast 2025-2030 ($ million)
Data Table on Argentina - Market size and forecast 2025-2030 ($ million)
Chart on Argentina - Year-over-year growth 2025-2030 (%)
Data Table on Argentina - Year-over-year growth 2025-2030 (%)

13.7.3 Chile - Market size and forecast 2025-2030

Chart on Chile - Market size and forecast 2025-2030 ($ million)
Data Table on Chile - Market size and forecast 2025-2030 ($ million)
Chart on Chile - Year-over-year growth 2025-2030 (%)
Data Table on Chile - Year-over-year growth 2025-2030 (%)

13.8 Market opportunity by geography

Market opportunity by geography ($ million)
Data Tables on Market opportunity by geography ($ million)

14. Drivers, Challenges, and Opportunity

14.1 Market drivers

Institutionalization of security by design and regulatory compliance frameworks
Proliferation of agentic intelligence and edge computing orchestration
Demand for unified multi-mode connectivity and infrastructure visibility

14.2 Market challenges

Interoperability hurdles and fragmentation across device ecosystems
Scalability constraints and data governance security risks
Talent shortages and complexity of lifecycle management

14.3 Impact of drivers and challenges

Impact of drivers and challenges in 2025 and 2030

14.4 Market opportunities

Industrialization of AI-powered managed security architectures
Transition toward outcome-based service models and monetization
Convergence of 5G-advanced and edge orchestration

15. Competitive Landscape

15.1 Overview

15.2

Overview on criticality of inputs and factors of differentiation

15.3 Landscape disruption

Overview on factors of disruption

15.4 Industry risks

Impact of key risks on business

16. Competitive Analysis

16.1 Companies profiled

Companies covered

16.2 Company ranking index

16.3 Market positioning of companies

Matrix on companies position and classification

16.4 Accenture Plc

Accenture Plc - Overview
Accenture Plc - Business segments
Accenture Plc - Key news
Accenture Plc - Key offerings
Accenture Plc - Segment focus
SWOT

16.5 Amazon Web Services Inc.

Amazon Web Services Inc. - Overview
Amazon Web Services Inc. - Product / Service
Amazon Web Services Inc. - Key offerings
SWOT

16.6 AT and T Inc.

AT and T Inc. - Overview
AT and T Inc. - Business segments
AT and T Inc. - Key offerings
AT and T Inc. - Segment focus
SWOT

16.7 Cisco Systems Inc.

Cisco Systems Inc. - Overview
Cisco Systems Inc. - Business segments
Cisco Systems Inc. - Key news
Cisco Systems Inc. - Key offerings
Cisco Systems Inc. - Segment focus
SWOT

16.8 Cognizant Technology Solution

Cognizant Technology Solution - Overview
Cognizant Technology Solution - Business segments
Cognizant Technology Solution - Key news
Cognizant Technology Solution - Key offerings
Cognizant Technology Solution - Segment focus
SWOT

16.9 HCL Technologies Ltd.

HCL Technologies Ltd. - Overview
HCL Technologies Ltd. - Business segments
HCL Technologies Ltd. - Key offerings
HCL Technologies Ltd. - Segment focus
SWOT

16.10 IBM Corp.

IBM Corp. - Overview
IBM Corp. - Business segments
IBM Corp. - Key news
IBM Corp. - Key offerings
IBM Corp. - Segment focus
SWOT

16.11 Infosys Ltd.

Infosys Ltd. - Overview
Infosys Ltd. - Business segments
Infosys Ltd. - Key news
Infosys Ltd. - Key offerings
Infosys Ltd. - Segment focus
SWOT

16.12 Microsoft Corp.

Microsoft Corp. - Overview
Microsoft Corp. - Business segments
Microsoft Corp. - Key news
Microsoft Corp. - Key offerings
Microsoft Corp. - Segment focus
SWOT

16.13 Orange SA

Orange SA - Overview
Orange SA - Business segments
Orange SA - Key offerings
Orange SA - Segment focus
SWOT

16.14 Siemens AG

Siemens AG - Overview
Siemens AG - Business segments
Siemens AG - Key news
Siemens AG - Key offerings
Siemens AG - Segment focus
SWOT

16.15 T Mobile US Inc.

T Mobile US Inc. - Overview
T Mobile US Inc. - Product / Service
T Mobile US Inc. - Key offerings
SWOT

16.16 Tata Consultancy Services

Tata Consultancy Services - Overview
Tata Consultancy Services - Business segments
Tata Consultancy Services - Key offerings
Tata Consultancy Services - Segment focus
SWOT

16.17 Tech Mahindra Ltd.

Tech Mahindra Ltd. - Overview
Tech Mahindra Ltd. - Business segments
Tech Mahindra Ltd. - Key offerings
Tech Mahindra Ltd. - Segment focus
SWOT

16.18 Verizon Communications Inc.

Verizon Communications Inc. - Overview
Verizon Communications Inc. - Business segments
Verizon Communications Inc. - Key offerings
Verizon Communications Inc. - Segment focus
SWOT

17. Appendix

17.1 Scope of the report

Market definition
Objectives
Notes and caveats

17.2 Inclusions and exclusions checklist

Inclusions checklist
Exclusions checklist

17.3 Currency conversion rates for US$

17.4 Research methodology

17.5 Data procurement

Information sources

17.6 Data validation

17.7 Validation techniques employed for market sizing

17.8 Data synthesis

17.9 360 degree market analysis

17.10 List of abbreviations

Research Methodology

Technavio presents a detailed picture of the market by way of study, synthesis, and summation of data from multiple sources. The analysts have presented the various facets of the market with a particular focus on identifying the key industry influencers. The data thus presented is comprehensive, reliable, and the result of extensive research, both primary and secondary.

INFORMATION SOURCES

Primary sources

  • Manufacturers and suppliers
  • Channel partners
  • Industry experts
  • Strategic decision makers

Secondary sources

  • Industry journals and periodicals
  • Government data
  • Financial reports of key industry players
  • Historical data
  • Press releases

DATA ANALYSIS

Data Synthesis

  • Collation of data
  • Estimation of key figures
  • Analysis of derived insights

Data Validation

  • Triangulation with data models
  • Reference against proprietary databases
  • Corroboration with industry experts

REPORT WRITING

Qualitative

  • Market drivers
  • Market challenges
  • Market trends
  • Five forces analysis

Quantitative

  • Market size and forecast
  • Market segmentation
  • Geographical insights
  • Competitive landscape

Interested in this report?

Get your sample now to see our research methodology and insights!

Download Now

Frequently Asked Questions

Iot Managed Services market growth will increase by USD 733721.3 million during 2026-2030.

The Iot Managed Services market is expected to grow at a CAGR of 34.1% during 2026-2030.

Iot Managed Services market is segmented by Type (Network management services, Security management services, Infrastructure management services, Data management services, Device management services) Deployment (On-premises, Cloud) Sector (SMEs, Large enterprises) End-user (Healthcare, Manufacturing, Retail, BFSI, Others)

Accenture Plc, Amazon Web Services Inc., AT and T Inc., Cisco Systems Inc., Cognizant Technology Solution, HCL Technologies Ltd., IBM Corp., Infosys Ltd., KORE Group Holdings Inc., Microsoft Corp., Orange SA, Siemens AG, T Mobile US Inc., Tata Consultancy Services, Tech Mahindra Ltd., Telefonica Tech, Telit Cinterion, Verizon Communications Inc., Vodafone Group Plc, Wipro Ltd. are a few of the key vendors in the Iot Managed Services market.

APAC will register the highest growth rate of 32.9% among the other regions. Therefore, the Iot Managed Services market in APAC is expected to garner significant business opportunities for the vendors during the forecast period.

US, Canada, Mexico, Germany, UK, France, Italy, Spain, The Netherlands, China, Japan, India, South Korea, Australia, Indonesia, Saudi Arabia, UAE, South Africa, Israel, Turkey, Brazil, Argentina, Chile

  • Institutionalization of security by design and regulatory compliance frameworks is the driving factor this market.

The Iot Managed Services market vendors should focus on grabbing business opportunities from the Type segment as it accounted for the largest market share in the base year.
RIA - Research AI Assistant
Ask RIA