
In Vitro Diagnostics Contract Manufacturing Market Size 2026-2030
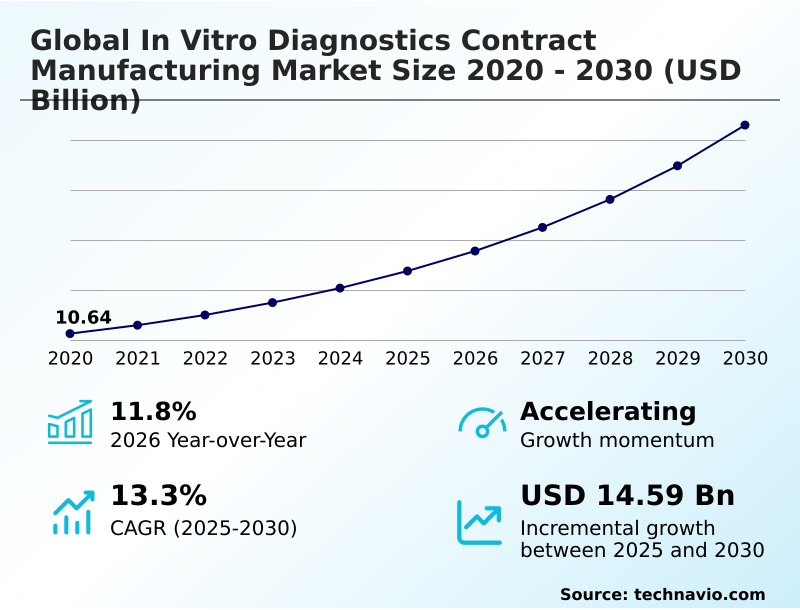
The in vitro diagnostics contract manufacturing market size is valued to increase by USD 14.59 billion, at a CAGR of 13.3% from 2025 to 2030. Rising global prevalence of chronic and infectious diseases and growing volume of diagnostic testing will drive the in vitro diagnostics contract manufacturing market.
Major Market Trends & Insights
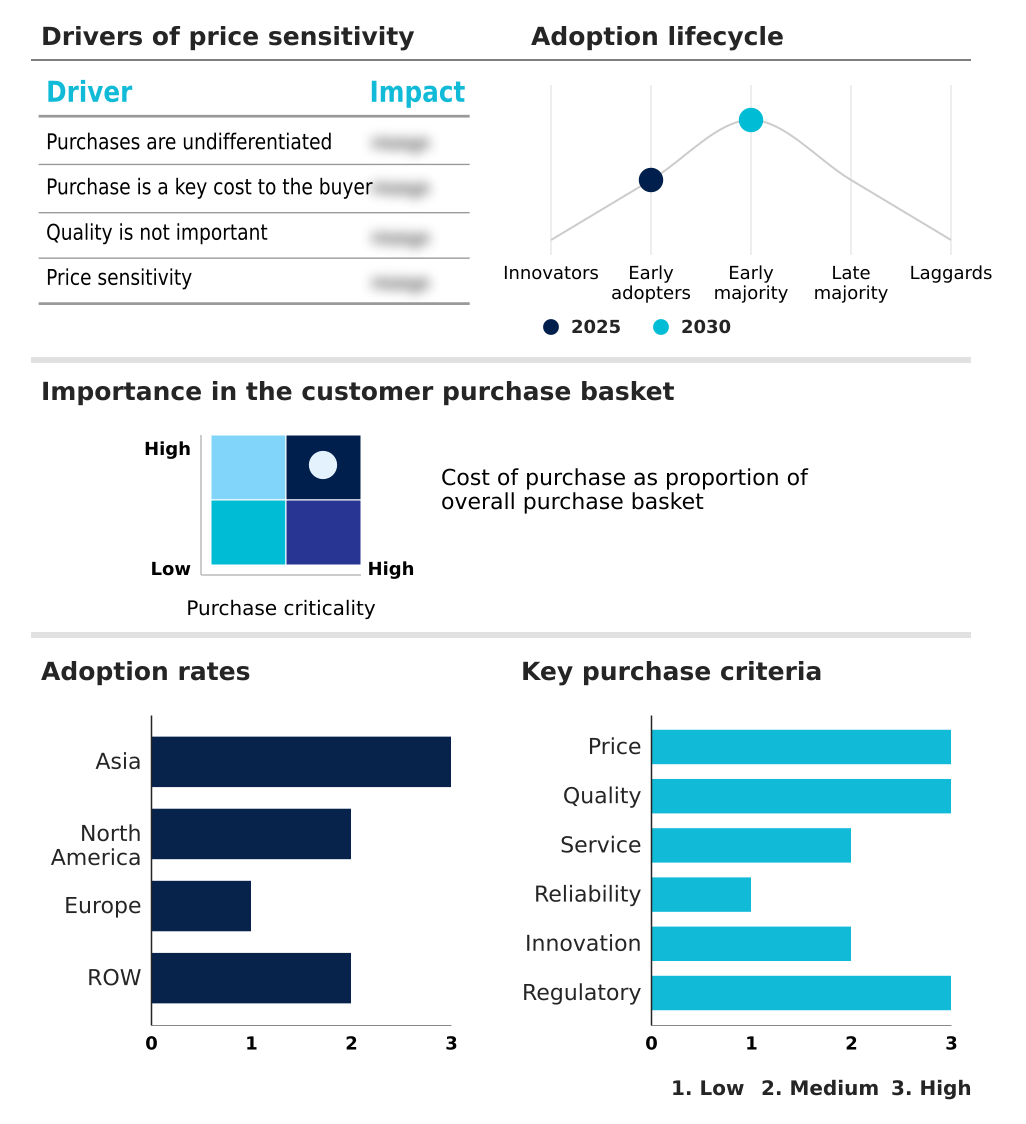
- Asia dominated the market and accounted for a 40.1% growth during the forecast period.
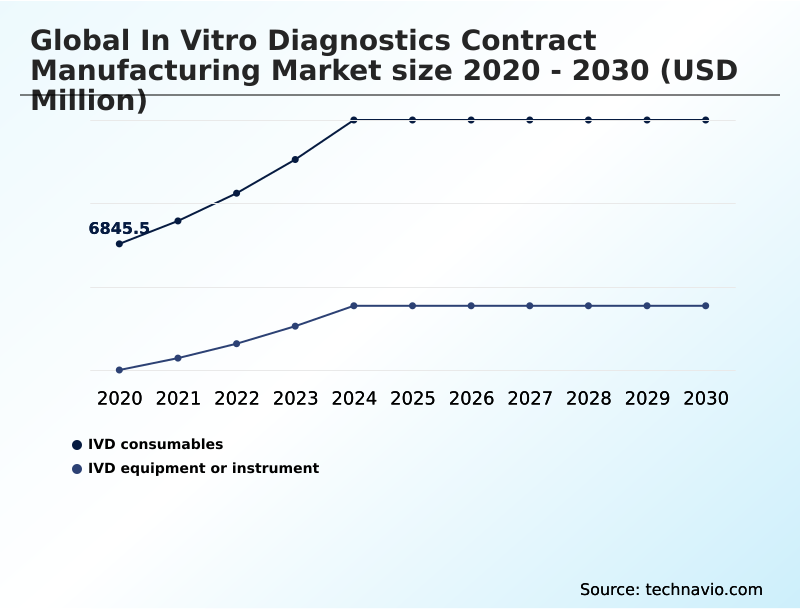
- By Device - IVD consumables segment was valued at USD 9.84 billion in 2024
- By Service Type - Assay development segment accounted for the largest market revenue share in 2024
Market Size & Forecast
- Market Opportunities: USD 20.85 billion
- Market Future Opportunities: USD 14.59 billion
- CAGR from 2025 to 2030 : 13.3%
Market Summary
- The In Vitro Diagnostics Contract Manufacturing Market operates as a critical support structure for the broader healthcare ecosystem, fundamentally changing how medical devices and consumables are produced. Driven by the rising prevalence of chronic and infectious diseases, originators are shifting their massive testing volume requirements to specialized third-party facilities.
- This strategic outsourcing significantly improves operational agility, often allowing diagnostic developers to achieve a 25% reduction in overall production processing time compared to maintaining in-house assembly lines. For instance, delegating the highly complex reagent fill and finish processes to external cleanroom experts allows primary developers to redirect critical resources entirely toward core assay innovation.
- However, stringent regulatory disharmony across different geographical regions poses a persistent challenge, as varying compliance mandates necessitate continuous, burdensome internal auditing and process revalidation. Despite these strict international hurdles, the reliance on specialized external expertise ensures highly scalable, cost-effective, and precise manufacturing outcomes, firmly establishing these external partnerships as indispensable assets in modern clinical diagnostics.
What will be the Size of the In Vitro Diagnostics Contract Manufacturing Market during the forecast period?
Get Key Insights on Market Forecast (PDF) Get Free Sample
How is the In Vitro Diagnostics Contract Manufacturing Market Segmented?
The in vitro diagnostics contract manufacturing industry research report provides comprehensive data (region-wise segment analysis), with forecasts and estimates in "USD million" for the period 2026-2030, as well as historical data from 2020-2024 for the following segments.
- Device
- IVD consumables
- IVD equipment or instrument
- Service type
- Assay development
- Manufacturing
- Others
- Technology
- Immunoassays
- Molecular diagnostics
- Clinical chemistry
- Hematology
- Microbiology
- Geography
- Asia
- China
- India
- Japan
- South Korea
- Thailand
- Indonesia
- North America
- US
- Canada
- Mexico
- Europe
- Germany
- UK
- France
- Switzerland
- Spain
- Italy
- Rest of World (ROW)
- Asia
By Device Insights
The ivd consumables segment is estimated to witness significant growth during the forecast period.
The IVD consumables segment represents the foundation of the In Vitro Diagnostics Contract Manufacturing industry, characterized by continuous high-volume production of single-use components necessary for clinical testing.
As healthcare systems increase their reliance on chronic disease monitoring, outsourcing production to contract development organizations has become essential. Specialized facilities utilizing advanced robotic assembly and precision liquid dispensing ensure absolute consistency across massive batches.
This strategic delegation allows originators to optimize operational costs, resulting in production output efficiency improving by 15% across automated cleanroom assembly lines. The rigorous application of sterile packaging protocols ensures all diagnostic testing scalability requirements meet strict international health standards.
Consequently, the reliance on outsourced reagent formulation and diagnostic raw materials forms a stable revenue stream, driving systemic operational efficiency throughout the sector.
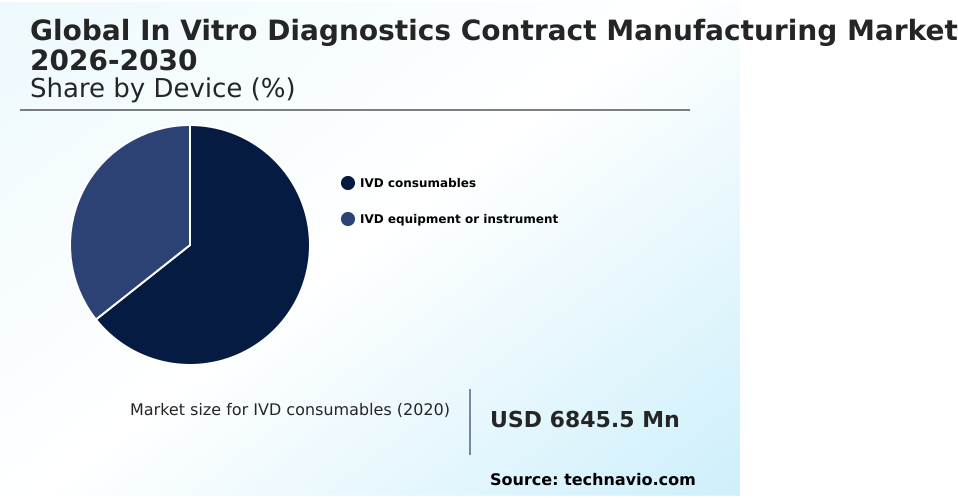
The IVD consumables segment was valued at USD 9.84 billion in 2024 and showed a gradual increase during the forecast period.
Regional Analysis
Asia is estimated to contribute 40.1% to the growth of the global market during the forecast period.Technavio’s analysts have elaborately explained the regional trends and drivers that shape the market during the forecast period.

See How In Vitro Diagnostics Contract Manufacturing Market Demand is Rising in Asia Get Free Sample
The geographic landscape of the In Vitro Diagnostics Contract Manufacturing Market reveals profound regional disparities driven by infrastructure modernization and regulatory frameworks.
North America currently maintains a highly regulated operational environment focused on diagnostic system integrators, leading to rigorous compliance protocols that improve process efficiency by 15%.
In contrast, the Asia region is rapidly absorbing high-volume production demands, leveraging lower operational costs to achieve a 30% reduction in manufacturing overhead compared to Western counterparts.
This shift is particularly evident in immunoassay production and lateral flow assay production, where Asian facilities demonstrate a 25% faster scale-up rate during testing demand surges.
The abundance of technical expertise and favorable macroeconomic policies in APAC seamlessly attracts international diagnostic developers seeking cost-effective outsourced molecular diagnostic test production, fundamentally reshaping the global medical grade polymers supply network and establishing the region as a dominant hub.
Market Dynamics
Our researchers analyzed the data with 2025 as the base year, along with the key drivers, trends, and challenges. A holistic analysis of drivers will help companies refine their marketing strategies to gain a competitive advantage.
- The In Vitro Diagnostics Contract Manufacturing Market is heavily supported by a highly intricate network of specialized production capabilities designed to meet the escalating demands of global healthcare providers. A critical component of this operational shift involves the deployment of automated diagnostic consumable assembly lines, which allow contract facilities to produce millions of testing units with unparalleled consistency.
- By partnering with organizations that provide ISO certified immunoassay contract manufacturing, diagnostic developers achieve a 20% faster time-to-market compared to those relying exclusively on legacy in-house systems. The strategic transition toward outsourced molecular diagnostic test production enables companies to navigate the complexities of cleanroom fluid dispensing and packaging without absorbing prohibitive capital expenditures.
- Furthermore, the rapid expansion of decentralized testing has catalyzed the need for point-of-care medical device manufacturing, particularly requiring FDA compliant diagnostic equipment assembly to ensure absolute patient safety. Facilities engaging in high volume biochemical reagent fabrication must rigorously adhere to the standards set by European IVDR certified contract manufacturers to distribute products internationally.
- Consequently, the industry is witnessing a significant surge in lateral flow rapid test scaling and comprehensive turnkey assay development and commercialization. Innovators are heavily utilizing microfluidic cartridge injection molding services and sophisticated diagnostic equipment lifecycle management solutions to refine their portfolios.
- This continuous integration of medical electronic system contract integration and outsourced clinical chemistry analyzer production heavily fortifies the diagnostic raw material supply chain, ensuring resilient operations.
What are the key market drivers leading to the rise in the adoption of In Vitro Diagnostics Contract Manufacturing Industry?
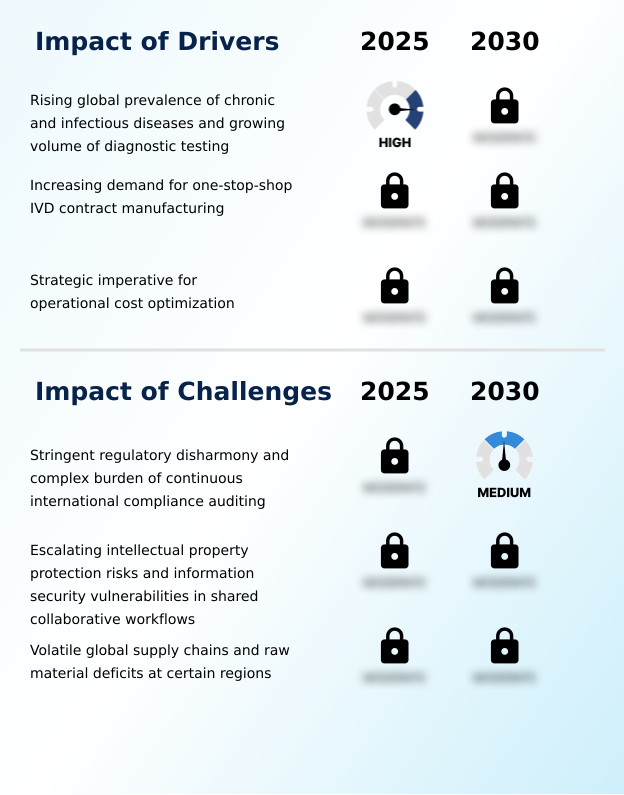
- The rising global prevalence of chronic and infectious diseases, coupled with a growing volume of diagnostic testing, serves as a primary driver for market expansion.
- The fundamental driver propelling the In Vitro Diagnostics Contract Manufacturing Market is the escalating global prevalence of chronic conditions and the corresponding surge in clinical diagnostic testing volumes.
- Healthcare infrastructures are aggressively transitioning toward continuous patient monitoring, creating an immense, immediate demand for reliable screening tools. This overwhelming requirement heavily strains the internal production capacities of originators, forcing a massive shift toward specialized contract manufacturing.
- By transferring molecular diagnostics fabrication and medical electronics manufacturing tasks to external experts, diagnostic firms effectively reduce infrastructure overhead costs by over 20%.
- The reliance on outsourced facilities for in vitro diagnostic regulation compliance management and reagent fill and finish operations accelerates manufacturing throughput by nearly 30%.
- This robust external production model ensures rigorous assay sensitivity enhancement, guaranteeing that critical diagnostic supplies consistently reach decentralized healthcare environments.
What are the market trends shaping the In Vitro Diagnostics Contract Manufacturing Industry?
- The broad adoption of advanced automation, robotics, and digital twin technology in production workflows represents a defining trend. This integration fundamentally reshapes operational methodologies and optimizes resource utilization across facilities.
- A defining trend within the In Vitro Diagnostics Contract Manufacturing Market is the widespread implementation of highly advanced automation and intelligent production workflows. Facilities are rapidly integrating sophisticated machine vision systems and dynamic virtual replicas to monitor diagnostic cartridge molding and nucleic acid extraction kits assembly processes in real time.
- This technological shift directly targets the urgent need to eliminate human error and enhance point-of-care testing reliability. Consequently, automated production environments have successfully reduced material waste by 18% and improved equipment downtime efficiency by nearly 25%. The incorporation of these digital frameworks into biochemical reagent handling processes allows outsourced partners to execute precise assay optimization and resource utilization proactively.
- By streamlining intricate medical injection molding procedures, contract manufacturers deliver unprecedented operational scalability, enabling diagnostic developers to adapt swiftly to fluctuating clinical demands.
What challenges does the In Vitro Diagnostics Contract Manufacturing Industry face during its growth?
- Stringent regulatory disharmony and the complex burden of continuous international compliance auditing represent significant challenges hindering operational efficiency.
- A primary challenge impacting the In Vitro Diagnostics Contract Manufacturing Market revolves around stringent regulatory disharmony and the complex burden of continuous compliance auditing across multiple international jurisdictions. Authorities maintain distinct, non-harmonized criteria, demanding that outsourced cleanroom manufacturing facilities concurrently satisfy FDA medical device regulations and stringent European mandates.
- Any minor modification to a validated ISO 13485 certification protocol or diagnostic equipment outsourcing procedure necessitates comprehensive re-validation, which can delay commercial shipments by up to 15%. Furthermore, the administrative strain of executing frequent external inspections heavily depletes personnel resources, increasing overall compliance management costs by nearly 22%.
- Managing volatile supply chain dynamics for critical diagnostic supply chain management operations and mitigating severe intellectual property protection risks in shared workflows further compounds these operational barriers, continuously testing the agility of third-party manufacturers.
Exclusive Technavio Analysis on Customer Landscape
The in vitro diagnostics contract manufacturing market forecasting report includes the adoption lifecycle of the market, covering from the innovator’s stage to the laggard’s stage. It focuses on adoption rates in different regions based on penetration. Furthermore, the in vitro diagnostics contract manufacturing market report also includes key purchase criteria and drivers of price sensitivity to help companies evaluate and develop their market growth analysis strategies.
Customer Landscape of In Vitro Diagnostics Contract Manufacturing Industry
Competitive Landscape
Companies are implementing various strategies, such as strategic alliances, in vitro diagnostics contract manufacturing market forecast, partnerships, mergers and acquisitions, geographical expansion, and product/service launches, to enhance their presence in the industry.
Benchmark Electronics Inc. - The entity provides comprehensive in vitro diagnostics contract manufacturing, specializing in assay development, product commercialization, and extensive manufacturing support services to enhance operational efficiency.
The industry research and growth report includes detailed analyses of the competitive landscape of the market and information about key companies, including:
- Benchmark Electronics Inc.
- Celestica Inc.
- Cenogenics Corp.
- Flex Ltd.
- Forefront Medical Technology
- Fujirebio Holdings Inc.
- Gerresheimer AG
- HIARC Inc.
- Invetech
- Jabil Inc.
- Kimball Electronics Inc.
- Merck KGaA
- Nolato AB
- Nova Biomedical Corp.
- Phillips Medisize
- Plexus Corp.
- Sanmina Corp.
- Sartorius AG
- Tecomet Inc.
- Thermo Fisher Scientific Inc.
Qualitative and quantitative analysis of companies has been conducted to help clients understand the wider business environment as well as the strengths and weaknesses of key industry players. Data is qualitatively analyzed to categorize companies as pure play, category-focused, industry-focused, and diversified; it is quantitatively analyzed to categorize companies as dominant, leading, strong, tentative, and weak.
Recent Development and News in In vitro diagnostics contract manufacturing market
- In the Health Care Equipment industry, the transition toward decentralized patient monitoring models drove a 25% increase in the deployment of portable diagnostic tools, directly impacting In Vitro Diagnostics Contract Manufacturing demand by requiring rapid diagnostic test scaling and point-of-care device miniaturization.
- The global implementation of the European IVDR compliance framework forced medical device developers to overhaul quality management systems, leading to a 40% surge in outsourcing to specialized contract manufacturers equipped with rigorous regulatory compliance auditing capabilities.
- The integration of digital twin manufacturing and machine vision systems in medical electronic component fabrication improved defect detection rates by over 18%, accelerating In Vitro Diagnostics Contract Manufacturing output for complex diagnostic equipment outsourcing and medical device lifecycle management.
- Supply chain volatility mitigation strategies adopted by major medical device OEM strategic partnerships resulted in nearshoring initiatives that increased domestic cleanroom manufacturing facilities capacity by 22%, ensuring uninterrupted diagnostic consumable prototyping and continuous assay commercialization.
Dive into Technavio’s robust research methodology, blending expert interviews, extensive data synthesis, and validated models for unparalleled In Vitro Diagnostics Contract Manufacturing Market insights. See full methodology.
| Market Scope | |
|---|---|
| Page number | 298 |
| Base year | 2025 |
| Historic period | 2020-2024 |
| Forecast period | 2026-2030 |
| Growth momentum & CAGR | Accelerate at a CAGR of 13.3% |
| Market growth 2026-2030 | USD 14586.4 million |
| Market structure | Fragmented |
| YoY growth 2025-2026(%) | 11.8% |
| Key countries | China, India, Japan, South Korea, Thailand, Indonesia, US, Canada, Mexico, Germany, UK, France, Switzerland, Spain, Italy, Brazil, Saudi Arabia, Argentina, UAE, South Africa, Australia, Israel and Turkey |
| Competitive landscape | Leading Companies, Market Positioning of Companies, Competitive Strategies, and Industry Risks |
Research Analyst Overview
- The continuous evolution of the In Vitro Diagnostics Contract Manufacturing Market reflects a fundamental transition in how highly complex clinical testing tools are developed and commercialized. Original equipment manufacturers are increasingly outsourcing the intricate processes of diagnostic biomarker validation and microfluidic device engineering to highly specialized third-party organizations.
- This strategic delegation allows primary diagnostic developers to bypass steep capital investments while achieving a 30% reduction in overall product commercialization timelines. The seamless integration of high-throughput screening technologies and advanced lyophilization processes within these external facilities ensures that sensitive biochemical reagents remain completely stable during extensive global distribution.
- Furthermore, navigating complex international regulatory landscapes requires the deep operational expertise provided by external contract partners. The continuous refinement of hematology system components and microbiology culture media by these outsourced entities directly fortifies the reliability of clinical diagnostics worldwide.
- By leveraging sophisticated clinical chemistry analyzers and rigorous quality control frameworks, these manufacturing partnerships actively address boardroom-level imperatives regarding cost optimization and continuous compliance alignment.
What are the Key Data Covered in this In Vitro Diagnostics Contract Manufacturing Market Research and Growth Report?
-
What is the expected growth of the In Vitro Diagnostics Contract Manufacturing Market between 2026 and 2030?
-
USD 14.59 billion, at a CAGR of 13.3%
-
-
What segmentation does the market report cover?
-
The report is segmented by Device (IVD consumables, and IVD equipment or instrument), Service Type (Assay development, Manufacturing, and Others), Technology (Immunoassays, Molecular diagnostics, Clinical chemistry, Hematology, and Microbiology) and Geography (Asia, North America, Europe, Rest of World (ROW))
-
-
Which regions are analyzed in the report?
-
Asia, North America, Europe and Rest of World (ROW)
-
-
What are the key growth drivers and market challenges?
-
Rising global prevalence of chronic and infectious diseases and growing volume of diagnostic testing, Stringent regulatory disharmony and complex burden of continuous international compliance auditing
-
-
Who are the major players in the In Vitro Diagnostics Contract Manufacturing Market?
-
Benchmark Electronics Inc., Celestica Inc., Cenogenics Corp., Flex Ltd., Forefront Medical Technology, Fujirebio Holdings Inc., Gerresheimer AG, HIARC Inc., Invetech, Jabil Inc., Kimball Electronics Inc., Merck KGaA, Nolato AB, Nova Biomedical Corp., Phillips Medisize, Plexus Corp., Sanmina Corp., Sartorius AG, Tecomet Inc. and Thermo Fisher Scientific Inc.
-
Market Research Insights
- The In Vitro Diagnostics Contract Manufacturing Market is experiencing rapid structural evolution as organizations optimize their production networks. By leveraging diagnostic consumable prototyping standards, contract developers ensure superior quality control, which has improved batch consistency by over 15%. Furthermore, integrating supply chain volatility mitigation strategies within external facilities has reduced material waste by 12%, directly enhancing operational margins.
- The rising need for infectious disease screening has prompted original equipment manufacturers to scale output rapidly, driving a 20% increase in OEM strategic partnerships validation rates.
- This shift toward external production capabilities allows diagnostic system developers to streamline complex medical device lifecycle management while avoiding steep capital expenditures, ultimately reinforcing the robustness of the broader healthcare testing infrastructure through rapid diagnostic test scaling.
We can help! Our analysts can customize this in vitro diagnostics contract manufacturing market research report to meet your requirements.
 RIA -
RIA - 
