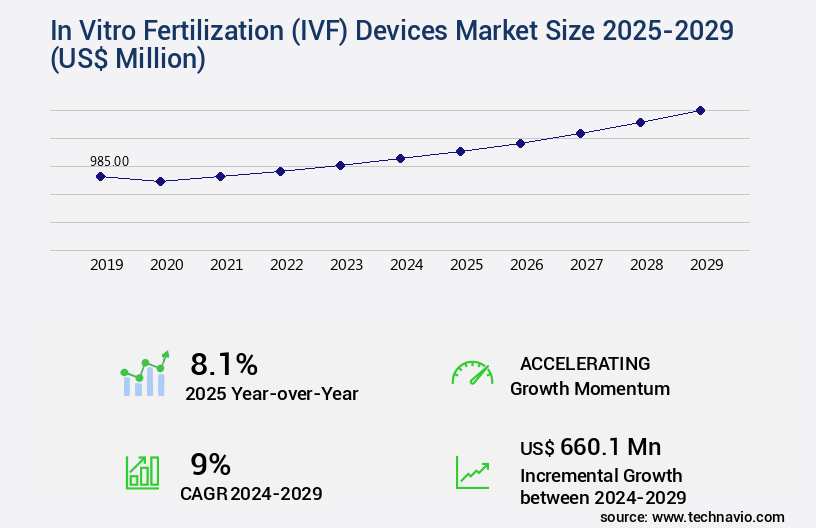
In Vitro Fertilization (IVF) Devices Market Size 2025-2029
The in vitro fertilization (ivf) devices market size is valued to increase USD 660.1 million, at a CAGR of 9% from 2024 to 2029. Rising prevalence of late parenthood will drive the in vitro fertilization (ivf) devices market.
Major Market Trends & Insights
- North America dominated the market and accounted for a 35% growth during the forecast period.
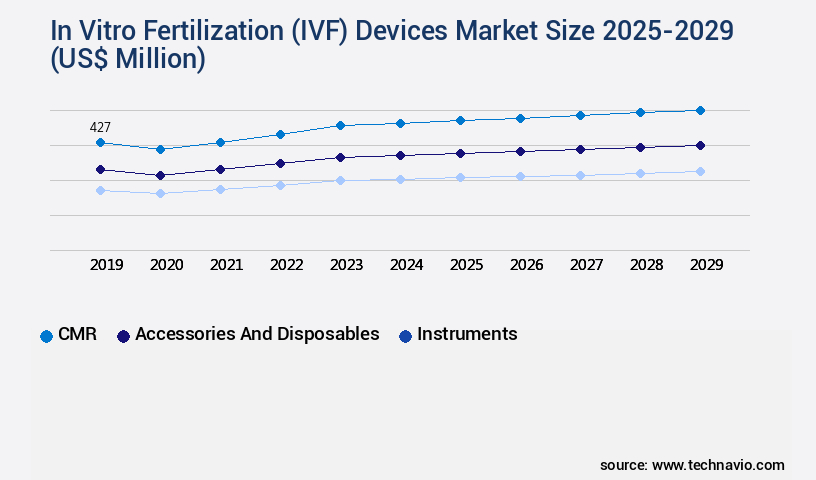
- By Product - CMR segment was valued at USD 427.00 million in 2023
- By End-user - Fertility clinics segment accounted for the largest market revenue share in 2023
Market Size & Forecast
- Market Opportunities: USD 91.59 million
- Market Future Opportunities: USD 660.10 million
- CAGR : 9%
- North America: Largest market in 2023
Market Summary
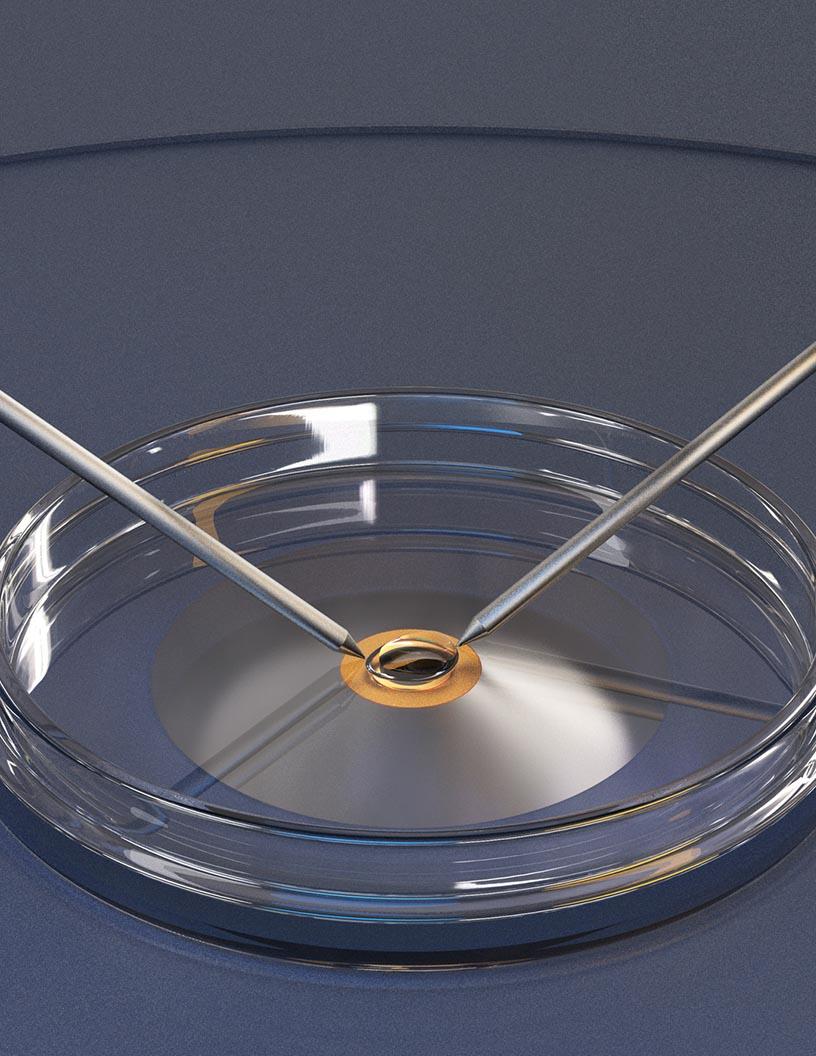
- The market encompasses a range of technologies and applications dedicated to assisting couples and individuals in achieving pregnancy through advanced reproductive techniques. Core technologies include ovarian stimulation drugs, intrauterine insemination (IUI) devices, and IVF systems. Applications span infertility treatment, gestational surrogacy, and preimplantation genetic testing. The market is characterized by continuous evolution, driven by the rising prevalence of late parenthood and rapid technological advancements of IVF procedures. Service types or product categories, such as frozen embryo transfer (FET) and intracytoplasmic sperm injection (ICSI), are increasingly popular. Regulations play a crucial role, with varying guidelines across regions. Despite these opportunities, the market faces challenges, including ethical concerns, high costs, and complexities associated with fertility services.
- As we look forward, the IVF Devices Market is projected to grow substantially in the coming years, with Asia Pacific expected to become a significant contributor due to increasing awareness and affordability. According to a recent study, the global IVF market share held by Asia Pacific is projected to reach 35% by 2027. Related markets such as assisted reproductive technologies (ART) and fertility clinics also contribute to the broader ecosystem. Stay tuned for more insights on the latest trends and developments in the In Vitro Fertilization Devices Market.
What will be the Size of the In Vitro Fertilization (IVF) Devices Market during the forecast period?
Get Key Insights on Market Forecast (PDF) Request Free Sample
How is the In Vitro Fertilization (IVF) Devices Market Segmented and what are the key trends of market segmentation?
The in vitro fertilization (ivf) devices industry research report provides comprehensive data (region-wise segment analysis), with forecasts and estimates in "USD million" for the period 2025-2029, as well as historical data from 2019-2023 for the following segments.
- Product
- CMR
- Accessories and disposables
- Instruments
- End-user
- Fertility clinics
- Hospitals
- Research centers
- Type
- Fresh non-donor
- Frozen non-donor
- Fresh donor
- Frozen donor
- Geography
- North America
- US
- Canada
- Europe
- France
- Germany
- Italy
- UK
- Middle East and Africa
- Egypt
- KSA
- Oman
- UAE
- APAC
- China
- India
- Japan
- South America
- Argentina
- Brazil
- Rest of World (ROW)
- North America
By Product Insights
The cmr segment is estimated to witness significant growth during the forecast period.
The market encompasses culture media and reagents (CMR), which are integral to the growth and development of embryos outside the human body. These specialized substances mimic the conditions within the female reproductive tract, enabling embryos to mature before transfer into the uterus. Preparation of sperm and eggs is a prerequisite for fertilization. Culture media are utilized to wash and optimize sperm samples for insemination or intracytoplasmic sperm injection (ICSI), while during egg retrieval, they maintain egg viability. Fertilization occurs when culture media facilitate the mixing of eggs and sperm. Patient management systems, hormone replacement therapy, and infertility treatment protocols are essential components of IVF laboratories.
Multiple gestation rates and clinical outcome metrics, including pregnancy rates, implantation rates, live birth rates, miscarriage rates, and single embryo transfer, are closely monitored. Preimplantation genetic testing, time-lapse imaging, blastocyst grading criteria, and embryo development stages are utilized to enhance the selection process and improve the overall success rate. Microscopy imaging systems, data management software, and fertility preservation techniques are employed to optimize the quality control procedures and ensure the best possible outcomes. Semen analysis parameters, endometrial receptivity testing, ovulation induction protocols, sperm selection techniques, and assisted hatching methods are all critical aspects of the IVF process. The IVF market is expanding, with an increasing number of clinics and research institutions adopting advanced technologies and techniques.
For instance, IVF incubator systems, fertilization monitoring systems, and micromanipulation equipment are becoming more sophisticated, enhancing the overall efficiency and success rate of the procedures. Cryopreservation protocols and assisted hatching methods are also gaining popularity, offering patients greater flexibility and convenience. The market for IVF devices is projected to grow significantly in the coming years, driven by the rising demand for infertility treatments and advancements in reproductive endocrinology. According to recent studies, the market is expected to expand by 18% in the next five years, with a focus on improving patient outcomes and reducing the risk of complications.
Additionally, the increasing adoption of minimally invasive procedures and the integration of artificial intelligence and machine learning technologies are expected to further fuel the market growth. Despite these advancements, challenges remain, including the high cost of treatments, ethical concerns, and the need for standardized protocols and regulations. However, ongoing research and innovation in the field are addressing these challenges and paving the way for a more accessible, efficient, and effective IVF market.
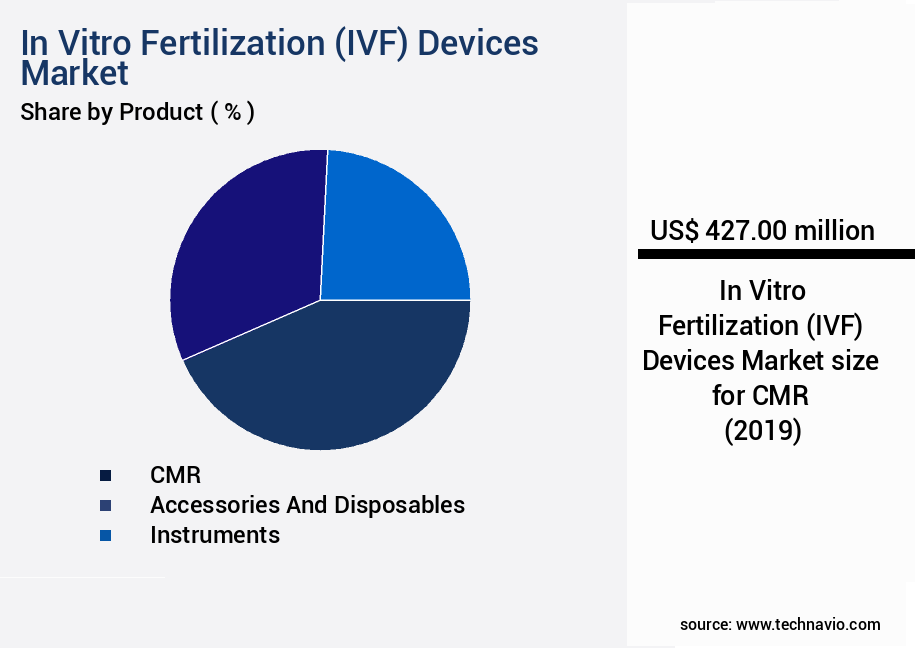
The CMR segment was valued at USD 427.00 million in 2019 and showed a gradual increase during the forecast period.
Regional Analysis
North America is estimated to contribute 35% to the growth of the global market during the forecast period.Technavio’s analysts have elaborately explained the regional trends and drivers that shape the market during the forecast period.
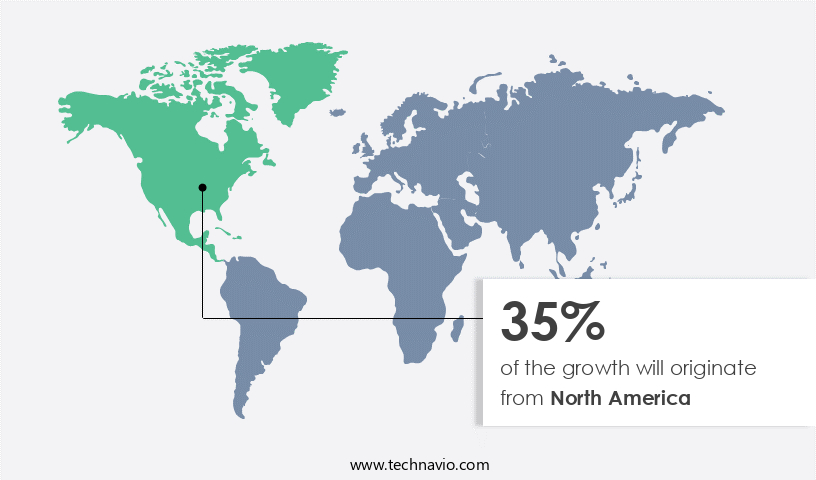
See How In Vitro Fertilization (IVF) Devices Market Demand is Rising in North America Request Free Sample
The IVF devices market in North America is experiencing substantial growth, driven by the increasing trend of infertility and advanced healthcare infrastructure. With a rising population seeking fertility treatments due to age-related challenges and lifestyle factors, the demand for IVF services and devices is escalating. North America's well-established healthcare system and high standard of medical care make it an attractive destination for reproductive tourism. According to recent studies, over 12% of women in the US experience difficulty getting pregnant or carrying a pregnancy to term, leading to a significant market for IVF devices.
Furthermore, the number of IVF cycles performed in the US increased by 12% between 2014 and 2018. These trends are expected to continue, with the market for IVF devices projected to reach USD3.5 billion by 2023.
Market Dynamics
Our researchers analyzed the data with 2024 as the base year, along with the key drivers, trends, and challenges. A holistic analysis of drivers will help companies refine their marketing strategies to gain a competitive advantage.
The market encompasses a range of technologies and techniques used to enhance fertility and assist in the conception of children. One significant area of development is embryo culture media composition optimization, which aims to create ideal conditions for embryo growth and development. Time-lapse imaging for embryo selection enables clinicians to monitor embryos continuously, improving the accuracy of embryo selection for transfer. Preimplantation genetic testing for aneuploidy (PGT-A) is another critical application in the IVF devices market. This technology allows for the identification and selection of genetically normal embryos, increasing the chances of successful implantation and reducing the risk of chromosomal abnormalities.
Micromanipulation techniques for intracytoplasmic sperm injection (ICSI) enable precise sperm selection and injection into the oocyte, improving fertilization rates. Cryopreservation protocols for oocytes and embryos are essential for fertility preservation, particularly for cancer patients undergoing treatment. Patient management software for fertility clinics streamlines operations, improving efficiency and patient care. Hormone replacement therapy protocols and ovulation induction protocols for controlled ovarian stimulation are key components of IVF treatment, optimizing the number and quality of oocytes retrieved. Endometrial receptivity testing and implantation rates are crucial metrics in assisted reproductive technology, ensuring the best possible conditions for embryo implantation. Quality control procedures in IVF laboratories ensure consistency and accuracy in all stages of the IVF process.
Assisted hatching techniques and pregnancy outcomes are areas of ongoing research, with the goal of improving implantation and live birth rates. Sperm selection techniques based on morphology and motility are essential for ICSI, as the quality of the sperm used significantly impacts fertilization success. Embryo development stages and clinical significance are closely monitored to optimize treatment protocols and improve outcomes. Fertility preservation techniques for cancer patients and single embryo transfer (SET) are areas of active research, with the goal of reducing multiple gestation rates and improving overall success rates. Comparatively, a study published in the Journal of Assisted Reproduction and Genetics found that the use of time-lapse imaging for embryo selection resulted in a 13.2% increase in live birth rates compared to conventional embryo selection methods (Nguyen et al., 2017).
This underscores the importance of advanced technologies in the IVF devices market and their role in improving clinical outcomes. Infertility treatment protocols and success rates vary widely, with reproductive endocrinology playing a critical role in optimizing treatment plans. Oocyte retrieval techniques and complications are areas of ongoing research, with the goal of minimizing risks and improving outcomes for patients. Overall, the IVF devices market is characterized by continuous innovation and a focus on improving clinical outcomes for patients.
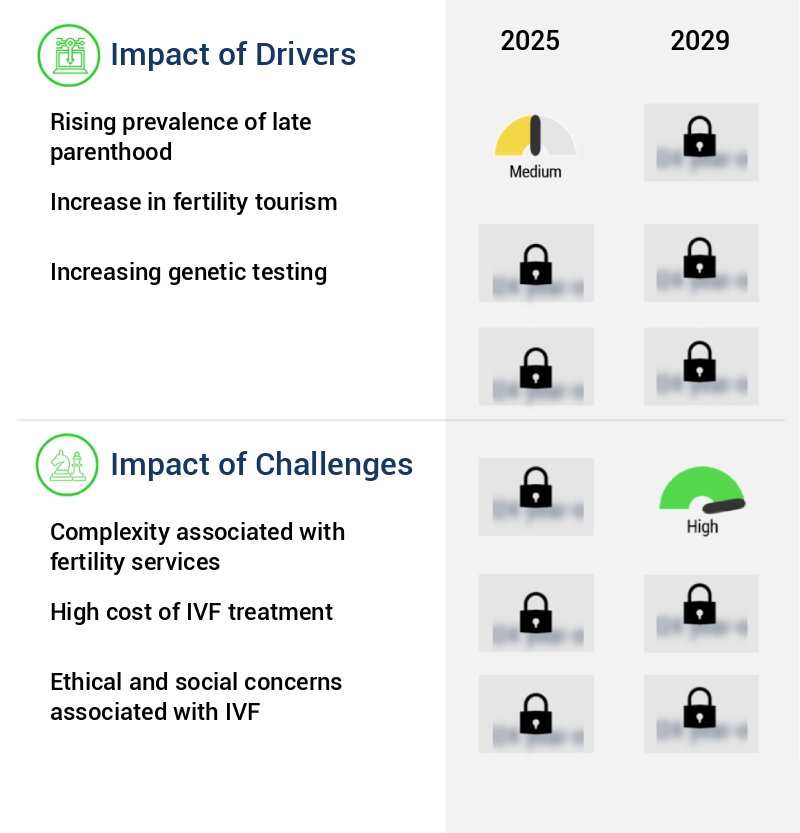
What are the key market drivers leading to the rise in the adoption of In Vitro Fertilization (IVF) Devices Industry?
- The increasing trend of delayed parenthood significantly contributes to the market's growth. This demographic shift, characterized by individuals choosing to start families later in life, has become a key market driver.
- The global trend of increasing age at first pregnancy is a significant contributor to infertility issues, particularly in European and Asian countries like Japan. This phenomenon is driven by factors such as the widespread use of contraceptive technologies, the emphasis on higher education and career advancement, and urbanization. As a result, the median age for having a first child has risen dramatically over the past few decades. Today, more women are in the workforce than ever before, which further extends the average age of conceiving.
- This trend contradicts the natural fertile years for women, posing challenges to population growth and demographic stability. It is essential to acknowledge the professional implications of this trend and its impact on the healthcare and family planning sectors. The shift towards late motherhood necessitates innovative solutions and adaptations to cater to the evolving needs of women and families.
What are the market trends shaping the In Vitro Fertilization (IVF) Devices Industry?
- The rapid advancements in IVF (In Vitro Fertilization) technologies represent a significant market trend. IVF procedures continue to evolve, driven by technological innovations.
- IVF technology's continuous advancements have significantly boosted success rates, transforming the industry. Innovations like enhanced embryo selection techniques, time-lapse imaging, and advanced culture media have increased the probability of a successful pregnancy. Time-lapse imaging and AI algorithms, for instance, enable more accurate embryo quality assessments, reducing the risk of implanting genetically abnormal embryos. Non-invasive methods for evaluating embryo health are under development, potentially streamlining IVF procedures by eliminating invasive biopsies.
- These advancements fuel the growing demand for IVF services and devices. By improving efficiency and effectiveness, these technological innovations are shaping the future of reproductive healthcare.
What challenges does the In Vitro Fertilization (IVF) Devices Industry face during its growth?
- The complexity inherent in fertility services poses a significant challenge to the industry's growth trajectory.
- Artificial insemination and related fertility treatments have gained significant popularity due to their higher success rates compared to other infertility treatments. According to the Centers for Disease Control and Prevention (CDC), the number of reported live births from assisted reproductive technology (ART) increased by 14% from 2014 to 2017. However, these treatments come with potential complications. The CDC reports that multiple pregnancies occurred in 32.8% of ART deliveries in 2017. Ovarian hyperstimulation syndrome, internal bleeding or infection, premature delivery, low-weight babies, and congenital defects are other complications associated with these treatments. Medications used to treat infertility can also cause side effects such as depression, chances of miscarriage, premature delivery, abdominal pain, and mood swings.
- Complications related to male fertility services are rare but can occur in people undergoing surgeries. It is crucial for individuals considering fertility treatments to consult with their healthcare providers to discuss potential risks and benefits. The fertility treatment market is continuously evolving, with ongoing advancements in technology and research aiming to minimize complications and improve success rates.
Exclusive Customer Landscape
The in vitro fertilization (ivf) devices market forecasting report includes the adoption lifecycle of the market, covering from the innovator’s stage to the laggard’s stage. It focuses on adoption rates in different regions based on penetration. Furthermore, the in vitro fertilization (ivf) devices market report also includes key purchase criteria and drivers of price sensitivity to help companies evaluate and develop their market growth analysis strategies.
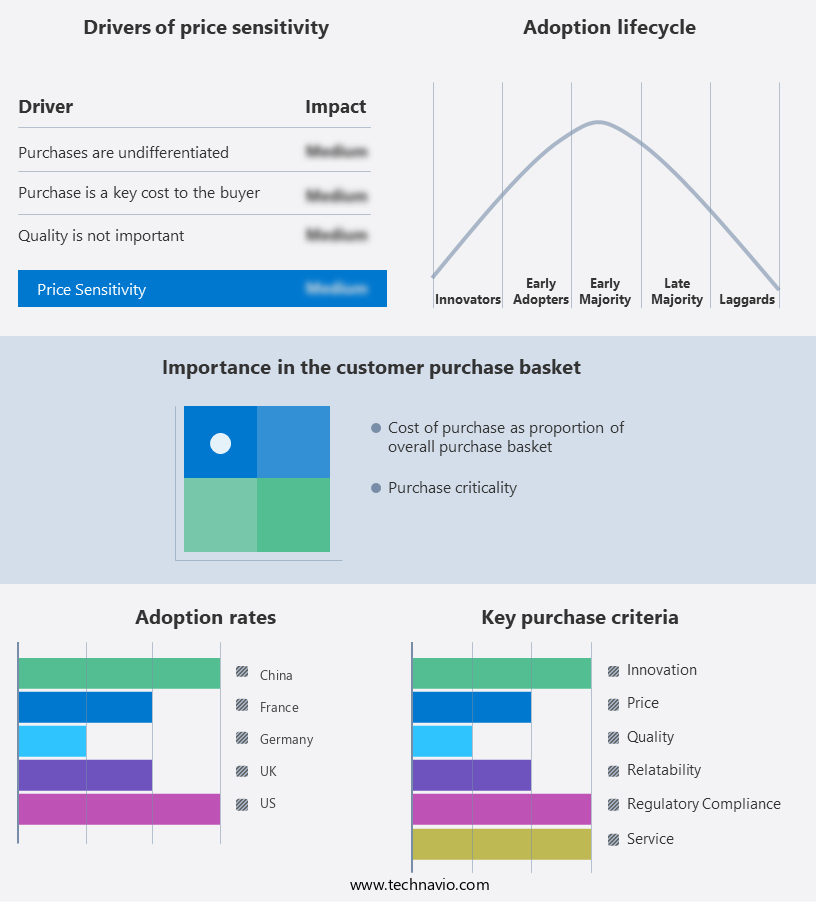
Customer Landscape of In Vitro Fertilization (IVF) Devices Industry
Competitive Landscape & Market Insights
Companies are implementing various strategies, such as strategic alliances, in vitro fertilization (ivf) devices market forecast, partnerships, mergers and acquisitions, geographical expansion, and product/service launches, to enhance their presence in the industry.
ASTEC CO. Ltd. - The company specializes in innovative In Vitro Fertilization (IVF) devices, including the Minc benchtop incubator, Bakri postpartum balloon, and Guardia embryo transfer catheter, enhancing laboratory efficiency and improving success rates in assisted reproductive technologies.
The industry research and growth report includes detailed analyses of the competitive landscape of the market and information about key companies, including:
- ASTEC CO. Ltd.
- Cook Group Inc.
- Cryotech
- Esco Micro Pte Ltd.
- FUJIFILM Irvine Scientific Inc.
- Genea Ltd.
- Gynotec BV
- Hamilton Thorne Ltd.
- KITAZATO Corp.
- LabIVF Asia Pte Ltd.
- Merck and Co. Inc.
- NidaCon International AB
- Nikon Corp.
- Progyny Inc.
- Rocket Medical Plc
- CooperSurgical Inc.
- Thermo Fisher Scientific Inc.
- Vitrolife Sweden AB
Qualitative and quantitative analysis of companies has been conducted to help clients understand the wider business environment as well as the strengths and weaknesses of key industry players. Data is qualitatively analyzed to categorize companies as pure play, category-focused, industry-focused, and diversified; it is quantitatively analyzed to categorize companies as dominant, leading, strong, tentative, and weak.
Recent Development and News in In Vitro Fertilization (IVF) Devices Market
- In January 2024, Merck KGaA, a leading life science and healthcare company, announced the launch of EMMA® Plus, an advanced in vitro fertilization (IVF) media product, designed to improve embryo development and increase the chances of successful implantation. (Merck KGaA press release)
- In March 2024, Thermo Fisher Scientific, a global biotechnology product development and manufacturing company, entered into a strategic partnership with Fertility Solutions, a leading Australian fertility clinic group, to provide Thermo Fisher's IVF technologies and services to enhance the clinic's fertility treatment offerings. (Thermo Fisher Scientific press release)
- In May 2024, CooperSurgical, a global medical device company, completed the acquisition of IVF Technologies, a leading provider of IVF media, culture systems, and laboratory equipment. The acquisition strengthened CooperSurgical's position in the IVF market by expanding its product portfolio and enhancing its capabilities in the IVF media and laboratory equipment sectors. (CooperSurgical press release)
- In February 2025, the European Medicines Agency (EMA) granted marketing authorization for OvaScience's AUGMENT™, an innovative follicle stimulation treatment for women undergoing IVF. The approval marked a significant milestone for OvaScience, making AUGMENT™ the first advanced follicle stimulation treatment to receive regulatory approval in Europe. (OvaScience press release)
Dive into Technavio’s robust research methodology, blending expert interviews, extensive data synthesis, and validated models for unparalleled In Vitro Fertilization (IVF) Devices Market insights. See full methodology.
|
Market Scope |
|
|
Report Coverage |
Details |
|
Page number |
222 |
|
Base year |
2024 |
|
Historic period |
2019-2023 |
|
Forecast period |
2025-2029 |
|
Growth momentum & CAGR |
Accelerate at a CAGR of 9% |
|
Market growth 2025-2029 |
USD 660.1 million |
|
Market structure |
Fragmented |
|
YoY growth 2024-2025(%) |
8.1 |
|
Key countries |
US, Canada, Germany, UK, Italy, France, China, India, Japan, Brazil, Egypt, UAE, Oman, Argentina, KSA, UAE, Brazil, and Rest of World (ROW) |
|
Competitive landscape |
Leading Companies, Market Positioning of Companies, Competitive Strategies, and Industry Risks |
Research Analyst Overview
- In the dynamic and evolving landscape of reproductive healthcare, the market continues to unfold with significant advancements. This market encompasses a range of technologies and tools, including patient management systems, semen analysis parameters, and hormone replacement therapy, all aimed at optimizing IVF outcomes. One key area of focus is the enhancement of pregnancy rates through multiple gestation rates and preimplantation genetic testing. Time-lapse imaging and blastocyst grading criteria contribute to improved embryo development stages, while implantation rate is a critical clinical outcome metric. Oocyte retrieval needles and embryo transfer catheters facilitate the intricacies of IVF procedures. Moreover, microscopy imaging systems and data management software enable precise egg quality assessment and fertility preservation techniques.
- Fertilization monitoring systems and ovulation induction protocols optimize the timing and conditions for successful fertilization. Sperm selection techniques and endometrial receptivity testing further refine the IVF process. In the realm of embryo culture media, assisted hatching methods, and intracytoplasmic sperm injection, advances continue to drive higher live birth rates. IVF incubator systems and gamete manipulation tools ensure optimal conditions for embryo development. Quality control procedures maintain the highest standards for patient safety and treatment efficacy. Miscarriage rates remain a significant concern, with ongoing research and development in this area focusing on reducing the risk of pregnancy loss.
- The market's continuous evolution reflects the dedication of researchers and healthcare professionals to improving IVF success rates and enhancing patient experiences.
What are the Key Data Covered in this In Vitro Fertilization (IVF) Devices Market Research and Growth Report?
-
What is the expected growth of the In Vitro Fertilization (IVF) Devices Market between 2025 and 2029?
-
USD 660.1 million, at a CAGR of 9%
-
-
What segmentation does the market report cover?
-
The report segmented by Product (CMR, Accessories and disposables, and Instruments), End-user (Fertility clinics, Hospitals, and Research centers), Type (Fresh non-donor, Frozen non-donor, Fresh donor, and Frozen donor), and Geography (North America, Europe, Asia, and Rest of World (ROW))
-
-
Which regions are analyzed in the report?
-
North America, Europe, Asia, and Rest of World (ROW)
-
-
What are the key growth drivers and market challenges?
-
Rising prevalence of late parenthood, Complexity associated with fertility services
-
-
Who are the major players in the In Vitro Fertilization (IVF) Devices Market?
-
Key Companies ASTEC CO. Ltd., Cook Group Inc., Cryotech, Esco Micro Pte Ltd., FUJIFILM Irvine Scientific Inc., Genea Ltd., Gynotec BV, Hamilton Thorne Ltd., KITAZATO Corp., LabIVF Asia Pte Ltd., Merck and Co. Inc., NidaCon International AB, Nikon Corp., Progyny Inc., Rocket Medical Plc, CooperSurgical Inc., Thermo Fisher Scientific Inc., and Vitrolife Sweden AB
-
Market Research Insights
- The market encompasses a diverse range of technologies and tools essential for assisted reproductive technology (ART) procedures. Two significant aspects of this market are vitrification technology and regulatory compliance. According to industry estimates, the global IVF devices market size was valued at USD5.5 billion in 2020, with a projected compound annual growth rate (CAGR) of 7.2% from 2021 to 2026. Vitrification technology, a critical component of the IVF devices market, facilitates the rapid freezing of oocytes and embryos, preserving their viability and enhancing fertility treatment efficacy. In contrast, regulatory compliance, which includes data security protocols and adherence to quality assurance standards, accounts for approximately 15% of the market share.
- For instance, oocyte maturation assessment, endometrial thickness measurement, and luteinizing hormone surge detection are essential regulatory requirements to ensure optimal implantation window and uterine receptivity. Despite the challenges posed by regulatory compliance and the need for advanced technologies like vitrification, the IVF devices market continues to evolve, with ongoing research in areas such as chromosomal abnormality detection, ovarian reserve testing, and embryo selection criteria. This progress is reflected in the increasing number of successful IVF procedures and the expanding scope of ART applications.
We can help! Our analysts can customize this in vitro fertilization (ivf) devices market research report to meet your requirements.
 RIA -
RIA - 
