Assisted Reproductive Technology (Art) Market Analysis, Size, and Forecast 2024-2028: Europe (France, Germany, Netherlands, and UK), North America (US), Asia (China, India, Japan), and Rest of World (ROW)

Assisted Reproductive Technology (Art) Market Analysis, Size, and Forecast 2024-2028:
Europe (France, Germany, Netherlands, and UK), North America (US), Asia (China, India, Japan), and Rest of World (ROW)

Published: Jun 2024 168 Pages SKU: IRTNTR41430

Market Overview at a Glance

$6.30 B
Market Opportunity
4.36%
CAGR
4.11
YoY growth 2023-2024(%)

Assisted Reproductive Technology (ART ) Market Size 2024-2028

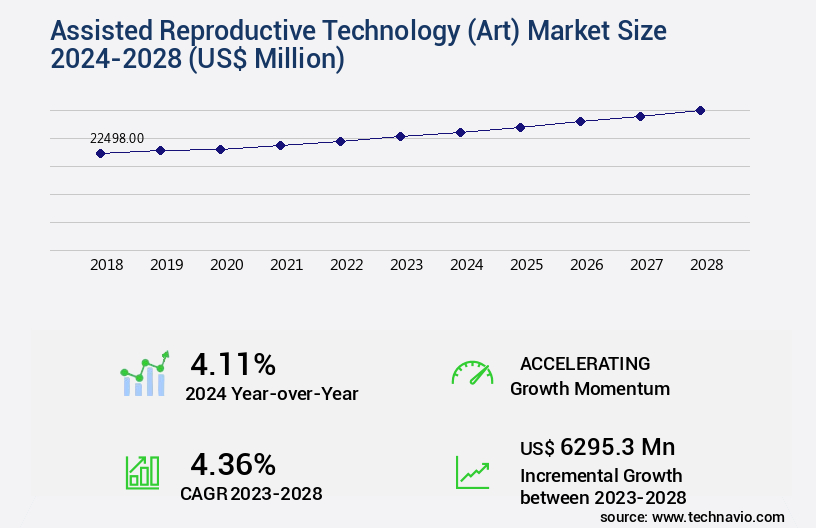
The assisted reproductive technology (ART ) market size is valued to increase by USD 6.3 billion, at a CAGR of 4.36% from 2023 to 2028. Increase in rate of infertility and obesity-related cases will drive the assisted reproductive technology (ART ) market.

Major Market Trends & Insights

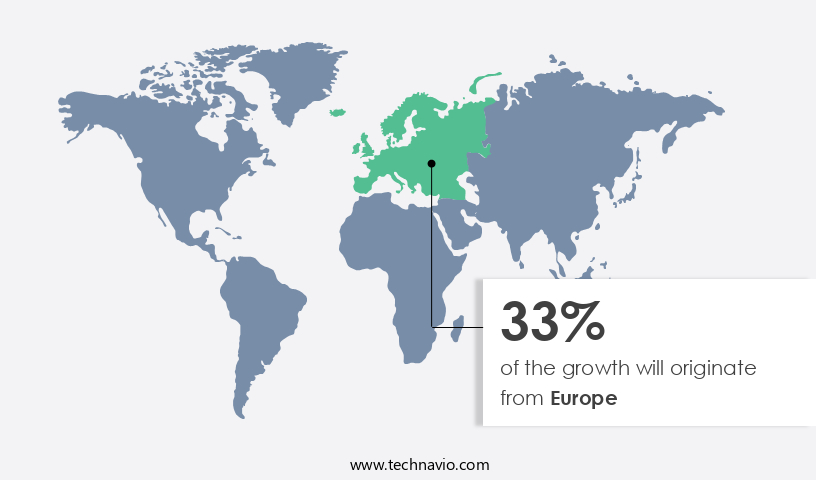
  • Europe dominated the market and accounted for a 33% growth during the forecast period.
  • By End-User - Fertility clinics segment was valued at USD 13.88 billion in 2022
  • By Type - IVF segment accounted for the largest market revenue share in 2022

Market Size & Forecast

  • Market Opportunities: USD 45.53 million
  • Market Future Opportunities: USD 6295.30 million
  • CAGR from 2023 to 2028 : 4.36%

Market Summary

  • The market: Global Trends and Challenges The market is experiencing significant growth due to the increasing prevalence of infertility and obesity-related cases, as well as the rising number of single-parent families seeking parenthood. ART , which includes in-vitro fertilization (IVF), intracytoplasmic sperm injection (ICSI), and other related techniques, offers hope to millions of couples worldwide who face fertility supplements challenges. One notable trend in the ART market is the focus on improving operational efficiency and reducing side effects of treatment. For instance, clinics are implementing advanced technologies such as time-lapse imaging and automated embryo grading systems to optimize embryo selection and increase the chances of successful implantation.
  • These innovations have led to a reduction in the number of embryos transferred per cycle, thereby decreasing the risk of multiple pregnancies and associated complications. Moreover, regulatory compliance is a significant challenge in the ART market. Strict regulations governing the use of ART , pART icularly in developing countries, can hinder market growth. For example, a clinic might face delays in obtaining necessary permits or face penalties for non-compliance. To address this challenge, some clinics are investing in compliance management systems to ensure adherence to local and international regulations. A real-world business scenario illustrates the importance of operational efficiency and compliance in the ART market.
  • A large fertility clinic implemented an automated embryo grading system, resulting in a 25% reduction in embryo transfer failures and a 15% increase in successful pregnancies. Additionally, the clinic invested in a compliance management system, enabling it to streamline regulatory reporting and reduce the risk of penalties. These improvements led to increased patient satisfaction and a stronger reputation in the market.

What will be the Size of the Assisted Reproductive Technology (ART ) Market during the forecast period?

Assisted Reproductive Technology (Art) Market Size

Get Key Insights on Market Forecast (PDF) Request Free Sample

How is the Assisted Reproductive Technology (ART ) Market Segmented ?

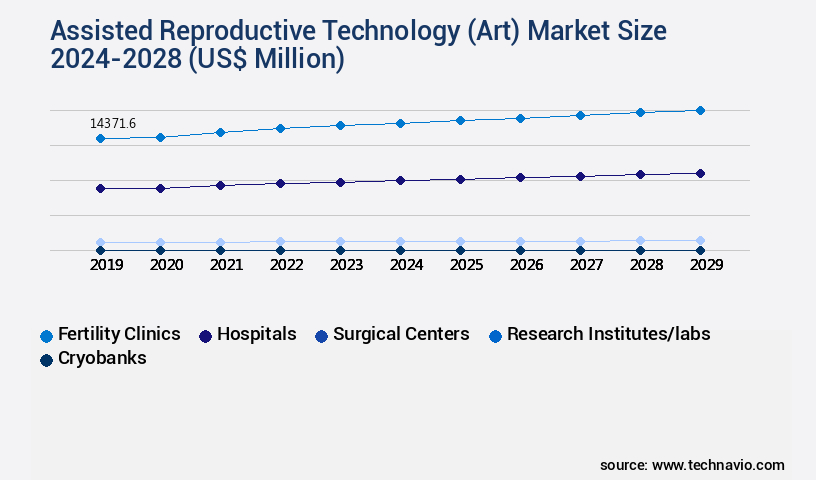
The assisted reproductive technology (ART ) industry research report provides comprehensive data (region-wise segment analysis), with forecasts and estimates in "USD million" for the period 2024-2028, as well as historical data from 2018-2022 for the following segments.

  • End-User
    • Fertility clinics
    • Hospitals
    • Surgical centers
    • Research institutes/labs
    • Cryobanks
  • Type
    • IVF
    • ART ificial insemination
    • GIFT (Gamete Intrafallopian Transfer)
    • ZIFT (Zygote Intrafallopian Transfer)
    • Surrogacy
    • Donor egg/sperm ART
  • Product
    • Instrument
    • Accessory and Disposable
    • Reagents and Media
    • Software
  • Geography
    • North America
      • US
    • Europe
      • France
      • Germany
      • Netherlands
      • UK
    • Middle East and Africa
      • UAE
    • APAC
      • China
      • India
      • Japan
    • South America
      • Brazil
    • Rest of World (ROW)

By End-User Insights

The fertility clinics segment is estimated to witness significant growth during the forecast period.

Fertility clinics dominated the global assisted reproductive technology (ART) market owing to a worldwide increase in the number of fertility centers to meet the unmet and growing demand of infertility patients. This rise has subsequently increased the consumption of ART solutions, including IVF procedures, artificial insemination, gamete intrafallopian transfer (GIFT), and zygote intrafallopian transfer (ZIFT). A key factor influencing the inflow of infertility patients is the high improvement in the pregnancy success rates, particularly as clinics optimize ovarian stimulation protocols, embryo transfer techniques, and preimplantation genetic testing (PGT).

Generally, in a fertility clinic, success rates are measured by the number of treatments carried out and the corresponding clinical pregnancy rate or live birth rate. The implantation rate, embryo morphology, and endometrial receptivity are all critical determinants of treatment efficacy and eventual success outcome. As a result, fertility clinics with higher outcomes in terms of reduced miscarriage rate, minimized multiple gestation risk, and lower ectopic pregnancy risk gain popularity not only in domestic but also in international fertility tourism markets.

Assisted Reproductive Technology (Art) Market Size

Request Free Sample

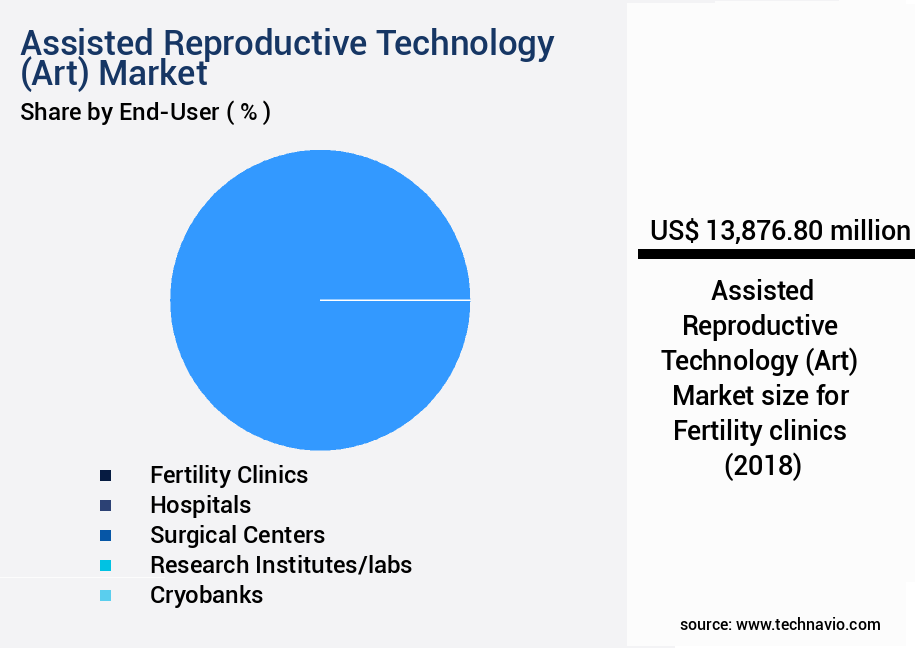
The Fertility clinics segment was valued at USD 13.88 billion in 2018 and showed a gradual increase during the forecast period.

Another major driver of ART demand is the enhancement of fertility clinic infrastructure to attract medical tourism. This includes advanced capabilities for sperm cryopreservation, egg retrieval, intracytoplasmic sperm injection (ICSI), assisted hatching, blastocyst culture, oocyte selection, and embryo biopsy. Medical tourism growth, however, remains volatile and subject to external conditions such as exchange rates and travel restrictions. Organizations such as ESHRE, ASRM, and ICMART are actively working to harmonize fertility tourism practices and reduce exploitation risks.

Clinical and patient-related factors also play a significant role. Conditions such as uterine fibroids, endometriosis, and variations in uterine lining thickness or hormone levels monitoring can impact outcomes. Similarly, sperm motility, semen parameters, sperm morphology, and sperm DNA fragmentation are crucial aspects of infertility diagnosis and semen analysis parameters in male fertility assessment. In some cases, hormone replacement therapy, ovulation induction, and accurate ovulation timing are incorporated into tailored treatment pathways.

Despite advances, stringent regulations across several countries pose challenges for the establishment of new ART centers. For example, in China, regulations mandate minimum staffing, including certified reproductive endocrinology specialists, trained laboratory personnel, and urologists, alongside infrastructure standards such as minimum lab space and specialized equipment. While such measures improve clinical oversight and patient safety, they may discourage new market entrants.

Assisted Reproductive Technology (Art) Market Size

Request Free Sample

Finally, as patients increasingly seek fertility preservation and genetic screening services, the role of genetic counselors is becoming more prominent in guiding families through risks of chromosomal abnormalities and the application of preimplantation genetic screening. Ongoing research into follicular development, in vitro maturation, and embryo quality assessment further supports innovation in ART. Ultimately, the global ART market outlook will continue to depend on balancing treatment efficacy, regulatory compliance, and the evolving needs of infertility patients.

Regional Analysis

Europe is estimated to contribute 33% to the growth of the global market during the forecast period.Technavio's analysts have elaborately explained the regional trends and drivers that shape the market during the forecast period.

Assisted Reproductive Technology (Art) Market Share by Geography

See How Assisted Reproductive Technology (ART ) Market Demand is Rising in Europe Request Free Sample

The market in Europe is experiencing significant growth, driven by the increasing number of infertility cases among the region's aging population. Italy, the UK, Germany, France, and Spain were the major contributors to the European ART market in 2023. With fertility rates hovering around 1.5 children per woman in most European countries, advanced infertility treatments have become increasingly popular. These treatments, offered by hospitals and fertility clinics, are expected to provide substantial opportunities for end-users during the forecast period. Moreover, recent years have seen a surge in awareness initiatives by both government and non-government organizations, aimed at educating people about fertility complications and their associated treatments through various media channels.

This heightened awareness is leading to an increase in the demand for ART services, further fueling market growth. According to estimates, the operational efficiency gains from these advanced treatments can save up to 30% in costs and reduce compliance risks for patients and healthcare providers alike.

Market Dynamics

Our researchers analyzed the data with 2023 as the base year, along with the key drivers, trends, and challenges. A holistic analysis of drivers will help companies refine their marketing strategies to gain a competitive advantage.

The market is experiencing significant growth due to the increasing demand for solutions to address various infertility issues. One of the key factors driving market expansion is the impact of age on In Vitro Fertilization (IVF) success rates. Advanced technologies, such as improving embryo implantation through endometrial receptivity analysis, are being adopted to enhance fertility outcomes. Another significant area of focus is reducing multiple gestations, which is achieved through optimizing ovarian stimulation and minimizing the risk of ovarian hyperstimulation. Genetic screening for IVF is also gaining popularity, with preimplantation genetic diagnosis techniques, such as Preimplantation Genetic Testing for Monogenic Disorders (PGT-M) and Preimplantation Genetic Testing for Aneuploidies (PGT-A), becoming increasingly common. Moreover, improving sperm quality is a critical aspect of ART , and advanced semen analysis techniques, as well as fertility preservation methods like cryopreservation, are being employed to address this challenge. Managing endometriosis and Polycystic Ovary Syndrome (PCOS) are also key concerns, with various treatments, such as minimally invasive surgery and advanced embryo culture systems, being utilized to improve oocyte selection methods and clinical pregnancy rates in IVF. Success rates by IVF procedure and live birth rates after IVF are significant metrics for evaluating the effectiveness of ART . Cost-effectiveness is another essential consideration, with time-lapse imaging analysis and improving semen analysis techniques contributing to more accurate diagnosis and treatment plans, ultimately leading to better outcomes and reduced healthcare costs. Overall, the ART market is continually evolving to address the diverse needs of patients and improve fertility outcomes.

Assisted Reproductive Technology (Art) Market Size

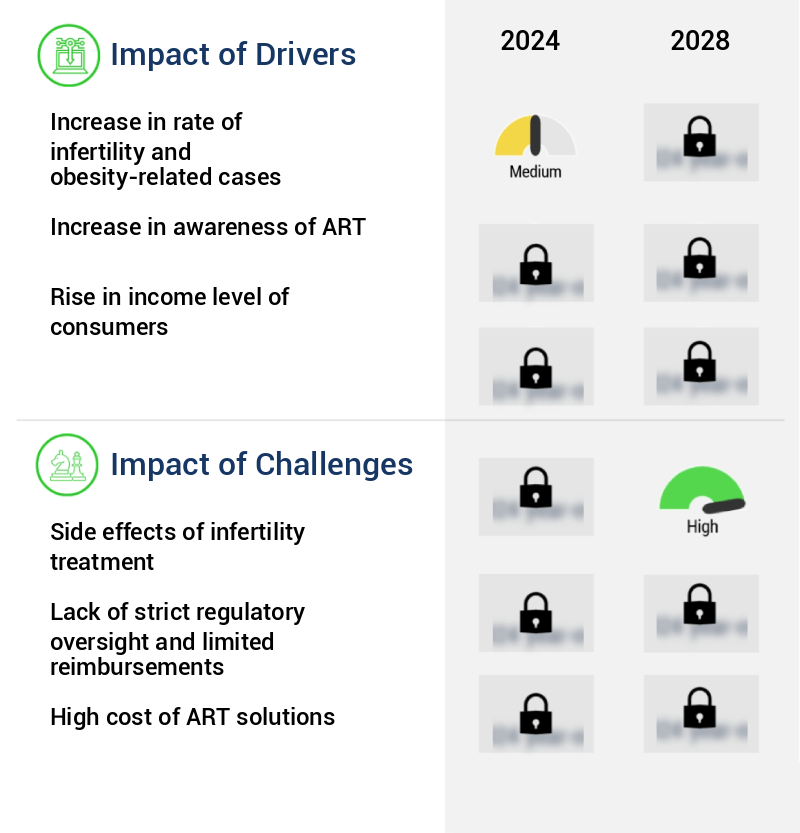
What are the key market drivers leading to the rise in the adoption of Assisted Reproductive Technology (ART ) Industry?

  • The rising prevalence of infertility and obesity-related cases serves as the primary driver for market growth in this industry. 
  • The market is experiencing significant growth due to the rising prevalence of infertility and obesity-related cases. Infertility, a major concern for numerous couples, is influenced by factors such as advanced maternal age, hormonal contraceptives disorders, lifestyle choices, genetic factors, and infections. As the rate of infertility continues to increase, the demand for ART procedures like in vitro fertilization (IVF), intrauterine insemination (IUI), and other advanced techniques is on the rise. Moreover, advancements in technology have led to improvements in ART procedures' accuracy and efficiency. For instance, the implementation of automation and robotics in IVF clinics has reduced downtime and increased the number of embryos that can be processed daily.
  • Furthermore, the integration of AI and machine learning algorithms in ART processes has enhanced the prediction of successful implantation and reduced the number of failed cycles. In conclusion, the ART market's evolution is driven by the increasing need to address infertility and obesity-related cases. The integration of advanced technologies has led to improvements in accuracy, efficiency, and overall success rates, making ART procedures more accessible and effective for couples worldwide.

What are the market trends shaping the Assisted Reproductive Technology (ART ) Industry?

  • The increasing trend in single-parent families represents a significant market demographic. Single-parent households are becoming more common and represent a growing market segment.
  • The market has witnessed significant evolution, catering to diverse sectors and addressing the reproductive needs of various demographics. According to recent studies, the number of single women utilizing fertility clinics has doubled since the beginning of the decade. This trend is predominantly driven by social acceptance and the increasing number of single-parent families, with the majority being divorced, widowed, or not married. One of the primary challenges faced by these families is the financial burden of raising a child. Additionally, other impediments include limited access to Health Insurance, difficulty securing affordable childcare, and lack of financial support from the absent parent.
  • Despite these challenges, advancements in ART have led to faster treatment processes, improved forecast accuracy, and enhanced regulatory compliance, enabling more families to overcome fertility issues.

What challenges does the Assisted Reproductive Technology (ART ) Industry face during its growth?

  • The infertility treatment industry faces significant challenges due to the potential side effects associated with its procedures, which can hinder industry growth. 
  • Assisted Reproductive Technology (ART ), including in-vitro fertilization (IVF) and related procedures, represents a significant and evolving market with a global focus. The ART market is driven by the increasing prevalence of infertility issues and the high success rates of these treatments compared to other alternatives. According to recent studies, approximately 12% of women in the reproductive age group experience infertility, creating a substantial demand for ART services. However, these treatments come with potential side effects and risks, such as mild cramping, bloating, breast tenderness, nausea, vomiting, and severe stomach pains. IVF procedures can also lead to multiple pregnancies and complications, including bleeding after the procedure.
  • Despite these concerns, the ART market continues to grow, reflecting the profound impact of these treatments on individuals and families seeking to expand their families. It is crucial for healthcare providers to maintain regulatory compliance and optimize costs while ensuring the highest level of patient care and safety.

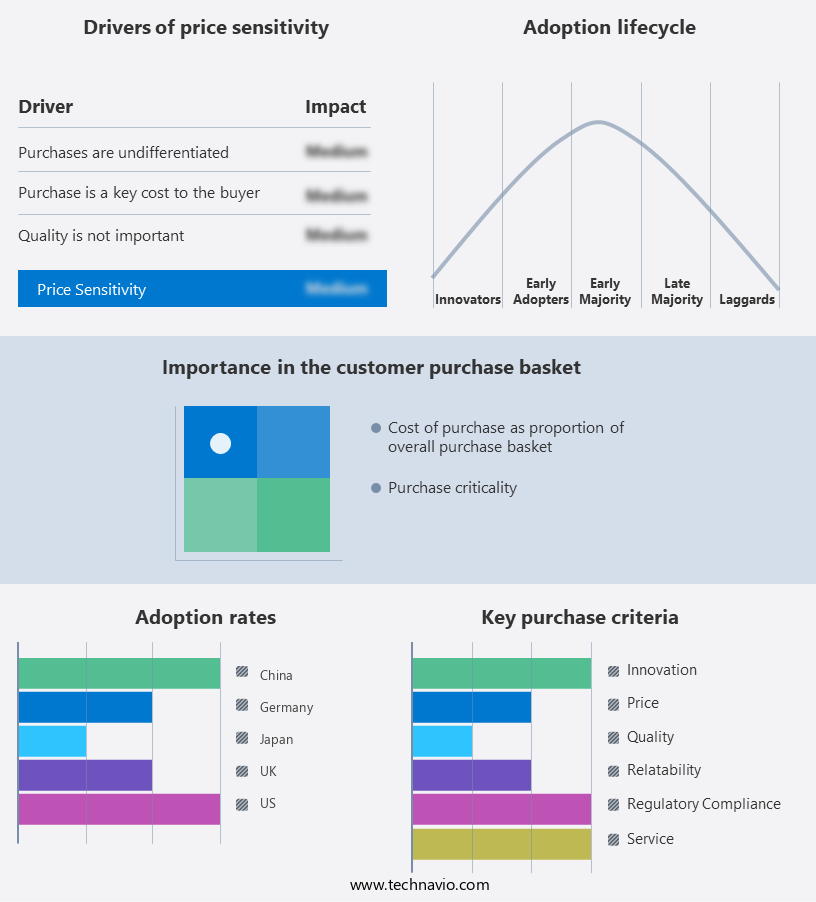
Exclusive Technavio Analysis on Customer Landscape

The assisted reproductive technology (ART ) market forecasting report includes the adoption lifecycle of the market, covering from the innovator's stage to the laggard's stage. It focuses on adoption rates in different regions based on penetration. Furthermore, the assisted reproductive technology (ART ) market report also includes key purchase criteria and drivers of price sensitivity to help companies evaluate and develop their market growth analysis strategies.

Assisted Reproductive Technology (Art) Market Share by Geography

 Customer Landscape of Assisted Reproductive Technology (ART ) Industry

Competitive Landscape

Companies are implementing various strategies, such as strategic alliances, assisted reproductive technology (ART ) market forecast, pART nerships, mergers and acquisitions, geographical expansion, and product/service launches, to enhance their presence in the industry.

Cook Group Inc. (United States) - This company specializes in providing advanced assisted reproductive technology services through innovative products, including the MNC Benchtop incubator. By leveraging cutting-edge technology, it ensures optimal conditions for fertilization and embryo development. The company's commitment to scientific excellence drives continuous improvement in reproductive healthcare solutions.

The industry research and growth report includes detailed analyses of the competitive landscape of the market and information about key companies, including:

  • Cook Group Inc. (United States)
  • CRITEX GmbH (Germany)
  • Cryolab Ltd. (United Kingdom)
  • Esco Micro Pte. Ltd. (Singapore)
  • Ferring BV (Netherlands)
  • FUJIFILM Holdings Corp. (Japan)
  • Genea Ltd. (Australia)
  • Hamilton Thorne Ltd. (Canada)
  • IMV Technologies (France)
  • Instituto Bernabeu SL (Spain)
  • INVO Bioscience Inc. (United States)
  • KITAZATO Corp. (Japan)
  • Merck KGaA (Germany)
  • Monash IVF Group Ltd. (Australia)
  • Pantec Engineering AG (Switzerland)
  • Smiths Group Plc (United Kingdom)
  • The Cooper Companies Inc. (United States)
  • Virtus Health (Australia)
  • Vitrolife AB (Sweden)
  • XiltriX International (Netherlands)

Qualitative and quantitative analysis of companies has been conducted to help clients understand the wider business environment as well as the strengths and weaknesses of key industry players. Data is qualitatively analyzed to categorize companies as pure play, category-focused, industry-focused, and diversified; it is quantitatively analyzed to categorize companies as dominant, leading, strong, tentative, and weak.

Recent Development and News in Assisted Reproductive Technology (ART ) Market

  • In January 2025, Merck KGaA, a leading science and technology company, announced the launch of its new fertility drug, Emgality, in the US market. Emgality is indicated for the prevention of recurrent spontaneous preterm labor and is the first and only FDA-approved monoclonal antibody for this indication (Merck KGaA press release, 2025).
  • In March 2025, Illumina Inc., a global leader in genomic sequencing and array-based solutions, entered into a strategic collaboration with Fertility Solutions, a leading fertility clinic network in Australia. This pART nership aimed to integrate Illumina's genomic analysis tools into Fertility Solutions' IVF (in vitro fertilization) processes to improve the success rates and personalization of assisted reproductive treatments (Illumina Inc. Press release, 2025).
  • In May 2025, Thermo Fisher Scientific, a biotechnology product development company, completed the acquisition of Genea Biomedx Ltd., a leading provider of advanced reproductive technologies. This acquisition expanded Thermo Fisher Scientific's portfolio in the ART market and strengthened its position as a global leader in the reproductive health sector (Thermo Fisher Scientific press release, 2025).
  • In August 2024, the European Union approved the use of Vitrakvi (larotrectinib), a precision oncology medicine, for the treatment of certain solid tumors with NTRK gene fusions. This approval marked a significant milestone in the ART market, as Vitrakvi is the first and only medicine to receive a European approval for multiple solid tumor types based on the genetic profile of the tumor rather than its location (European Medicines Agency press release, 2024).

Dive into Technavio's robust research methodology, blending expert interviews, extensive data synthesis, and validated models for unparalleled Assisted Reproductive Technology (ART ) Market insights. See full methodology.

Market Scope

Report Coverage

Details

Page number

168

Base year

2023

Historic period

2018-2022

Forecast period

2024-2028

Growth momentum & CAGR

Accelerate at a CAGR of 4.36%

Market growth 2024-2028

USD 6295.3 million

Market structure

Fragmented

YoY growth 2023-2024(%)

4.11

Key countries

US, UK, China, Germany, Japan, India, France, Netherlands, UAE, and Brazil

Competitive landscape

Leading Companies, Market Positioning of Companies, Competitive Strategies, and Industry Risks

Request Free Sample

Research Analyst Overview

  • The market continues to evolve, with ongoing advancements in various sectors transforming the landscape of infertility treatment. Ovarian stimulation protocols, such as Hormone Replacement Therapy and ovulation induction, play a crucial role in optimizing egg production. However, conditions like endometriosis and polycystic ovary syndrome can impact the success of these treatments. Embryo transfer and embryo quality assessment techniques, including blastocyst culture and preimplantation genetic diagnosis, have significantly improved pregnancy success rates. Fertility preservation methods, like egg retrieval and sperm cryopreservation, offer solutions for individuals facing unexplained infertility or undergoing medical treatments that may impact their fertility. IVF procedures, surrogate motherhood, and donor egg cycles have expanded access to infertility treatment for those facing female factor infertility or male factor infertility.
  • The market's continuous dynamism is further highlighted by innovations like zygote intrafallopian transfer, assisted hatching, and intracytoplasmic sperm injection. Industry growth in ART is robust, with expectations of over 10% annual expansion. For instance, a recent study reported a 12% increase in IVF cycles in a major European country. Despite these advancements, challenges persist, such as multiple gestation risks and the impact of uterine fibroids on implantation rates. Time-lapse imaging and semen analysis parameters have emerged as essential tools in optimizing treatment outcomes. Preimplantation genetic testing and genetic screening are increasingly adopted to minimize the risk of hereditary disorders.
  • The ART market's ongoing evolution underscores its commitment to addressing the complexities of infertility and delivering new possibilities for individuals and families.

What are the Key Data Covered in this Assisted Reproductive Technology (ART ) Market Research and Growth Report?

  • What is the expected growth of the Assisted Reproductive Technology (ART ) Market between 2024 and 2028?

    • USD 6.3 billion, at a CAGR of 4.36%

  • What segmentation does the market report cover?

    • The report is segmented by End-User (Fertility clinics, Hospitals, Surgical centers, Research institutes/labs, and Cryobanks), Type (IVF, ART ificial insemination, GIFT (Gamete Intrafallopian Transfer), ZIFT (Zygote Intrafallopian Transfer), Surrogacy, and Donor egg/sperm ART ), Geography (Europe, North America, Asia, Middle East and Africa, South America, and Rest of World (ROW)), and Product (Instrument, Accessory and Disposable, Reagents and Media, and Software)

  • Which regions are analyzed in the report?

    • Europe, North America, Asia, and Rest of World (ROW)

  • What are the key growth drivers and market challenges?

    • Increase in rate of infertility and obesity-related cases, Side effects of infertility treatment

  • Who are the major players in the Assisted Reproductive Technology (ART ) Market?

    • Cook Group Inc. (United States), CRITEX GmbH (Germany), Cryolab Ltd. (United Kingdom), Esco Micro Pte. Ltd. (Singapore), Ferring BV (Netherlands), FUJIFILM Holdings Corp. (Japan), Genea Ltd. (Australia), Hamilton Thorne Ltd. (Canada), IMV Technologies (France), Instituto Bernabeu SL (Spain), INVO Bioscience Inc. (United States), KITAZATO Corp. (Japan), Merck KGaA (Germany), Monash IVF Group Ltd. (Australia), Pantec Engineering AG (Switzerland), Smiths Group Plc (United Kingdom), The Cooper Companies Inc. (United States), Virtus Health (Australia), Vitrolife AB (Sweden), and XiltriX International (Netherlands)

Market Research Insights

  • The market for assisted reproductive technologies (ART ) continues to advance, with ongoing innovations in oocyte selection, follicular development, and the management of conditions such as ovarian hyperstimulation syndrome. According to recent reports, the number of ART cycles performed worldwide reached over 2 million in 2020. Furthermore, industry experts anticipate a compound annual growth rate of 5% over the next five years. For instance, the integration of advanced reproductive techniques, such as non-invasive prenatal testing and minimally invasive procedures, has led to a significant reduction in miscarriage risk and ectopic pregnancy complications. Clinical pregnancy rates have also improved, with an average success outcome of 35% per cycle for women undergoing in vitro fertilization (IVF).
  • Additionally, the role of genetic counselors and embryo biopsy in identifying chromosomal abnormalities has become increasingly crucial in optimizing treatment efficacy. Despite these advancements, challenges persist, including the need for continuous hormone levels monitoring, optimizing ovulation timing, and addressing multiple pregnancy complications. Furthermore, semen parameters, such as sperm morphology and motility, remain essential factors in the success of ART procedures. Ultimately, the ART market continues to evolve, offering hope and solutions for those facing infertility issues.

We can help! Our analysts can customize this assisted reproductive technology (ART ) market research report to meet your requirements.

Get in touch

1 Executive Summary

  • 1.1 Market overview
    • Executive Summary - Chart on Market Overview
    • Executive Summary - Data Table on Market Overview
    • Executive Summary - Chart on Global Market Characteristics
    • Executive Summary - Chart on Market by Geography
    • Executive Summary - Chart on Market Segmentation by Application
    • Executive Summary - Chart on Market Segmentation by Type
    • Executive Summary - Chart on Incremental Growth
    • Executive Summary - Data Table on Incremental Growth
    • Executive Summary - Chart on Company Market Positioning

2 Market Landscape

  • 2.1 Market ecosystem
    • Parent Market
    • Data Table on - Parent Market
  • 2.2 Market characteristics
    • Market characteristics analysis
  • 2.3 Value chain analysis
    • Value Chain Analysis

3 Market Sizing

  • 3.1 Market definition
    • Offerings of companies included in the market definition
  • 3.2 Market segment analysis
    • Market segments
  • 3.3 Market size 2023
    • 3.4 Market outlook: Forecast for 2023-2028
      • Chart on Global - Market size and forecast 2023-2028 ($ million)
      • Data Table on Global - Market size and forecast 2023-2028 ($ million)
      • Chart on Global Market: Year-over-year growth 2023-2028 (%)
      • Data Table on Global Market: Year-over-year growth 2023-2028 (%)

    4 Historic Market Size

    • 4.1 Global Assisted Reproductive Technology (ART) Market 2018 - 2022
      • Historic Market Size - Data Table on Global Assisted Reproductive Technology (ART) Market 2018 - 2022 ($ million)
    • 4.2 Application segment analysis 2018 - 2022
      • Historic Market Size - Application Segment 2018 - 2022 ($ million)
    • 4.3 Type segment analysis 2018 - 2022
      • Historic Market Size - Type Segment 2018 - 2022 ($ million)
    • 4.4 Geography segment analysis 2018 - 2022
      • Historic Market Size - Geography Segment 2018 - 2022 ($ million)
    • 4.5 Country segment analysis 2018 - 2022
      • Historic Market Size - Country Segment 2018 - 2022 ($ million)

    5 Five Forces Analysis

    • 5.1 Five forces summary
      • Five forces analysis - Comparison between 2023 and 2028
    • 5.2 Bargaining power of buyers
      • Bargaining power of buyers - Impact of key factors 2023 and 2028
    • 5.3 Bargaining power of suppliers
      • Bargaining power of suppliers - Impact of key factors in 2023 and 2028
    • 5.4 Threat of new entrants
      • Threat of new entrants - Impact of key factors in 2023 and 2028
    • 5.5 Threat of substitutes
      • Threat of substitutes - Impact of key factors in 2023 and 2028
    • 5.6 Threat of rivalry
      • Threat of rivalry - Impact of key factors in 2023 and 2028
    • 5.7 Market condition
      • Chart on Market condition - Five forces 2023 and 2028

    6 Market Segmentation by Application

    • 6.1 Market segments
      • Chart on Application - Market share 2023-2028 (%)
      • Data Table on Application - Market share 2023-2028 (%)
    • 6.2 Comparison by Application
      • Chart on Comparison by Application
      • Data Table on Comparison by Application
    • 6.3 Fertility clinics - Market size and forecast 2023-2028
      • Chart on Fertility clinics - Market size and forecast 2023-2028 ($ million)
      • Data Table on Fertility clinics - Market size and forecast 2023-2028 ($ million)
      • Chart on Fertility clinics - Year-over-year growth 2023-2028 (%)
      • Data Table on Fertility clinics - Year-over-year growth 2023-2028 (%)
    • 6.4 Hospitals - Market size and forecast 2023-2028
      • Chart on Hospitals - Market size and forecast 2023-2028 ($ million)
      • Data Table on Hospitals - Market size and forecast 2023-2028 ($ million)
      • Chart on Hospitals - Year-over-year growth 2023-2028 (%)
      • Data Table on Hospitals - Year-over-year growth 2023-2028 (%)
    • 6.5 Others - Market size and forecast 2023-2028
      • Chart on Others - Market size and forecast 2023-2028 ($ million)
      • Data Table on Others - Market size and forecast 2023-2028 ($ million)
      • Chart on Others - Year-over-year growth 2023-2028 (%)
      • Data Table on Others - Year-over-year growth 2023-2028 (%)
    • 6.6 Market opportunity by Application
      • Market opportunity by Application ($ million)
      • Data Table on Market opportunity by Application ($ million)

    7 Market Segmentation by Type

    • 7.1 Market segments
      • Chart on Type - Market share 2023-2028 (%)
      • Data Table on Type - Market share 2023-2028 (%)
    • 7.2 Comparison by Type
      • Chart on Comparison by Type
      • Data Table on Comparison by Type
    • 7.3 IVF - Market size and forecast 2023-2028
      • Chart on IVF - Market size and forecast 2023-2028 ($ million)
      • Data Table on IVF - Market size and forecast 2023-2028 ($ million)
      • Chart on IVF - Year-over-year growth 2023-2028 (%)
      • Data Table on IVF - Year-over-year growth 2023-2028 (%)
    • 7.4 Artificial insemination - Market size and forecast 2023-2028
      • Chart on Artificial insemination - Market size and forecast 2023-2028 ($ million)
      • Data Table on Artificial insemination - Market size and forecast 2023-2028 ($ million)
      • Chart on Artificial insemination - Year-over-year growth 2023-2028 (%)
      • Data Table on Artificial insemination - Year-over-year growth 2023-2028 (%)
    • 7.5 Market opportunity by Type
      • Market opportunity by Type ($ million)
      • Data Table on Market opportunity by Type ($ million)

    8 Market Segmentation by End-User

    • 8.1 Market segments
      • Chart on End-User - Market share (2023-2028) (%)
      • Data Table on End-User - Market share (2023-2028) (%)
    • 8.2 Comparison by End-User
      • Chart on Comparison by End-User
      • Data Table on Comparison by End-User
    • 8.3 Fertility clinics - Market size and forecast (2023-2028)
      • Chart on Fertility clinics - Market size and forecast (2023-2028) ($ million)
      • Data Table on Fertility clinics - Market size and forecast (2023-2028) ($ million)
      • Chart on Fertility clinics - Year-over-year growth (2023-2028) (%)
      • Data Table on Fertility clinics - Year-over-year growth (2023-2028) (%)
    • 8.4 Hospitals - Market size and forecast (2023-2028)
      • Chart on Hospitals - Market size and forecast (2023-2028) ($ million)
      • Data Table on Hospitals - Market size and forecast (2023-2028) ($ million)
      • Chart on Hospitals - Year-over-year growth (2023-2028) (%)
      • Data Table on Hospitals - Year-over-year growth (2023-2028) (%)
    • 8.5 Surgical centers - Market size and forecast (2023-2028)
      • Chart on Surgical centers - Market size and forecast (2023-2028) ($ million)
      • Data Table on Surgical centers - Market size and forecast (2023-2028) ($ million)
      • Chart on Surgical centers - Year-over-year growth (2023-2028) (%)
      • Data Table on Surgical centers - Year-over-year growth (2023-2028) (%)
    • 8.6 Research institutes/labs - Market size and forecast (2023-2028)
      • Chart on Research institutes/labs - Market size and forecast (2023-2028) ($ million)
      • Data Table on Research institutes/labs - Market size and forecast (2023-2028) ($ million)
      • Chart on Research institutes/labs - Year-over-year growth (2023-2028) (%)
      • Data Table on Research institutes/labs - Year-over-year growth (2023-2028) (%)
    • 8.7 Cryobanks - Market size and forecast (2023-2028)
      • Chart on Cryobanks - Market size and forecast (2023-2028) ($ million)
      • Data Table on Cryobanks - Market size and forecast (2023-2028) ($ million)
      • Chart on Cryobanks - Year-over-year growth (2023-2028) (%)
      • Data Table on Cryobanks - Year-over-year growth (2023-2028) (%)
    • 8.8 Market opportunity by End-User
      • Market opportunity by End-User ($ million)
      • Data Table on Market opportunity by End-User ($ million)

    9 Market Segmentation by Type

    • 9.1 Market segments
      • Chart on Type - Market share (2023-2028) (%)
      • Data Table on Type - Market share (2023-2028) (%)
    • 9.2 Comparison by Type
      • Chart on Comparison by Type
      • Data Table on Comparison by Type
    • 9.3 IVF - Market size and forecast (2023-2028)
      • Chart on IVF - Market size and forecast (2023-2028) ($ million)
      • Data Table on IVF - Market size and forecast (2023-2028) ($ million)
      • Chart on IVF - Year-over-year growth (2023-2028) (%)
      • Data Table on IVF - Year-over-year growth (2023-2028) (%)
    • 9.4 Artificial insemination - Market size and forecast (2023-2028)
      • Chart on Artificial insemination - Market size and forecast (2023-2028) ($ million)
      • Data Table on Artificial insemination - Market size and forecast (2023-2028) ($ million)
      • Chart on Artificial insemination - Year-over-year growth (2023-2028) (%)
      • Data Table on Artificial insemination - Year-over-year growth (2023-2028) (%)
    • 9.5 GIFT (Gamete Intrafallopian Transfer) - Market size and forecast (2023-2028)
      • Chart on GIFT (Gamete Intrafallopian Transfer) - Market size and forecast (2023-2028) ($ million)
      • Data Table on GIFT (Gamete Intrafallopian Transfer) - Market size and forecast (2023-2028) ($ million)
      • Chart on GIFT (Gamete Intrafallopian Transfer) - Year-over-year growth (2023-2028) (%)
      • Data Table on GIFT (Gamete Intrafallopian Transfer) - Year-over-year growth (2023-2028) (%)
    • 9.6 ZIFT (Zygote Intrafallopian Transfer) - Market size and forecast (2023-2028)
      • Chart on ZIFT (Zygote Intrafallopian Transfer) - Market size and forecast (2023-2028) ($ million)
      • Data Table on ZIFT (Zygote Intrafallopian Transfer) - Market size and forecast (2023-2028) ($ million)
      • Chart on ZIFT (Zygote Intrafallopian Transfer) - Year-over-year growth (2023-2028) (%)
      • Data Table on ZIFT (Zygote Intrafallopian Transfer) - Year-over-year growth (2023-2028) (%)
    • 9.7 Surrogacy - Market size and forecast (2023-2028)
      • Chart on Surrogacy - Market size and forecast (2023-2028) ($ million)
      • Data Table on Surrogacy - Market size and forecast (2023-2028) ($ million)
      • Chart on Surrogacy - Year-over-year growth (2023-2028) (%)
      • Data Table on Surrogacy - Year-over-year growth (2023-2028) (%)
    • 9.8 Donor egg/sperm ART - Market size and forecast (2023-2028)
      • Chart on Donor egg/sperm ART - Market size and forecast (2023-2028) ($ million)
      • Data Table on Donor egg/sperm ART - Market size and forecast (2023-2028) ($ million)
      • Chart on Donor egg/sperm ART - Year-over-year growth (2023-2028) (%)
      • Data Table on Donor egg/sperm ART - Year-over-year growth (2023-2028) (%)
    • 9.9 Market opportunity by Type
      • Market opportunity by Type ($ million)
      • Data Table on Market opportunity by Type ($ million)

    10 Market Segmentation by Geography

    • 10.1 Market segments
      • Chart on Geography - Market share (2023-2028) (%)
      • Data Table on Geography - Market share (2023-2028) (%)
    • 10.2 Comparison by Geography
      • Chart on Comparison by Geography
      • Data Table on Comparison by Geography
    • 10.3 Europe - Market size and forecast (2023-2028)
      • Chart on Europe - Market size and forecast (2023-2028) ($ million)
      • Data Table on Europe - Market size and forecast (2023-2028) ($ million)
      • Chart on Europe - Year-over-year growth (2023-2028) (%)
      • Data Table on Europe - Year-over-year growth (2023-2028) (%)
    • 10.4 North America - Market size and forecast (2023-2028)
      • Chart on North America - Market size and forecast (2023-2028) ($ million)
      • Data Table on North America - Market size and forecast (2023-2028) ($ million)
      • Chart on North America - Year-over-year growth (2023-2028) (%)
      • Data Table on North America - Year-over-year growth (2023-2028) (%)
    • 10.5 Asia - Market size and forecast (2023-2028)
      • Chart on Asia - Market size and forecast (2023-2028) ($ million)
      • Data Table on Asia - Market size and forecast (2023-2028) ($ million)
      • Chart on Asia - Year-over-year growth (2023-2028) (%)
      • Data Table on Asia - Year-over-year growth (2023-2028) (%)
    • 10.6 Rest of World (ROW) - Market size and forecast (2023-2028)
      • Chart on Rest of World (ROW) - Market size and forecast (2023-2028) ($ million)
      • Data Table on Rest of World (ROW) - Market size and forecast (2023-2028) ($ million)
      • Chart on Rest of World (ROW) - Year-over-year growth (2023-2028) (%)
      • Data Table on Rest of World (ROW) - Year-over-year growth (2023-2028) (%)
    • 10.7 Market opportunity by Geography
      • Market opportunity by Geography ($ million)
      • Data Table on Market opportunity by Geography ($ million)

    11 Market Segmentation by Product

    • 11.1 Market segments
      • Chart on Product - Market share (2023-2028) (%)
      • Data Table on Product - Market share (2023-2028) (%)
    • 11.2 Comparison by Product
      • Chart on Comparison by Product
      • Data Table on Comparison by Product
    • 11.3 Instrument - Market size and forecast (2023-2028)
      • Chart on Instrument - Market size and forecast (2023-2028) ($ million)
      • Data Table on Instrument - Market size and forecast (2023-2028) ($ million)
      • Chart on Instrument - Year-over-year growth (2023-2028) (%)
      • Data Table on Instrument - Year-over-year growth (2023-2028) (%)
    • 11.4 Accessory and Disposable - Market size and forecast (2023-2028)
      • Chart on Accessory and Disposable - Market size and forecast (2023-2028) ($ million)
      • Data Table on Accessory and Disposable - Market size and forecast (2023-2028) ($ million)
      • Chart on Accessory and Disposable - Year-over-year growth (2023-2028) (%)
      • Data Table on Accessory and Disposable - Year-over-year growth (2023-2028) (%)
    • 11.5 Reagents and Media - Market size and forecast (2023-2028)
      • Chart on Reagents and Media - Market size and forecast (2023-2028) ($ million)
      • Data Table on Reagents and Media - Market size and forecast (2023-2028) ($ million)
      • Chart on Reagents and Media - Year-over-year growth (2023-2028) (%)
      • Data Table on Reagents and Media - Year-over-year growth (2023-2028) (%)
    • 11.6 Software - Market size and forecast (2023-2028)
      • Chart on Software - Market size and forecast (2023-2028) ($ million)
      • Data Table on Software - Market size and forecast (2023-2028) ($ million)
      • Chart on Software - Year-over-year growth (2023-2028) (%)
      • Data Table on Software - Year-over-year growth (2023-2028) (%)
    • 11.7 Market opportunity by Product
      • Market opportunity by Product ($ million)
      • Data Table on Market opportunity by Product ($ million)

    12 Customer Landscape

    • 12.1 Customer landscape overview
      • Analysis of price sensitivity, lifecycle, customer purchase basket, adoption rates, and purchase criteria

    13 Geographic Landscape

    • 13.1 Geographic segmentation
      • Chart on Market share by geography 2023-2028 (%)
      • Data Table on Market share by geography 2023-2028 (%)
    • 13.2 Geographic comparison
      • Chart on Geographic comparison
      • Data Table on Geographic comparison
    • 13.3 Europe - Market size and forecast (2023-2028)
      • Chart on Europe - Market size and forecast (2023-2028) ($ million)
      • Data Table on Europe - Market size and forecast (2023-2028) ($ million)
      • Chart on Europe - Year-over-year growth (2023-2028) (%)
      • Data Table on Europe - Year-over-year growth (2023-2028) (%)
      • Chart on Europe - Market size and forecast 2023-2028 ($ million)
      • Data Table on Europe - Market size and forecast 2023-2028 ($ million)
      • Chart on Europe - Year-over-year growth 2023-2028 (%)
      • Data Table on Europe - Year-over-year growth 2023-2028 (%)
    • 13.4 North America - Market size and forecast (2023-2028)
      • Chart on North America - Market size and forecast (2023-2028) ($ million)
      • Data Table on North America - Market size and forecast (2023-2028) ($ million)
      • Chart on North America - Year-over-year growth (2023-2028) (%)
      • Data Table on North America - Year-over-year growth (2023-2028) (%)
      • Chart on North America - Market size and forecast 2023-2028 ($ million)
      • Data Table on North America - Market size and forecast 2023-2028 ($ million)
      • Chart on North America - Year-over-year growth 2023-2028 (%)
      • Data Table on North America - Year-over-year growth 2023-2028 (%)
    • 13.5 Asia - Market size and forecast (2023-2028)
      • Chart on Asia - Market size and forecast (2023-2028) ($ million)
      • Data Table on Asia - Market size and forecast (2023-2028) ($ million)
      • Chart on Asia - Year-over-year growth (2023-2028) (%)
      • Data Table on Asia - Year-over-year growth (2023-2028) (%)
      • Chart on Asia - Market size and forecast 2023-2028 ($ million)
      • Data Table on Asia - Market size and forecast 2023-2028 ($ million)
      • Chart on Asia - Year-over-year growth 2023-2028 (%)
      • Data Table on Asia - Year-over-year growth 2023-2028 (%)
    • 13.6 Rest of World (ROW) - Market size and forecast (2023-2028)
      • Chart on Rest of World (ROW) - Market size and forecast (2023-2028) ($ million)
      • Data Table on Rest of World (ROW) - Market size and forecast (2023-2028) ($ million)
      • Chart on Rest of World (ROW) - Year-over-year growth (2023-2028) (%)
      • Data Table on Rest of World (ROW) - Year-over-year growth (2023-2028) (%)
      • Chart on Rest of World (ROW) - Market size and forecast 2023-2028 ($ million)
      • Data Table on Rest of World (ROW) - Market size and forecast 2023-2028 ($ million)
      • Chart on Rest of World (ROW) - Year-over-year growth 2023-2028 (%)
      • Data Table on Rest of World (ROW) - Year-over-year growth 2023-2028 (%)
    • 13.7 US - Market size and forecast (2023-2028)
      • Chart on US - Market size and forecast (2023-2028) ($ million)
      • Data Table on US - Market size and forecast (2023-2028) ($ million)
      • Chart on US - Year-over-year growth (2023-2028) (%)
      • Data Table on US - Year-over-year growth (2023-2028) (%)
      • Chart on US - Market size and forecast 2023-2028 ($ million)
      • Data Table on US - Market size and forecast 2023-2028 ($ million)
      • Chart on US - Year-over-year growth 2023-2028 (%)
      • Data Table on US - Year-over-year growth 2023-2028 (%)
    • 13.8 UK - Market size and forecast (2023-2028)
      • Chart on UK - Market size and forecast (2023-2028) ($ million)
      • Data Table on UK - Market size and forecast (2023-2028) ($ million)
      • Chart on UK - Year-over-year growth (2023-2028) (%)
      • Data Table on UK - Year-over-year growth (2023-2028) (%)
      • Chart on UK - Market size and forecast 2023-2028 ($ million)
      • Data Table on UK - Market size and forecast 2023-2028 ($ million)
      • Chart on UK - Year-over-year growth 2023-2028 (%)
      • Data Table on UK - Year-over-year growth 2023-2028 (%)
    • 13.9 China - Market size and forecast (2023-2028)
      • Chart on China - Market size and forecast (2023-2028) ($ million)
      • Data Table on China - Market size and forecast (2023-2028) ($ million)
      • Chart on China - Year-over-year growth (2023-2028) (%)
      • Data Table on China - Year-over-year growth (2023-2028) (%)
      • Chart on China - Market size and forecast 2023-2028 ($ million)
      • Data Table on China - Market size and forecast 2023-2028 ($ million)
      • Chart on China - Year-over-year growth 2023-2028 (%)
      • Data Table on China - Year-over-year growth 2023-2028 (%)
    • 13.10 Germany - Market size and forecast (2023-2028)
      • Chart on Germany - Market size and forecast (2023-2028) ($ million)
      • Data Table on Germany - Market size and forecast (2023-2028) ($ million)
      • Chart on Germany - Year-over-year growth (2023-2028) (%)
      • Data Table on Germany - Year-over-year growth (2023-2028) (%)
      • Chart on Germany - Market size and forecast 2023-2028 ($ million)
      • Data Table on Germany - Market size and forecast 2023-2028 ($ million)
      • Chart on Germany - Year-over-year growth 2023-2028 (%)
      • Data Table on Germany - Year-over-year growth 2023-2028 (%)
    • 13.11 Japan - Market size and forecast (2023-2028)
      • Chart on Japan - Market size and forecast (2023-2028) ($ million)
      • Data Table on Japan - Market size and forecast (2023-2028) ($ million)
      • Chart on Japan - Year-over-year growth (2023-2028) (%)
      • Data Table on Japan - Year-over-year growth (2023-2028) (%)
      • Chart on Japan - Market size and forecast 2023-2028 ($ million)
      • Data Table on Japan - Market size and forecast 2023-2028 ($ million)
      • Chart on Japan - Year-over-year growth 2023-2028 (%)
      • Data Table on Japan - Year-over-year growth 2023-2028 (%)
    • 13.12 India - Market size and forecast (2023-2028)
      • Chart on India - Market size and forecast (2023-2028) ($ million)
      • Data Table on India - Market size and forecast (2023-2028) ($ million)
      • Chart on India - Year-over-year growth (2023-2028) (%)
      • Data Table on India - Year-over-year growth (2023-2028) (%)
      • Market opportunity by geography ($ million)
      • Data Tables on Market opportunity by geography ($ million)
    • 13.13 France - Market size and forecast (2023-2028)
      • Chart on France - Market size and forecast (2023-2028) ($ million)
      • Data Table on France - Market size and forecast (2023-2028) ($ million)
      • Chart on France - Year-over-year growth (2023-2028) (%)
      • Data Table on France - Year-over-year growth (2023-2028) (%)
    • 13.14 Netherlands - Market size and forecast (2023-2028)
      • Chart on Netherlands - Market size and forecast (2023-2028) ($ million)
      • Data Table on Netherlands - Market size and forecast (2023-2028) ($ million)
      • Chart on Netherlands - Year-over-year growth (2023-2028) (%)
      • Data Table on Netherlands - Year-over-year growth (2023-2028) (%)
    • 13.15 UAE - Market size and forecast (2023-2028)
      • Chart on UAE - Market size and forecast (2023-2028) ($ million)
      • Data Table on UAE - Market size and forecast (2023-2028) ($ million)
      • Chart on UAE - Year-over-year growth (2023-2028) (%)
      • Data Table on UAE - Year-over-year growth (2023-2028) (%)
    • 13.16 Brazil - Market size and forecast (2023-2028)
      • Chart on Brazil - Market size and forecast (2023-2028) ($ million)
      • Data Table on Brazil - Market size and forecast (2023-2028) ($ million)
      • Chart on Brazil - Year-over-year growth (2023-2028) (%)
      • Data Table on Brazil - Year-over-year growth (2023-2028) (%)

    14 Drivers, Challenges, and Opportunity/Restraints

    • 14.1 Market drivers
      • 14.2 Market challenges
        • 14.3 Impact of drivers and challenges
          • Impact of drivers and challenges in 2023 and 2028
        • 14.4 Market opportunities/restraints

          15 Competitive Landscape

          • 15.1 Overview
            • 15.2 Competitive Landscape
              • Overview on criticality of inputs and factors of differentiation
            • 15.3 Landscape disruption
              • Overview on factors of disruption
            • 15.4 Industry risks
              • Impact of key risks on business

            16 Competitive Analysis

            • 16.1 Companies profiled
              • Companies covered
            • 16.2 Market positioning of companies
              • Matrix on companies position and classification
            • 16.3 Cook Group Inc. (United States)
              • Cook Group Inc. (United States) - Overview
              • Cook Group Inc. (United States) - Product / Service
              • Cook Group Inc. (United States) - Key offerings
            • 16.4 CRITEX GmbH (Germany)
              • CRITEX GmbH (Germany) - Overview
              • CRITEX GmbH (Germany) - Product / Service
              • CRITEX GmbH (Germany) - Key offerings
            • 16.5 Cryolab Ltd. (United Kingdom)
              • Cryolab Ltd. (United Kingdom) - Overview
              • Cryolab Ltd. (United Kingdom) - Product / Service
              • Cryolab Ltd. (United Kingdom) - Key offerings
            • 16.6 Esco Micro Pte. Ltd. (Singapore)
              • Esco Micro Pte. Ltd. (Singapore) - Overview
              • Esco Micro Pte. Ltd. (Singapore) - Product / Service
              • Esco Micro Pte. Ltd. (Singapore) - Key offerings
            • 16.7 Ferring BV (Netherlands)
              • Ferring BV (Netherlands) - Overview
              • Ferring BV (Netherlands) - Product / Service
              • Ferring BV (Netherlands) - Key offerings
            • 16.8 FUJIFILM Holdings Corp. (Japan)
              • FUJIFILM Holdings Corp. (Japan) - Overview
              • FUJIFILM Holdings Corp. (Japan) - Product / Service
              • FUJIFILM Holdings Corp. (Japan) - Key offerings
            • 16.9 Genea Ltd. (Australia)
              • Genea Ltd. (Australia) - Overview
              • Genea Ltd. (Australia) - Product / Service
              • Genea Ltd. (Australia) - Key offerings
            • 16.10 Hamilton Thorne Ltd. (Canada)
              • Hamilton Thorne Ltd. (Canada) - Overview
              • Hamilton Thorne Ltd. (Canada) - Product / Service
              • Hamilton Thorne Ltd. (Canada) - Key offerings
            • 16.11 IMV Technologies (France)
              • IMV Technologies (France) - Overview
              • IMV Technologies (France) - Product / Service
              • IMV Technologies (France) - Key offerings
            • 16.12 Instituto Bernabeu SL (Spain)
              • Instituto Bernabeu SL (Spain) - Overview
              • Instituto Bernabeu SL (Spain) - Product / Service
              • Instituto Bernabeu SL (Spain) - Key offerings
            • 16.13 INVO Bioscience Inc. (United States)
              • INVO Bioscience Inc. (United States) - Overview
              • INVO Bioscience Inc. (United States) - Product / Service
              • INVO Bioscience Inc. (United States) - Key offerings
            • 16.14 KITAZATO Corp. (Japan)
              • KITAZATO Corp. (Japan) - Overview
              • KITAZATO Corp. (Japan) - Product / Service
              • KITAZATO Corp. (Japan) - Key offerings
            • 16.15 Merck KGaA (Germany)
              • Merck KGaA (Germany) - Overview
              • Merck KGaA (Germany) - Product / Service
              • Merck KGaA (Germany) - Key offerings
            • 16.16 Monash IVF Group Ltd. (Australia)
              • Monash IVF Group Ltd. (Australia) - Overview
              • Monash IVF Group Ltd. (Australia) - Product / Service
              • Monash IVF Group Ltd. (Australia) - Key offerings
            • 16.17 Pantec Engineering AG (Switzerland)
              • Pantec Engineering AG (Switzerland) - Overview
              • Pantec Engineering AG (Switzerland) - Product / Service
              • Pantec Engineering AG (Switzerland) - Key offerings
            • 16.18 Smiths Group Plc (United Kingdom)
              • Smiths Group Plc (United Kingdom) - Overview
              • Smiths Group Plc (United Kingdom) - Product / Service
              • Smiths Group Plc (United Kingdom) - Key offerings
            • 16.19 The Cooper Companies Inc. (United States)
              • The Cooper Companies Inc. (United States) - Overview
              • The Cooper Companies Inc. (United States) - Product / Service
              • The Cooper Companies Inc. (United States) - Key offerings
            • 16.20 Virtus Health (Australia)
              • Virtus Health (Australia) - Overview
              • Virtus Health (Australia) - Product / Service
              • Virtus Health (Australia) - Key offerings
            • 16.21 Vitrolife AB (Sweden)
              • Vitrolife AB (Sweden) - Overview
              • Vitrolife AB (Sweden) - Product / Service
              • Vitrolife AB (Sweden) - Key offerings
            • 16.22 XiltriX International (Netherlands)
              • XiltriX International (Netherlands) - Overview
              • XiltriX International (Netherlands) - Product / Service
              • XiltriX International (Netherlands) - Key offerings
            • 16.23 Cook Group Inc.
              • Cook Group Inc. - Overview
              • Cook Group Inc. - Product / Service
              • Cook Group Inc. - Key offerings
            • 16.24 CRITEX GmbH
              • CRITEX GmbH - Overview
              • CRITEX GmbH - Product / Service
              • CRITEX GmbH - Key offerings
            • 16.25 Cryolab Ltd.
              • Cryolab Ltd. - Overview
              • Cryolab Ltd. - Product / Service
              • Cryolab Ltd. - Key offerings
            • 16.26 Esco Micro Pte. Ltd.
              • Esco Micro Pte. Ltd. - Overview
              • Esco Micro Pte. Ltd. - Product / Service
              • Esco Micro Pte. Ltd. - Key offerings
            • 16.27 Ferring BV
              • Ferring BV - Overview
              • Ferring BV - Product / Service
              • Ferring BV - Key offerings
            • 16.28 FUJIFILM Holdings Corp.
              • FUJIFILM Holdings Corp. - Overview
              • FUJIFILM Holdings Corp. - Product / Service
              • FUJIFILM Holdings Corp. - Key offerings
            • 16.29 Genea Ltd.
              • Genea Ltd. - Overview
              • Genea Ltd. - Product / Service
              • Genea Ltd. - Key offerings
            • 16.30 Hamilton Thorne Ltd
              • Hamilton Thorne Ltd - Overview
              • Hamilton Thorne Ltd - Product / Service
              • Hamilton Thorne Ltd - Key offerings
            • 16.31 IMV Technologies
              • IMV Technologies - Overview
              • IMV Technologies - Product / Service
              • IMV Technologies - Key offerings
            • 16.32 Instituto Bernabeu SL
              • Instituto Bernabeu SL - Overview
              • Instituto Bernabeu SL - Product / Service
              • Instituto Bernabeu SL - Key offerings
            • 16.33 INVO Bioscience Inc.
              • INVO Bioscience Inc. - Overview
              • INVO Bioscience Inc. - Product / Service
              • INVO Bioscience Inc. - Key offerings
            • 16.34 KITAZATO Corp.
              • KITAZATO Corp. - Overview
              • KITAZATO Corp. - Product / Service
              • KITAZATO Corp. - Key offerings
            • 16.35 Merck KGaA
              • Merck KGaA - Overview
              • Merck KGaA - Product / Service
              • Merck KGaA - Key offerings
            • 16.36 Monash IVF Group Ltd.
              • Monash IVF Group Ltd. - Overview
              • Monash IVF Group Ltd. - Product / Service
              • Monash IVF Group Ltd. - Key offerings
            • 16.37 Pantec Engineering AG
              • Pantec Engineering AG - Overview
              • Pantec Engineering AG - Product / Service
              • Pantec Engineering AG - Key offerings
            • 16.38 Smiths Group Plc
              • Smiths Group Plc - Overview
              • Smiths Group Plc - Product / Service
              • Smiths Group Plc - Key offerings
            • 16.39 The Cooper Companies Inc.
              • The Cooper Companies Inc. - Overview
              • The Cooper Companies Inc. - Product / Service
              • The Cooper Companies Inc. - Key offerings
            • 16.40 Virtus Health
              • Virtus Health - Overview
              • Virtus Health - Product / Service
              • Virtus Health - Key offerings
            • 16.41 Vitrolife AB
              • Vitrolife AB - Overview
              • Vitrolife AB - Product / Service
              • Vitrolife AB - Key offerings
            • 16.42 XiltriX International
              • XiltriX International - Overview
              • XiltriX International - Product / Service
              • XiltriX International - Key offerings

            17 Appendix

            • 17.1 Scope of the report
              • 17.2 Inclusions and exclusions checklist
                • Inclusions checklist
                • Exclusions checklist
              • 17.3 Currency conversion rates for US$
                • Currency conversion rates for US$
              • 17.4 Research methodology
                • Research methodology
              • 17.5 Data procurement
                • Information sources
              • 17.6 Data validation
                • Data validation
              • 17.7 Validation techniques employed for market sizing
                • Validation techniques employed for market sizing
              • 17.8 Data synthesis
                • Data synthesis
              • 17.9 360 degree market analysis
                • 360 degree market analysis
              • 17.10 List of abbreviations
                • List of abbreviations

              Research Methodology

              Technavio presents a detailed picture of the market by way of study, synthesis, and summation of data from multiple sources. The analysts have presented the various facets of the market with a particular focus on identifying the key industry influencers. The data thus presented is comprehensive, reliable, and the result of extensive research, both primary and secondary.

              INFORMATION SOURCES

              Primary sources

              • Manufacturers and suppliers
              • Channel partners
              • Industry experts
              • Strategic decision makers

              Secondary sources

              • Industry journals and periodicals
              • Government data
              • Financial reports of key industry players
              • Historical data
              • Press releases

              DATA ANALYSIS

              Data Synthesis

              • Collation of data
              • Estimation of key figures
              • Analysis of derived insights

              Data Validation

              • Triangulation with data models
              • Reference against proprietary databases
              • Corroboration with industry experts

              REPORT WRITING

              Qualitative

              • Market drivers
              • Market challenges
              • Market trends
              • Five forces analysis

              Quantitative

              • Market size and forecast
              • Market segmentation
              • Geographical insights
              • Competitive landscape

              Interested in this report?

              Get your sample now to see our research methodology and insights!

              Download Now

              Frequently Asked Questions

              Assisted Reproductive Technology (Art) market growth will increase by $ 6295.3 mn during 2024-2028.

              The Assisted Reproductive Technology (Art) market is expected to grow at a CAGR of 4.36% during 2024-2028.

              Assisted Reproductive Technology (Art) market is segmented by End-User( Fertility clinics, Hospitals, Surgical centers, Research institutes/labs, Cryobanks) Type( IVF, Artificial insemination, GIFT (Gamete Intrafallopian Transfer), ZIFT (Zygote Intrafallopian Transfer), Surrogacy)

              Cook Group Inc. (United States), CRITEX GmbH (Germany), Cryolab Ltd. (United Kingdom), Esco Micro Pte. Ltd. (Singapore), Ferring BV (Netherlands), FUJIFILM Holdings Corp. (Japan), Genea Ltd. (Australia), Hamilton Thorne Ltd. (Canada), IMV Technologies (France), Instituto Bernabeu SL (Spain), INVO Bioscience Inc. (United States), KITAZATO Corp. (Japan), Merck KGaA (Germany), Monash IVF Group Ltd. (Australia), Pantec Engineering AG (Switzerland), Smiths Group Plc (United Kingdom), The Cooper Companies Inc. (United States), Virtus Health (Australia), Vitrolife AB (Sweden), XiltriX International (Netherlands) are a few of the key vendors in the Assisted Reproductive Technology (Art) market.

              Europe will register the highest growth rate of 33% among the other regions. Therefore, the Assisted Reproductive Technology (Art) market in Europe is expected to garner significant business opportunities for the vendors during the forecast period.

              US, UK, China, Germany, Japan, India, France, Netherlands, UAE, Brazil

              • Increase in rate of infertility and obesity-related casesThe global assisted reproductive technology market is indeed driven by various factors is the driving factor this market.
              • and the increase in the rate of infertility and obesity-related cases is a significant contributor to its growth. Let's explore how these factors influence the ART market:Increase in the rate of infertility: Infertility is a major concern worldwide is the driving factor this market.
              • affecting a significant number of couples. Various factors contribute to infertility is the driving factor this market.
              • such as advanced maternal age is the driving factor this market.
              • hormonal disorders is the driving factor this market.
              • lifestyle choices is the driving factor this market.
              • genetic factors is the driving factor this market.
              • and infections. As the rate of infertility continues to rise is the driving factor this market.
              • the demand for assisted reproductive technologies like in vitro fertilization (IVF) is the driving factor this market.
              • intrauterine insemination (IUI) is the driving factor this market.
              • and other ART procedures increases. This drives the growth of the ART market as more individuals and couples seek these techniques to overcome infertility and achieve pregnancy.Obesity-related cases: Obesity has become a global epidemic is the driving factor this market.
              • with its prevalence steadily increasing. Obesity can have a negative impact on fertility and reproductive health is the driving factor this market.
              • affecting both men and women. Obesity-related conditions is the driving factor this market.
              • such as polycystic ovary syndrome (PCOS) and insulin resistance is the driving factor this market.
              • can disrupt normal reproductive function and increase the risk of infertility. Additionally is the driving factor this market.
              • obesity can affect the success rates of ART procedures. As the number of obesity-related infertility cases rises is the driving factor this market.
              • there is a greater demand for ART treatments to help individuals with fertility issues. This drives the growth of the ART market.In summary is the driving factor this market.
              • the increase in the rate of infertility and obesity-related cases has a significant impact on the growth of the global assisted reproductive technology market. These factors drive the demand for ART procedures and treatments as individuals and couples seek solutions to overcome infertility and achieve successful pregnancies is the driving factor this market.
              • which is expected to drive the growth of the market in focus during the forecast period. is the driving factor this market.

              The Assisted Reproductive Technology (Art) market vendors should focus on grabbing business opportunities from the Fertility clinics segment as it accounted for the largest market share in the base year.
              RIA - Research AI Assistant
              Ask RIA