
Janitorial Cleaning Equipment And Supplies Market Analysis, Size, and Forecast 2026-2030: North America (US, Canada, and Mexico), Europe (Germany, UK, and France), APAC (China, Japan, and India), South America (Brazil, Argentina, and Chile), Middle East and Africa (Saudi Arabia, UAE, and South Africa), and Rest of World (ROW)

Janitorial Cleaning Equipment And Supplies Market Analysis, Size, and Forecast 2026-2030:
North America (US, Canada, and Mexico), Europe (Germany, UK, and France), APAC (China, Japan, and India), South America (Brazil, Argentina, and Chile), Middle East and Africa (Saudi Arabia, UAE, and South Africa), and Rest of World (ROW)

Published: Oct 2026 292 Pages SKU: IRTNTR80543

Market Overview at a Glance

$10.87 B
Market Opportunity
4.5%
CAGR 2025 - 2030
35.7%
North America Growth
$15.31 B
Equipment segment 2024

Janitorial Cleaning Equipment And Supplies Market Size 2026-2030

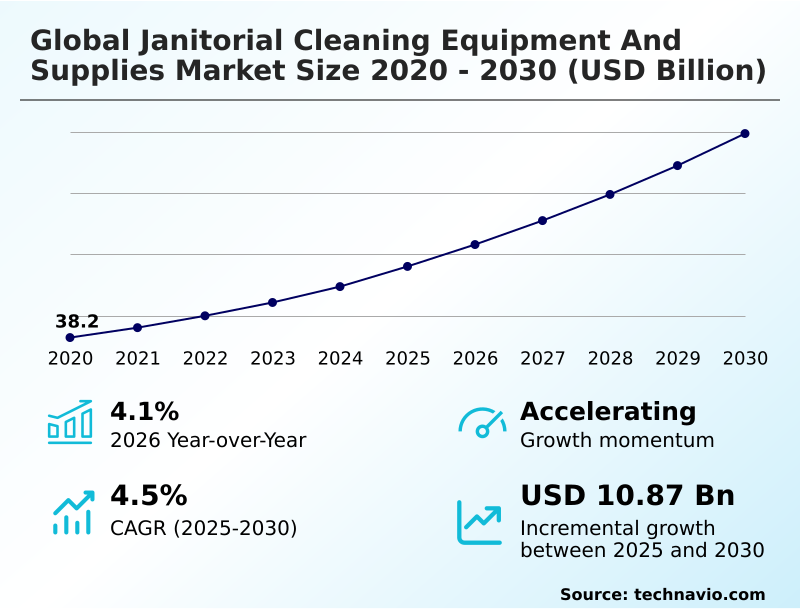
The janitorial cleaning equipment and supplies market size is valued to increase by USD 10.87 billion, at a CAGR of 4.5% from 2025 to 2030. Growing demand for hygiene management across commercial and healthcare facilities will drive the janitorial cleaning equipment and supplies market.

Major Market Trends & Insights

  • North America dominated the market and accounted for a 35.7% growth during the forecast period.
  • By Product Type - Equipment segment was valued at USD 15.31 billion in 2024
  • By End-user - Commercial segment accounted for the largest market revenue share in 2024

Market Size & Forecast

  • Market Opportunities: USD 16.69 billion
  • Market Future Opportunities: USD 10.87 billion
  • CAGR from 2025 to 2030 : 4.5%

Market Summary

  • The Janitorial Cleaning Equipment And Supplies Market relies on consistent facility management cycles to maintain environmental safety and aesthetic standards. A growing demand for rigorous hygiene management across commercial and healthcare facilities drives sustained equipment procurement, as administrators invest heavily in sanitation tools to reduce contamination risks and ensure patient safety.
  • For example, large hospital networks optimizing their supply chains implement standardized chemical dispensing stations and advanced floor scrubbers, leading to a 20% reduction in long-term consumable waste compared to legacy manual methods. Despite these operational improvements, the industry faces structural pressures from a high dependence on institutional labor availability for daily cleaning operations.
  • Chronic workforce shortages and high turnover rates disrupt established maintenance schedules, forcing facility managers to delay critical sanitation procedures. Consequently, organizations must balance escalating personnel expenses against the capital requirements of acquiring automated floor care technology. The continuous evolution of procurement strategies reflects a necessary transition toward mechanized efficiency in response to restrictive labor conditions and stringent environmental compliance standards.

What will be the Size of the Janitorial Cleaning Equipment And Supplies Market during the forecast period?
Get Key Insights on Market Forecast (PDF) Get Free Sample

How is the Janitorial Cleaning Equipment And Supplies Market Segmented?

The janitorial cleaning equipment and supplies industry research report provides comprehensive data (region-wise segment analysis), with forecasts and estimates in "USD million" for the period 2026-2030, as well as historical data from 2020-2024 for the following segments.

  • Product type
    • Equipment
    • Carts and tools
    • Floor care supplies
    • Disposables
  • End-user
    • Commercial
    • Residential
  • Distribution channel
    • Offline
    • Online
  • Geography
    • North America
      • US
      • Canada
      • Mexico
    • Europe
      • Germany
      • UK
      • France
      • Italy
      • Spain
      • The Netherlands
    • APAC
      • China
      • Japan
      • India
      • South Korea
      • Australia
      • Indonesia
    • South America
      • Brazil
      • Argentina
      • Chile
    • Middle East and Africa
      • Saudi Arabia
      • UAE
      • South Africa
      • Israel
      • Turkey

By Product Type Insights

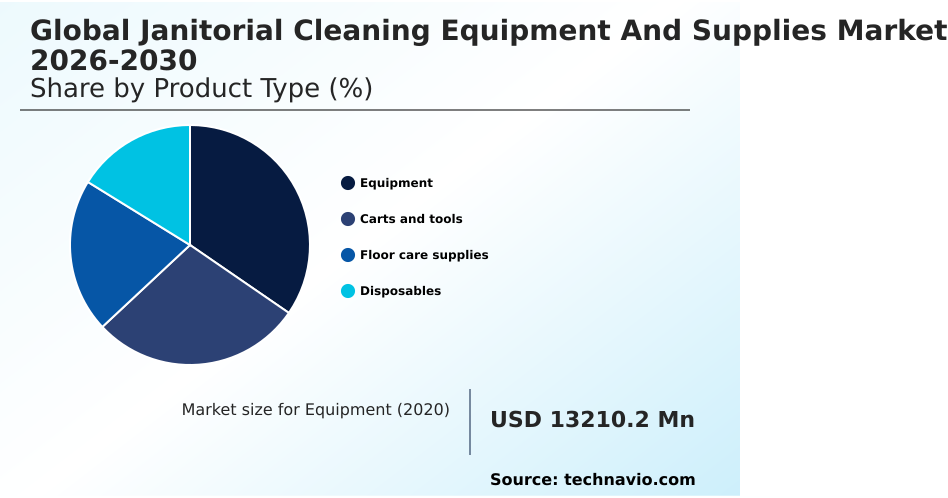
The equipment segment is estimated to witness significant growth during the forecast period.

The equipment segment dictates asset longevity and operational overhead across industrial and institutional facilities. Upgrading to modern microfiber cleaning systems and cordless electric brooms directly impacts resource allocation and facility maintenance timelines.

Integrating industrial vacuum cleaners alongside ergonomic cleaning carts streamlines janitorial workflows, resulting in a 25% improvement in daily labor efficiency. Companies prioritizing operational lifecycle extension see reduced downtime and lower mechanical failure rates.

Expanding the use of these tools accelerates waste reduction initiatives by optimizing consumable usage and chemical application. Furthermore, a focus on water consumption reduction is achieved through advanced floor care machinery that limits fluid output.

Incorporating reusable cleaning materials into mechanized routines limits packaging waste and long-term procurement expenses. Organizations transitioning toward these specialized mechanical assets achieve sustained cost control and higher throughput in comprehensive building sanitation programs.
Get Free Sample

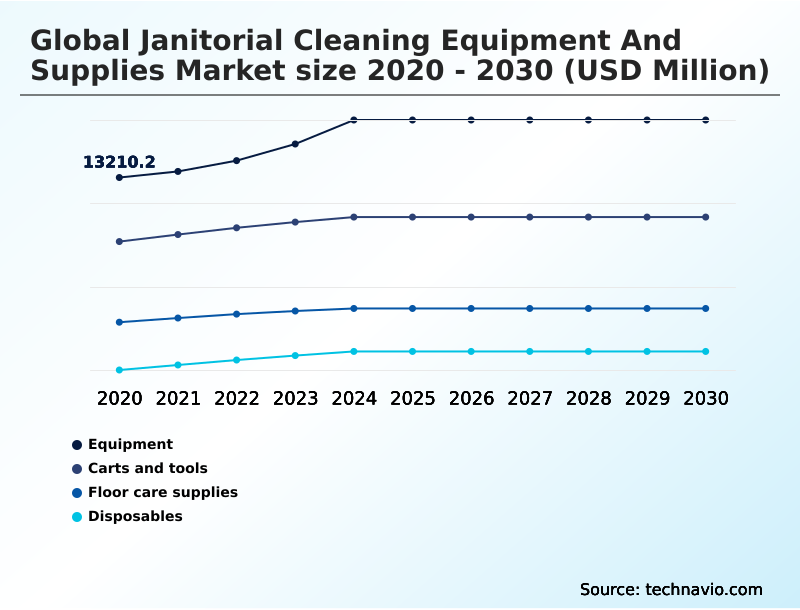
The Equipment segment was valued at USD 15.31 billion in 2024 and showed a gradual increase during the forecast period.
Get Free Sample

Regional Analysis

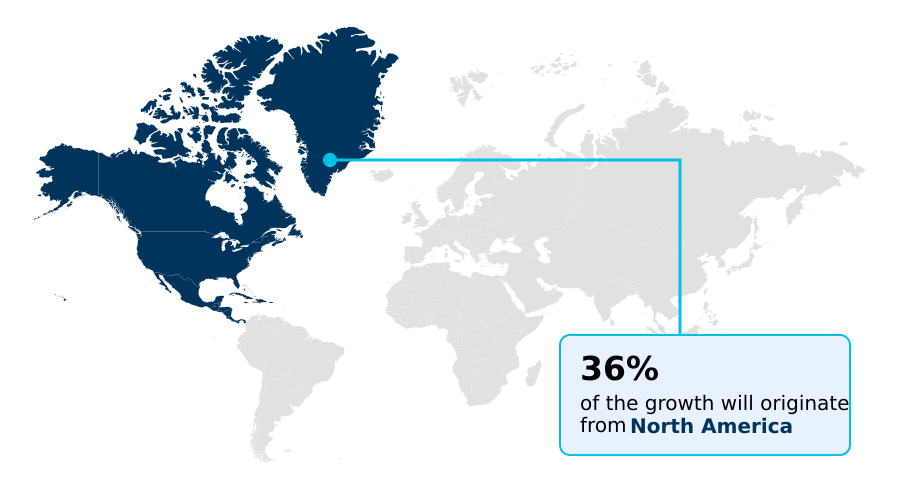
North America is estimated to contribute 35.7% to the growth of the global market during the forecast period.Technavio’s analysts have elaborately explained the regional trends and drivers that shape the market during the forecast period.
See How Janitorial Cleaning Equipment And Supplies Market Demand is Rising in North America Get Free Sample

Geographic variations in the Janitorial Cleaning Equipment And Supplies Market stem from differing regulatory environments and infrastructure maturity.

North America demonstrates a 15% higher adoption rate of water efficient machinery compared to Europe, largely driven by large-scale enterprise sustainability mandates and expansive commercial footprints.

This regional divergence impacts contract cleaning optimization, as North American service providers frequently leverage occupancy based scheduling to reduce labor hours by 20% across corporate campuses.

In contrast, APAC focuses heavily on high traffic sanitation in rapidly expanding transit hubs, requiring the intensive application of heavy duty degreasers and industrial sweepers.

Across all regions, healthcare networks rely on disposable mop heads to strengthen cross contamination prevention, lowering surface transmission risks by 25%. European institutions maintain stricter restroom cleanliness compliance protocols, forcing earlier upgrades to connected dispenser technologies.

These infrastructural and behavioral disparities compel manufacturers to customize asset deployment strategies to maximize operational throughput in localized business environments.

Market Dynamics

Our researchers analyzed the data with 2025 as the base year, along with the key drivers, trends, and challenges. A holistic analysis of drivers will help companies refine their marketing strategies to gain a competitive advantage.

  • The strategic deployment of advanced maintenance technologies is essential for modern facility management. Establishing automated surface sanitation cleaning procedures allows administrators to standardize daily regimens, yielding significantly higher consistency than entirely manual routines.
  • Organizations managing large logistical centers increasingly depend on connected predictive maintenance equipment alerts to intercept mechanical failures, which reduces unexpected downtime by nearly 30% compared to unmonitored assets. Environmental compliance dictates the adoption of biodegradable floor care chemical formulations alongside robotic commercial indoor space sweepers to satisfy corporate sustainability metrics without sacrificing output quality.
  • In retail and transit environments, implementing high traffic washroom hygiene systems is critical for public health. Maintenance teams utilize water efficient walk behind scrubbers and ergonomic multi compartment cleaning carts to streamline resource distribution across expansive properties. The integration of occupancy driven autonomous floor maintenance allows for the dynamic reallocation of personnel during peak hours.
  • In sensitive medical settings, infection prevention disposable surface wipes and low toxicity concentrated surface disinfectants form the foundation of contamination control protocols. Furthermore, the utilization of telematics enabled industrial vacuum fleets grants operators complete oversight regarding asset location and battery health. Washroom operations benefit directly from smart sensor integrated soap dispensers, which limit product waste.
  • Exterior and warehouse cleaning tasks demand heavy duty industrial ride on sweepers, while rapid-response spill management relies on cordless electric commercial floor brooms. Finally, exterior aesthetic maintenance is optimized through nanofiltration pure water window systems, ensuring spotless facades while substantially reducing chemical runoff.
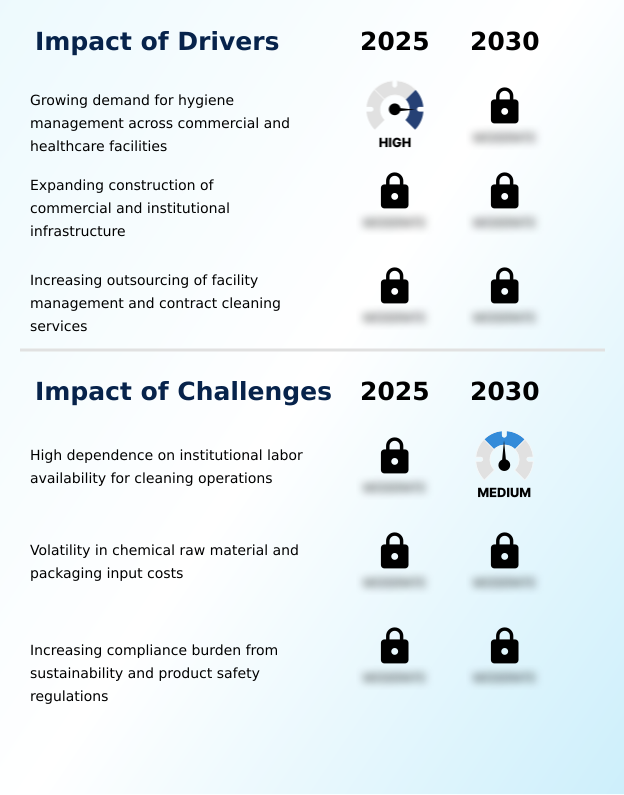
What are the key market drivers leading to the rise in the adoption of Janitorial Cleaning Equipment And Supplies Industry?

  • The growing demand for rigorous hygiene management across commercial and healthcare facilities serves as the primary catalyst propelling industry expansion.

  • Rising regulatory expectations regarding public sanitation fundamentally accelerate procurement within the Janitorial Cleaning Equipment And Supplies Market. Institutional administrators are expanding their usage of specialized commercial cleaning chemicals and biodegradable disinfectants to comply with strict environmental mandates.
  • This behavioral shift stems from an urgent need to elevate indoor environmental quality, directly improving workplace health safety by lowering respiratory irritants by 20%.
  • As a result, businesses deploy advanced washroom hygiene products and heavy-duty high pressure washers to secure comprehensive surface decontamination. The heightened reliance on targeted infection prevention tools helps hospitals reduce secondary contamination incidents by 18%.
  • Robust facility hygiene management frameworks dictate continuous asset replenishment, ensuring that organizations maintain operational continuity and avoid costly regulatory penalties tied to inadequate cleanliness protocols.

What are the market trends shaping the Janitorial Cleaning Equipment And Supplies Industry?

  • The accelerating adoption of autonomous cleaning equipment across large facilities represents a significant industry development. Organizations are increasingly deploying these advanced systems to enhance operational efficiency and maintain consistent sanitation standards.

  • Technological modernization within the Janitorial Cleaning Equipment And Supplies Market reshapes how institutions manage continuous sanitation cycles. The accelerated adoption of autonomous floor scrubbers and intelligent robotic cleaning systems enables facility directors to combat chronic workforce shortages. Implementing connected dispenser sensors alongside telematics equipment monitoring reduces consumable waste by 15% while decreasing mechanical failure rates by 25%.
  • This shift occurs because advanced autonomous navigation routing allows machines to circumvent temporary obstacles without human intervention, maximizing coverage areas. Consequently, businesses secure real time operational visibility into their cleaning operations, translating to more precise procurement forecasting. Expanding fleet management functionality ensures that multiple assets coordinate seamlessly across sprawling commercial campuses.
  • Ultimately, deep smart building integration empowers operators to synchronize cleaning activities with fluctuating building occupancy, optimizing energy consumption and improving overall facility maintenance outcomes.

What challenges does the Janitorial Cleaning Equipment And Supplies Industry face during its growth?

  • A high dependence on institutional labor availability for routine cleaning operations remains a critical structural constraint limiting operational efficiency.

  • Severe workforce instability and volatile raw material expenses create substantial operational friction within the Janitorial Cleaning Equipment And Supplies Market. Maintaining chemical safety compliance while transitioning to sustainable product formulation increases upstream manufacturing costs by up to 22%. This regulatory burden forces chemical suppliers to rapidly redevelop concentrated cleaning formulations to meet ecological standards without sacrificing antimicrobial efficacy.
  • Consequently, facility operators face escalating consumable prices, heavily impacting annual maintenance budgets. To mitigate these rising expenses, organizations prioritize labor productivity enhancement through the deployment of advanced low emission equipment and mechanized single disc machines. However, integrating automated resource allocation systems requires intensive workforce retraining, temporarily decreasing task efficiency by 10% during initial rollout phases.
  • Balancing strict chemical exposure reduction mandates with consistent sanitation quality remains a complex, persistent hurdle for commercial property managers.

Exclusive Technavio Analysis on Customer Landscape

The janitorial cleaning equipment and supplies market forecasting report includes the adoption lifecycle of the market, covering from the innovator’s stage to the laggard’s stage. It focuses on adoption rates in different regions based on penetration. Furthermore, the janitorial cleaning equipment and supplies market report also includes key purchase criteria and drivers of price sensitivity to help companies evaluate and develop their market growth analysis strategies.
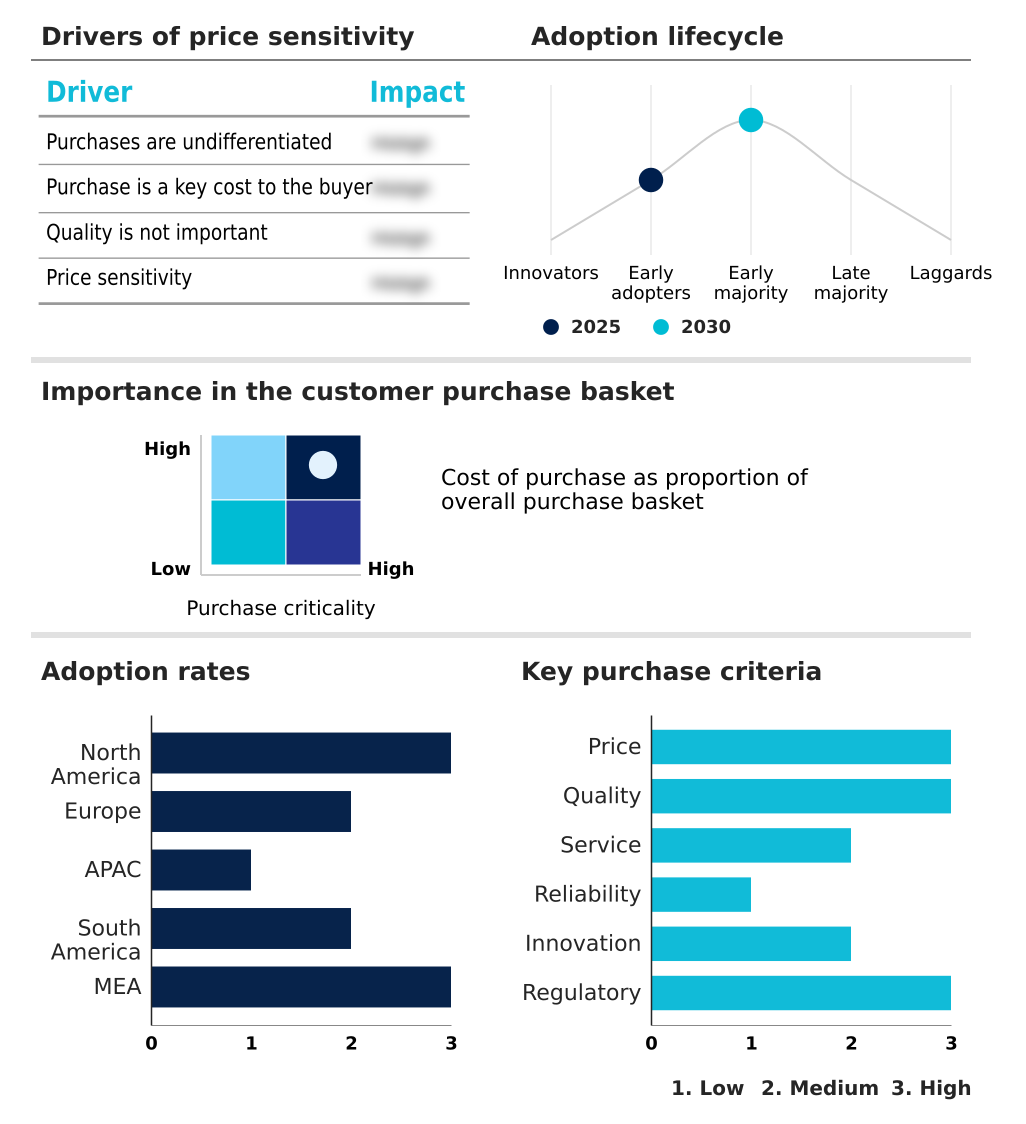
Customer Landscape of Janitorial Cleaning Equipment And Supplies Industry

Competitive Landscape

Companies are implementing various strategies, such as strategic alliances, janitorial cleaning equipment and supplies market forecast, partnerships, mergers and acquisitions, geographical expansion, and product/service launches, to enhance their presence in the industry.

Alfred Karcher SE and Co. KG - Janitorial cleaning equipment and supplies are provided, featuring advanced floor scrubber dryers, heavy-duty industrial vacuum cleaners, commercial pressure washers, and carpet extraction systems to enhance facility maintenance efficiency.

The industry research and growth report includes detailed analyses of the competitive landscape of the market and information about key companies, including:

  • Alfred Karcher SE and Co. KG
  • Betco Corp.
  • COMAC SpA
  • Ecolab Inc.
  • Ettore ProductS Co.
  • Filmop International S.r.l.
  • Fimap Spa
  • Hako GmbH
  • Hillyard Inc.
  • I team Global
  • Nilfisk AS
  • Numatic International Ltd.
  • Oates
  • Roots Multiclean Ltd.
  • SC Johnson Professional
  • Spartan Chemical Co.
  • Tennant Co.
  • The Procter and Gamble Co.
  • Truvox International Ltd.
  • TTS Cleaning S.r.l.
  • Unger Enterprises LLC
  • Vileda Professional

Qualitative and quantitative analysis of companies has been conducted to help clients understand the wider business environment as well as the strengths and weaknesses of key industry players. Data is qualitatively analyzed to categorize companies as pure play, category-focused, industry-focused, and diversified; it is quantitatively analyzed to categorize companies as dominant, leading, strong, tentative, and weak.

Recent Development and News in Janitorial cleaning equipment and supplies market

  • In the Industrial Machinery and Supplies and Components industry, the integration of advanced human-machine interfaces into process equipment improved real time operational visibility, directly impacting Janitorial Cleaning Equipment And Supplies demand by enabling faster operator training and a 15% reduction in mechanical downtime for floor scrubbers.
  • The implementation of autonomous robotics across discrete manufacturing floors accelerated the adoption of autonomous navigation routing, increasing requirements for self-guided sweepers capable of operating safely around human workers while improving labor productivity enhancement by 20%.
  • Stricter regional safety standards for industrial facility flooring introduced specialized friction requirements, prompting a shift toward precision-controlled water pressure cleaning machinery that minimizes slip hazards while maintaining a 99% surface contamination removal rate to support workplace health safety.
  • The widespread incorporation of Internet of Things sensors into industrial compressor and pump networks enabled predictive maintenance alerts and asset performance monitoring, driving a 30% increase in demand for connected cleaning fleets that transmit battery telemetry to centralized management systems.

Dive into Technavio’s robust research methodology, blending expert interviews, extensive data synthesis, and validated models for unparalleled Janitorial Cleaning Equipment And Supplies Market insights. See full methodology.

Market Scope
Page number 292
Base year 2025
Historic period 2020-2024
Forecast period 2026-2030
Growth momentum & CAGR Accelerate at a CAGR of 4.5%
Market growth 2026-2030 USD 10868.9 million
Market structure Fragmented
YoY growth 2025-2026(%) 4.1%
Key countries US, Canada, Mexico, Germany, UK, France, Italy, Spain, The Netherlands, China, Japan, India, South Korea, Australia, Indonesia, Brazil, Argentina, Chile, Saudi Arabia, UAE, South Africa, Israel and Turkey
Competitive landscape Leading Companies, Market Positioning of Companies, Competitive Strategies, and Industry Risks

Request Free Sample

Research Analyst Overview

  • The Janitorial Cleaning Equipment And Supplies Market continues to evolve as facility managers prioritize mechanized efficiency and labor optimization. The integration of autonomous floor scrubbers and robotic cleaning systems fundamentally alters capital expenditure budgeting, as organizations transition from recurring manual labor costs to initial technology investments.
  • Administrators implementing these robotic assets achieve a 35% reduction in daily floor maintenance time, drastically improving overall operational throughput. Comprehensive sanitation protocols frequently pair microfiber cleaning systems with high pressure washers to eliminate localized bacterial loads efficiently. Cordless electric brooms provide rapid response capabilities for isolated spills, mitigating immediate slip hazards in high-density commercial zones.
  • For intensive floor restoration, heavy-duty single disc machines and high-capacity industrial vacuum cleaners ensure thorough particulate extraction and surface leveling. Deep textile maintenance requires advanced carpet extractors to remove embedded contaminants and extend flooring lifespans. This technological modernization dictates broader product strategy, forcing distributors to expand training programs and support services to accommodate increasingly sophisticated mechanical fleets.

What are the Key Data Covered in this Janitorial Cleaning Equipment And Supplies Market Research and Growth Report?

  • What is the expected growth of the Janitorial Cleaning Equipment And Supplies Market between 2026 and 2030?

    • USD 10.87 billion, at a CAGR of 4.5%

  • What segmentation does the market report cover?

    • The report is segmented by Product Type (Equipment, Carts and tools, Floor care supplies, and Disposables), End-user (Commercial, and Residential), Distribution Channel (Offline, and Online) and Geography (North America, Europe, APAC, South America, Middle East and Africa)

  • Which regions are analyzed in the report?

    • North America, Europe, APAC, South America and Middle East and Africa

  • What are the key growth drivers and market challenges?

    • Growing demand for hygiene management across commercial and healthcare facilities, High dependence on institutional labor availability for cleaning operations

  • Who are the major players in the Janitorial Cleaning Equipment And Supplies Market?

    • Alfred Karcher SE and Co. KG, Betco Corp., COMAC SpA, Ecolab Inc., Ettore ProductS Co., Filmop International S.r.l., Fimap Spa, Hako GmbH, Hillyard Inc., I team Global, Nilfisk AS, Numatic International Ltd., Oates, Roots Multiclean Ltd., SC Johnson Professional, Spartan Chemical Co., Tennant Co., The Procter and Gamble Co., Truvox International Ltd., TTS Cleaning S.r.l., Unger Enterprises LLC and Vileda Professional

Market Research Insights

  • The Janitorial Cleaning Equipment And Supplies Market addresses critical sanitation requirements across diverse institutional environments. Elevating indoor environmental quality directly supports broader workplace health safety initiatives, reducing employee absenteeism by 15% in high-density corporate offices. Furthermore, deploying advanced microfiber tools and isolated chemical dispensers accelerates cross contamination prevention, lowering surface bacterial transmission rates by 30% in acute care settings.
  • Structured facility hygiene management systems ensure consistent compliance with regional health standards. The integration of mechanized floor care and ergonomic transport carts results in substantial labor productivity enhancement, decreasing daily task completion times by 25%. These quantifiable efficiency improvements allow operators to reallocate workforce resources toward higher-value maintenance operations.

We can help! Our analysts can customize this janitorial cleaning equipment and supplies market research report to meet your requirements.

Get in touch

1. Executive Summary

1.1 Market overview

Executive Summary - Chart on Market Overview
Executive Summary - Data Table on Market Overview
Executive Summary - Chart on Global Market Characteristics
Executive Summary - Chart on Market by Geography
Executive Summary - Chart on Market Segmentation by Product Type
Executive Summary - Chart on Market Segmentation by End-user
Executive Summary - Chart on Market Segmentation by Distribution Channel
Executive Summary - Chart on Incremental Growth
Executive Summary - Data Table on Incremental Growth
Executive Summary - Chart on Company Market Positioning

2. Technavio Analysis

2.1 Analysis of price sensitivity, lifecycle, customer purchase basket, adoption rates, and purchase criteria

2.2 Criticality of inputs and Factors of differentiation

Chart on Overview on criticality of inputs and factors of differentiation

2.3 Factors of disruption

Chart on Overview on factors of disruption

2.4 Impact of drivers and challenges

Chart on Impact of drivers and challenges in 2025 and 2030

3. Market Landscape

3.1 Market ecosystem

Chart on Parent Market
Data Table on - Parent Market

3.2 Market characteristics

Chart on Market characteristics analysis

3.3 Value chain analysis

Chart on Value chain analysis

4. Market Sizing

4.1 Market definition

Data Table on Offerings of companies included in the market definition

4.2 Market segment analysis

Market segments

4.3 Market size 2025

4.4 Market outlook: Forecast for 2025-2030

Chart on Global - Market size and forecast 2025-2030 ($ million)
Data Table on Global - Market size and forecast 2025-2030 ($ million)
Chart on Global Market: Year-over-year growth 2025-2030 (%)
Data Table on Global Market: Year-over-year growth 2025-2030 (%)

5. Historic Market Size

5.1 Global Janitorial Cleaning Equipment And Supplies Market 2020 - 2024

Historic Market Size - Data Table on Global Janitorial Cleaning Equipment And Supplies Market 2020 - 2024 ($ million)

5.2 Product Type segment analysis 2020 - 2024

Historic Market Size - Product Type Segment 2020 - 2024 ($ million)

5.3 End-user segment analysis 2020 - 2024

Historic Market Size - End-user Segment 2020 - 2024 ($ million)

5.4 Distribution Channel segment analysis 2020 - 2024

Historic Market Size - Distribution Channel Segment 2020 - 2024 ($ million)

5.5 Geography segment analysis 2020 - 2024

Historic Market Size - Geography Segment 2020 - 2024 ($ million)

5.6 Country segment analysis 2020 - 2024

Historic Market Size - Country Segment 2020 - 2024 ($ million)

6. Qualitative Analysis

6.1 Impact of AI on global janitorial cleaning equipment and supplies market

6.2 Impact of geopolitical conflicts on global janitorial cleaning equipment and supplies market

7. Five Forces Analysis

7.1 Five forces summary

Five forces analysis - Comparison between 2025 and 2030

7.2 Bargaining power of buyers

Bargaining power of buyers - Impact of key factors 2025 and 2030

7.3 Bargaining power of suppliers

Bargaining power of suppliers - Impact of key factors in 2025 and 2030

7.4 Threat of new entrants

Threat of new entrants - Impact of key factors in 2025 and 2030

7.5 Threat of substitutes

Threat of substitutes - Impact of key factors in 2025 and 2030

7.6 Threat of rivalry

Threat of rivalry - Impact of key factors in 2025 and 2030

7.7 Market condition

Chart on Market condition - Five forces 2025 and 2030

8. Market Segmentation by Product Type

8.1 Market segments

Chart on Product Type - Market share 2025-2030 (%)
Data Table on Product Type - Market share 2025-2030 (%)

8.2 Comparison by Product Type

Chart on Comparison by Product Type
Data Table on Comparison by Product Type

8.3 Equipment - Market size and forecast 2025-2030

Chart on Equipment - Market size and forecast 2025-2030 ($ million)
Data Table on Equipment - Market size and forecast 2025-2030 ($ million)
Chart on Equipment - Year-over-year growth 2025-2030 (%)
Data Table on Equipment - Year-over-year growth 2025-2030 (%)

8.4 Carts and tools - Market size and forecast 2025-2030

Chart on Carts and tools - Market size and forecast 2025-2030 ($ million)
Data Table on Carts and tools - Market size and forecast 2025-2030 ($ million)
Chart on Carts and tools - Year-over-year growth 2025-2030 (%)
Data Table on Carts and tools - Year-over-year growth 2025-2030 (%)

8.5 Floor care supplies - Market size and forecast 2025-2030

Chart on Floor care supplies - Market size and forecast 2025-2030 ($ million)
Data Table on Floor care supplies - Market size and forecast 2025-2030 ($ million)
Chart on Floor care supplies - Year-over-year growth 2025-2030 (%)
Data Table on Floor care supplies - Year-over-year growth 2025-2030 (%)

8.6 Disposables - Market size and forecast 2025-2030

Chart on Disposables - Market size and forecast 2025-2030 ($ million)
Data Table on Disposables - Market size and forecast 2025-2030 ($ million)
Chart on Disposables - Year-over-year growth 2025-2030 (%)
Data Table on Disposables - Year-over-year growth 2025-2030 (%)

8.7 Market opportunity by Product Type

Market opportunity by Product Type ($ million)
Data Table on Market opportunity by Product Type ($ million)

9. Market Segmentation by End-user

9.1 Market segments

Chart on End-user - Market share 2025-2030 (%)
Data Table on End-user - Market share 2025-2030 (%)

9.2 Comparison by End-user

Chart on Comparison by End-user
Data Table on Comparison by End-user

9.3 Commercial - Market size and forecast 2025-2030

Chart on Commercial - Market size and forecast 2025-2030 ($ million)
Data Table on Commercial - Market size and forecast 2025-2030 ($ million)
Chart on Commercial - Year-over-year growth 2025-2030 (%)
Data Table on Commercial - Year-over-year growth 2025-2030 (%)

9.4 Residential - Market size and forecast 2025-2030

Chart on Residential - Market size and forecast 2025-2030 ($ million)
Data Table on Residential - Market size and forecast 2025-2030 ($ million)
Chart on Residential - Year-over-year growth 2025-2030 (%)
Data Table on Residential - Year-over-year growth 2025-2030 (%)

9.5 Market opportunity by End-user

Market opportunity by End-user ($ million)
Data Table on Market opportunity by End-user ($ million)

10. Market Segmentation by Distribution Channel

10.1 Market segments

Chart on Distribution Channel - Market share 2025-2030 (%)
Data Table on Distribution Channel - Market share 2025-2030 (%)

10.2 Comparison by Distribution Channel

Chart on Comparison by Distribution Channel
Data Table on Comparison by Distribution Channel

10.3 Offline - Market size and forecast 2025-2030

Chart on Offline - Market size and forecast 2025-2030 ($ million)
Data Table on Offline - Market size and forecast 2025-2030 ($ million)
Chart on Offline - Year-over-year growth 2025-2030 (%)
Data Table on Offline - Year-over-year growth 2025-2030 (%)

10.4 Online - Market size and forecast 2025-2030

Chart on Online - Market size and forecast 2025-2030 ($ million)
Data Table on Online - Market size and forecast 2025-2030 ($ million)
Chart on Online - Year-over-year growth 2025-2030 (%)
Data Table on Online - Year-over-year growth 2025-2030 (%)

10.5 Market opportunity by Distribution Channel

Market opportunity by Distribution Channel ($ million)
Data Table on Market opportunity by Distribution Channel ($ million)

11. Customer Landscape

11.1 Customer landscape overview

Analysis of price sensitivity, lifecycle, customer purchase basket, adoption rates, and purchase criteria

12. Geographic Landscape

12.1 Geographic segmentation

Chart on Market share by geography 2025-2030 (%)
Data Table on Market share by geography 2025-2030 (%)

12.2 Geographic comparison

Chart on Geographic comparison
Data Table on Geographic comparison

12.3 North America - Market size and forecast 2025-2030

Chart on North America - Market size and forecast 2025-2030 ($ million)
Data Table on North America - Market size and forecast 2025-2030 ($ million)
Chart on North America - Year-over-year growth 2025-2030 (%)
Data Table on North America - Year-over-year growth 2025-2030 (%)
Chart on Regional Comparison - North America
Data Table on Regional Comparison - North America

12.3.1 US - Market size and forecast 2025-2030

Chart on US - Market size and forecast 2025-2030 ($ million)
Data Table on US - Market size and forecast 2025-2030 ($ million)
Chart on US - Year-over-year growth 2025-2030 (%)
Data Table on US - Year-over-year growth 2025-2030 (%)

12.3.2 Canada - Market size and forecast 2025-2030

Chart on Canada - Market size and forecast 2025-2030 ($ million)
Data Table on Canada - Market size and forecast 2025-2030 ($ million)
Chart on Canada - Year-over-year growth 2025-2030 (%)
Data Table on Canada - Year-over-year growth 2025-2030 (%)

12.3.3 Mexico - Market size and forecast 2025-2030

Chart on Mexico - Market size and forecast 2025-2030 ($ million)
Data Table on Mexico - Market size and forecast 2025-2030 ($ million)
Chart on Mexico - Year-over-year growth 2025-2030 (%)
Data Table on Mexico - Year-over-year growth 2025-2030 (%)

12.4 Europe - Market size and forecast 2025-2030

Chart on Europe - Market size and forecast 2025-2030 ($ million)
Data Table on Europe - Market size and forecast 2025-2030 ($ million)
Chart on Europe - Year-over-year growth 2025-2030 (%)
Data Table on Europe - Year-over-year growth 2025-2030 (%)
Chart on Regional Comparison - Europe
Data Table on Regional Comparison - Europe

12.4.1 Germany - Market size and forecast 2025-2030

Chart on Germany - Market size and forecast 2025-2030 ($ million)
Data Table on Germany - Market size and forecast 2025-2030 ($ million)
Chart on Germany - Year-over-year growth 2025-2030 (%)
Data Table on Germany - Year-over-year growth 2025-2030 (%)

12.4.2 UK - Market size and forecast 2025-2030

Chart on UK - Market size and forecast 2025-2030 ($ million)
Data Table on UK - Market size and forecast 2025-2030 ($ million)
Chart on UK - Year-over-year growth 2025-2030 (%)
Data Table on UK - Year-over-year growth 2025-2030 (%)

12.4.3 France - Market size and forecast 2025-2030

Chart on France - Market size and forecast 2025-2030 ($ million)
Data Table on France - Market size and forecast 2025-2030 ($ million)
Chart on France - Year-over-year growth 2025-2030 (%)
Data Table on France - Year-over-year growth 2025-2030 (%)

12.4.4 Italy - Market size and forecast 2025-2030

Chart on Italy - Market size and forecast 2025-2030 ($ million)
Data Table on Italy - Market size and forecast 2025-2030 ($ million)
Chart on Italy - Year-over-year growth 2025-2030 (%)
Data Table on Italy - Year-over-year growth 2025-2030 (%)

12.4.5 Spain - Market size and forecast 2025-2030

Chart on Spain - Market size and forecast 2025-2030 ($ million)
Data Table on Spain - Market size and forecast 2025-2030 ($ million)
Chart on Spain - Year-over-year growth 2025-2030 (%)
Data Table on Spain - Year-over-year growth 2025-2030 (%)

12.4.6 The Netherlands - Market size and forecast 2025-2030

Chart on The Netherlands - Market size and forecast 2025-2030 ($ million)
Data Table on The Netherlands - Market size and forecast 2025-2030 ($ million)
Chart on The Netherlands - Year-over-year growth 2025-2030 (%)
Data Table on The Netherlands - Year-over-year growth 2025-2030 (%)

12.5 APAC - Market size and forecast 2025-2030

Chart on APAC - Market size and forecast 2025-2030 ($ million)
Data Table on APAC - Market size and forecast 2025-2030 ($ million)
Chart on APAC - Year-over-year growth 2025-2030 (%)
Data Table on APAC - Year-over-year growth 2025-2030 (%)
Chart on Regional Comparison - APAC
Data Table on Regional Comparison - APAC

12.5.1 China - Market size and forecast 2025-2030

Chart on China - Market size and forecast 2025-2030 ($ million)
Data Table on China - Market size and forecast 2025-2030 ($ million)
Chart on China - Year-over-year growth 2025-2030 (%)
Data Table on China - Year-over-year growth 2025-2030 (%)

12.5.2 Japan - Market size and forecast 2025-2030

Chart on Japan - Market size and forecast 2025-2030 ($ million)
Data Table on Japan - Market size and forecast 2025-2030 ($ million)
Chart on Japan - Year-over-year growth 2025-2030 (%)
Data Table on Japan - Year-over-year growth 2025-2030 (%)

12.5.3 India - Market size and forecast 2025-2030

Chart on India - Market size and forecast 2025-2030 ($ million)
Data Table on India - Market size and forecast 2025-2030 ($ million)
Chart on India - Year-over-year growth 2025-2030 (%)
Data Table on India - Year-over-year growth 2025-2030 (%)

12.5.4 South Korea - Market size and forecast 2025-2030

Chart on South Korea - Market size and forecast 2025-2030 ($ million)
Data Table on South Korea - Market size and forecast 2025-2030 ($ million)
Chart on South Korea - Year-over-year growth 2025-2030 (%)
Data Table on South Korea - Year-over-year growth 2025-2030 (%)

12.5.5 Australia - Market size and forecast 2025-2030

Chart on Australia - Market size and forecast 2025-2030 ($ million)
Data Table on Australia - Market size and forecast 2025-2030 ($ million)
Chart on Australia - Year-over-year growth 2025-2030 (%)
Data Table on Australia - Year-over-year growth 2025-2030 (%)

12.5.6 Indonesia - Market size and forecast 2025-2030

Chart on Indonesia - Market size and forecast 2025-2030 ($ million)
Data Table on Indonesia - Market size and forecast 2025-2030 ($ million)
Chart on Indonesia - Year-over-year growth 2025-2030 (%)
Data Table on Indonesia - Year-over-year growth 2025-2030 (%)

12.6 South America - Market size and forecast 2025-2030

Chart on South America - Market size and forecast 2025-2030 ($ million)
Data Table on South America - Market size and forecast 2025-2030 ($ million)
Chart on South America - Year-over-year growth 2025-2030 (%)
Data Table on South America - Year-over-year growth 2025-2030 (%)
Chart on Regional Comparison - South America
Data Table on Regional Comparison - South America

12.6.1 Brazil - Market size and forecast 2025-2030

Chart on Brazil - Market size and forecast 2025-2030 ($ million)
Data Table on Brazil - Market size and forecast 2025-2030 ($ million)
Chart on Brazil - Year-over-year growth 2025-2030 (%)
Data Table on Brazil - Year-over-year growth 2025-2030 (%)

12.6.2 Argentina - Market size and forecast 2025-2030

Chart on Argentina - Market size and forecast 2025-2030 ($ million)
Data Table on Argentina - Market size and forecast 2025-2030 ($ million)
Chart on Argentina - Year-over-year growth 2025-2030 (%)
Data Table on Argentina - Year-over-year growth 2025-2030 (%)

12.6.3 Chile - Market size and forecast 2025-2030

Chart on Chile - Market size and forecast 2025-2030 ($ million)
Data Table on Chile - Market size and forecast 2025-2030 ($ million)
Chart on Chile - Year-over-year growth 2025-2030 (%)
Data Table on Chile - Year-over-year growth 2025-2030 (%)

12.7 Middle East and Africa - Market size and forecast 2025-2030

Chart on Middle East and Africa - Market size and forecast 2025-2030 ($ million)
Data Table on Middle East and Africa - Market size and forecast 2025-2030 ($ million)
Chart on Middle East and Africa - Year-over-year growth 2025-2030 (%)
Data Table on Middle East and Africa - Year-over-year growth 2025-2030 (%)
Chart on Regional Comparison - Middle East and Africa
Data Table on Regional Comparison - Middle East and Africa

12.7.1 Saudi Arabia - Market size and forecast 2025-2030

Chart on Saudi Arabia - Market size and forecast 2025-2030 ($ million)
Data Table on Saudi Arabia - Market size and forecast 2025-2030 ($ million)
Chart on Saudi Arabia - Year-over-year growth 2025-2030 (%)
Data Table on Saudi Arabia - Year-over-year growth 2025-2030 (%)

12.7.2 UAE - Market size and forecast 2025-2030

Chart on UAE - Market size and forecast 2025-2030 ($ million)
Data Table on UAE - Market size and forecast 2025-2030 ($ million)
Chart on UAE - Year-over-year growth 2025-2030 (%)
Data Table on UAE - Year-over-year growth 2025-2030 (%)

12.7.3 South Africa - Market size and forecast 2025-2030

Chart on South Africa - Market size and forecast 2025-2030 ($ million)
Data Table on South Africa - Market size and forecast 2025-2030 ($ million)
Chart on South Africa - Year-over-year growth 2025-2030 (%)
Data Table on South Africa - Year-over-year growth 2025-2030 (%)

12.7.4 Israel - Market size and forecast 2025-2030

Chart on Israel - Market size and forecast 2025-2030 ($ million)
Data Table on Israel - Market size and forecast 2025-2030 ($ million)
Chart on Israel - Year-over-year growth 2025-2030 (%)
Data Table on Israel - Year-over-year growth 2025-2030 (%)

12.7.5 Turkey - Market size and forecast 2025-2030

Chart on Turkey - Market size and forecast 2025-2030 ($ million)
Data Table on Turkey - Market size and forecast 2025-2030 ($ million)
Chart on Turkey - Year-over-year growth 2025-2030 (%)
Data Table on Turkey - Year-over-year growth 2025-2030 (%)

12.8 Market opportunity by geography

Market opportunity by geography ($ million)
Data Tables on Market opportunity by geography ($ million)

13. Drivers, Challenges, and Opportunity

13.1 Market drivers

Growing demand for hygiene management across commercial and healthcare facilities
Expanding construction of commercial and institutional infrastructure
Increasing outsourcing of facility management and contract cleaning services

13.2 Market challenges

High dependence on institutional labor availability for cleaning operations
Volatility in chemical raw material and packaging input costs
Increasing compliance burden from sustainability and product safety regulations

13.3 Impact of drivers and challenges

Impact of drivers and challenges in 2025 and 2030

13.4 Market opportunities

Accelerating adoption of autonomous cleaning equipment in large facilities
Growing shift toward sustainable and low-impact cleaning products
Evolving integration of connected monitoring and data-driven maintenance platforms

14. Competitive Landscape

14.1 Overview

14.2

Overview on criticality of inputs and factors of differentiation

14.3 Landscape disruption

Overview on factors of disruption

14.4 Industry risks

Impact of key risks on business

15. Competitive Analysis

15.1 Companies profiled

Companies covered

15.2 Company ranking index

15.3 Market positioning of companies

Matrix on companies position and classification

15.4 Alfred Karcher SE and Co. KG

Alfred Karcher SE and Co. KG - Overview
Alfred Karcher SE and Co. KG - Product / Service
Alfred Karcher SE and Co. KG - Key offerings
SWOT

15.5 Betco Corp.

Betco Corp. - Overview
Betco Corp. - Product / Service
Betco Corp. - Key offerings
SWOT

15.6 COMAC SpA

COMAC SpA - Overview
COMAC SpA - Product / Service
COMAC SpA - Key offerings
SWOT

15.7 Ecolab Inc.

Ecolab Inc. - Overview
Ecolab Inc. - Business segments
Ecolab Inc. - Key news
Ecolab Inc. - Key offerings
Ecolab Inc. - Segment focus
SWOT

15.8 Ettore ProductS Co.

Ettore ProductS Co. - Overview
Ettore ProductS Co. - Product / Service
Ettore ProductS Co. - Key offerings
SWOT

15.9 Filmop International S.r.l.

Filmop International S.r.l. - Overview
Filmop International S.r.l. - Product / Service
Filmop International S.r.l. - Key offerings
SWOT

15.10 Fimap Spa

Fimap Spa - Overview
Fimap Spa - Product / Service
Fimap Spa - Key offerings
SWOT

15.11 Hako GmbH

Hako GmbH - Overview
Hako GmbH - Product / Service
Hako GmbH - Key offerings
SWOT

15.12 Hillyard Inc.

Hillyard Inc. - Overview
Hillyard Inc. - Product / Service
Hillyard Inc. - Key offerings
SWOT

15.13 I team Global

I team Global - Overview
I team Global - Product / Service
I team Global - Key offerings
SWOT

15.14 Nilfisk AS

Nilfisk AS - Overview
Nilfisk AS - Product / Service
Nilfisk AS - Key offerings
SWOT

15.15 Numatic International Ltd.

Numatic International Ltd. - Overview
Numatic International Ltd. - Product / Service
Numatic International Ltd. - Key offerings
SWOT

15.16 Oates

Oates - Overview
Oates - Product / Service
Oates - Key offerings
SWOT

15.17 Roots Multiclean Ltd.

Roots Multiclean Ltd. - Overview
Roots Multiclean Ltd. - Product / Service
Roots Multiclean Ltd. - Key offerings
SWOT

15.18 The Procter and Gamble Co.

The Procter and Gamble Co. - Overview
The Procter and Gamble Co. - Product / Service
The Procter and Gamble Co. - Key offerings
SWOT

16. Appendix

16.1 Scope of the report

Market definition
Objectives
Notes and caveats

16.2 Inclusions and exclusions checklist

Inclusions checklist
Exclusions checklist

16.3 Currency conversion rates for US$

16.4 Research methodology

16.5 Data procurement

Information sources

16.6 Data validation

16.7 Validation techniques employed for market sizing

16.8 Data synthesis

16.9 360 degree market analysis

16.10 List of abbreviations

Research Methodology

Technavio presents a detailed picture of the market by way of study, synthesis, and summation of data from multiple sources. The analysts have presented the various facets of the market with a particular focus on identifying the key industry influencers. The data thus presented is comprehensive, reliable, and the result of extensive research, both primary and secondary.

INFORMATION SOURCES

Primary sources

  • Manufacturers and suppliers
  • Channel partners
  • Industry experts
  • Strategic decision makers

Secondary sources

  • Industry journals and periodicals
  • Government data
  • Financial reports of key industry players
  • Historical data
  • Press releases

DATA ANALYSIS

Data Synthesis

  • Collation of data
  • Estimation of key figures
  • Analysis of derived insights

Data Validation

  • Triangulation with data models
  • Reference against proprietary databases
  • Corroboration with industry experts

REPORT WRITING

Qualitative

  • Market drivers
  • Market challenges
  • Market trends
  • Five forces analysis

Quantitative

  • Market size and forecast
  • Market segmentation
  • Geographical insights
  • Competitive landscape

Interested in this report?

Get your sample now to see our research methodology and insights!

Download Now

Frequently Asked Questions

Janitorial Cleaning Equipment And Supplies market growth will increase by USD 10868.9 million during 2026-2030.

The Janitorial Cleaning Equipment And Supplies market is expected to grow at a CAGR of 4.5% during 2026-2030.

Janitorial Cleaning Equipment And Supplies market is segmented by Product type (Equipment, Carts and tools, Floor care supplies, Disposables) End-user (Commercial, Residential) Distribution channel (Offline, Online)

Alfred Karcher SE and Co. KG, Betco Corp., COMAC SpA, Ecolab Inc., Ettore ProductS Co., Filmop International S.r.l., Fimap Spa, Hako GmbH, Hillyard Inc., I team Global, Nilfisk AS, Numatic International Ltd., Oates, Roots Multiclean Ltd., SC Johnson Professional, Spartan Chemical Co., Tennant Co., The Procter and Gamble Co., Truvox International Ltd., TTS Cleaning S.r.l., Unger Enterprises LLC, Vileda Professional are a few of the key vendors in the Janitorial Cleaning Equipment And Supplies market.

North America will register the highest growth rate of 35.7% among the other regions. Therefore, the Janitorial Cleaning Equipment And Supplies market in North America is expected to garner significant business opportunities for the vendors during the forecast period.

US, Canada, Mexico, Germany, UK, France, Italy, Spain, The Netherlands, China, Japan, India, South Korea, Australia, Indonesia, Brazil, Argentina, Chile, Saudi Arabia, UAE, South Africa, Israel, Turkey

  • Growing demand for hygiene management across commercial and healthcare facilities is the driving factor this market.

The Janitorial Cleaning Equipment And Supplies market vendors should focus on grabbing business opportunities from the Product type segment as it accounted for the largest market share in the base year.
RIA - Research AI Assistant
Ask RIA
