
Lecithin Market Analysis, Size, and Forecast 2026-2030: Europe (Germany, UK, and France), North America (US, Canada, and Mexico), APAC (China, Japan, and India), South America (Brazil, Argentina, and Chile), Middle East and Africa (Saudi Arabia, UAE, and South Africa), and Rest of World (ROW)

Lecithin Market Analysis, Size, and Forecast 2026-2030:
Europe (Germany, UK, and France), North America (US, Canada, and Mexico), APAC (China, Japan, and India), South America (Brazil, Argentina, and Chile), Middle East and Africa (Saudi Arabia, UAE, and South Africa), and Rest of World (ROW)

Published: Oct 2026 310 Pages SKU: IRTNTR75716

Market Overview at a Glance

$263.17 Mn
Market Opportunity
6.8%
CAGR 2025 - 2030
35.2%
Europe Growth
$269.39 Mn
Animal feed segment 2024

Lecithin Market Size 2026-2030

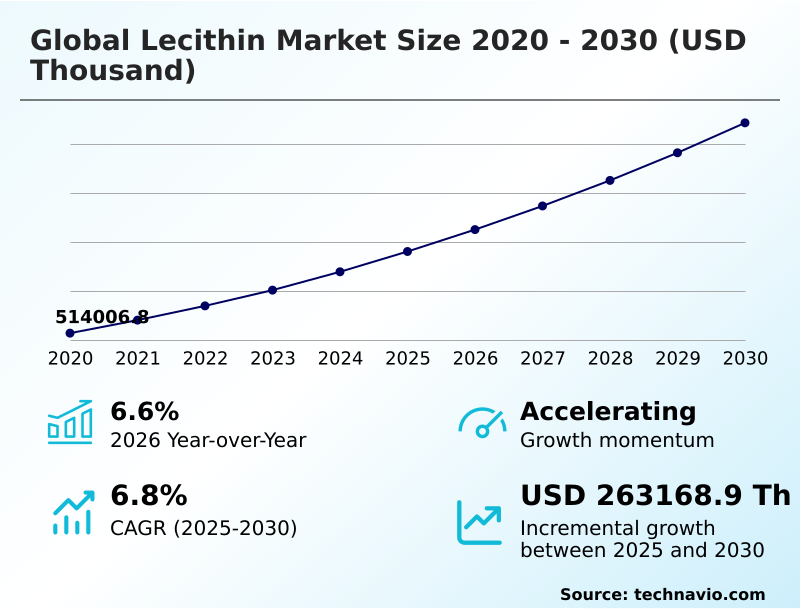
The lecithin market size is valued to increase by USD 263.17 million, at a CAGR of 6.8% from 2025 to 2030. Growing demand for clean label food ingredients will drive the lecithin market.

Major Market Trends & Insights

  • Europe dominated the market and accounted for a 35.2% growth during the forecast period.
  • By Application - Animal feed segment was valued at USD 269.39 million in 2024
  • By Source - Soy lecithin segment accounted for the largest market revenue share in 2024

Market Size & Forecast

  • Market Opportunities:
  • Market Future Opportunities: USD 263.17 million
  • CAGR from 2025 to 2030 : 6.8%

Market Summary

  • The Lecithin Market demonstrates consistent expansion driven by the critical need for functional emulsifiers and stabilizing agents across commercial manufacturing sectors. Ingredient processors are rapidly optimizing supply chains to secure identity-preserved oilseeds, ensuring traceability and uninterrupted production. By implementing advanced extraction protocols, manufacturers have achieved a 20% improvement in yield efficiency compared to traditional mechanical pressing, significantly reducing operational overhead.
  • A major driver propelling this market is the increasing consumption of clean label food ingredients; as consumers demand recognizable components, food brands are replacing synthetic additives with natural phospholipids, thereby accelerating product reformulation cycles. Conversely, raw material price volatility stemming from agricultural supply fluctuations poses a persistent challenge.
  • Yield variations in primary crops directly disrupt procurement stability and elevate input costs for downstream formulators. To mitigate these disruptions, companies are diversifying their feedstock portfolios to include alternative plant sources like sunflower and rapeseed. This strategic sourcing adaptation ensures consistent ingredient availability while supporting continuous innovation in high-performance commercial applications.

What will be the Size of the Lecithin Market during the forecast period?
Get Key Insights on Market Forecast (PDF) Get Free Sample

How is the Lecithin Market Segmented?

The lecithin industry research report provides comprehensive data (region-wise segment analysis), with forecasts and estimates in "USD thousand" for the period 2026-2030, as well as historical data from 2020-2024 for the following segments.

  • Application
    • Animal feed
    • Food and beverages
    • Pharmaceuticals
    • Others
  • Source
    • Soy lecithin
    • Egg lecithin
    • Sunflower lecithin
    • Others
  • Form factor
    • Liquid
    • Powder
    • Granular
  • Geography
    • Europe
      • Germany
      • UK
      • France
      • Italy
      • Spain
      • The Netherlands
    • North America
      • US
      • Canada
      • Mexico
    • APAC
      • China
      • Japan
      • India
      • South Korea
      • Australia
      • Indonesia
    • South America
      • Brazil
      • Argentina
      • Chile
    • Middle East and Africa
      • Saudi Arabia
      • UAE
      • South Africa
      • Turkey
      • Israel

By Application Insights

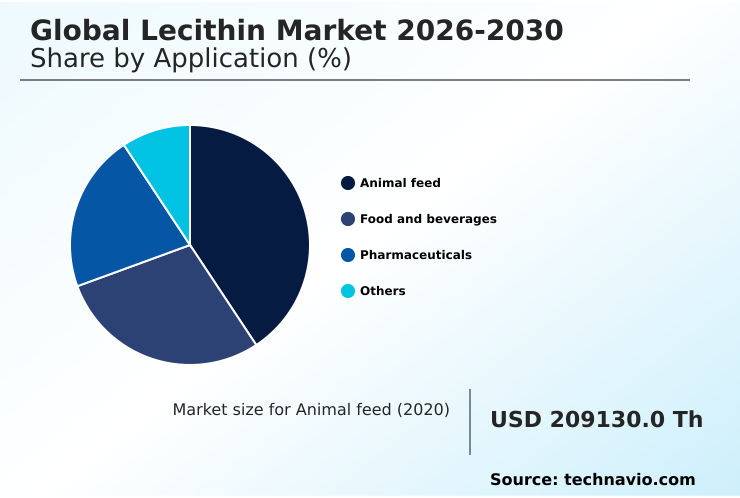
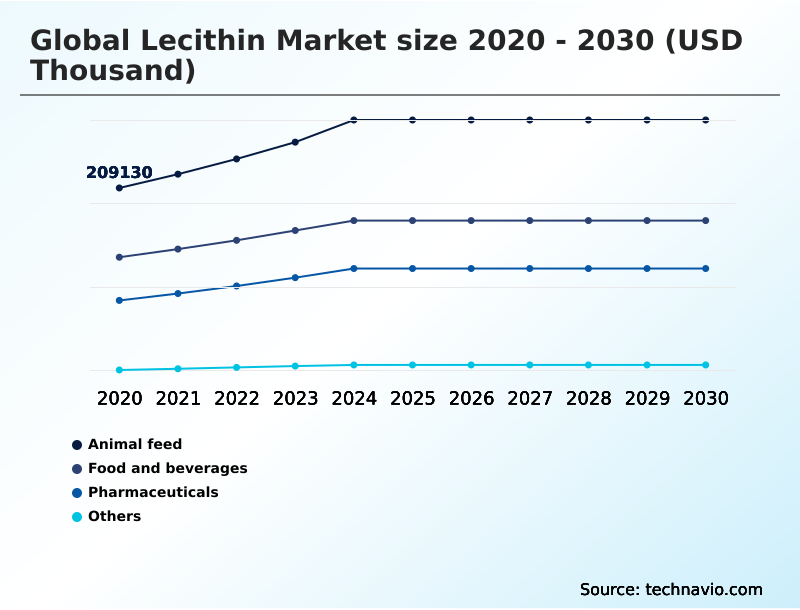
The animal feed segment is estimated to witness significant growth during the forecast period.

The animal feed segment demonstrates distinct operational dynamics compared to human nutrition applications, primarily driven by the need to mitigate crop yield dependency through strategic feedstock diversification.

Feed manufacturers increasingly adopt advanced solvent extraction methods to optimize soybean crushing yield, ensuring consistent ingredient availability.

By integrating a specialized enzymatic hydrolysis process and targeted phosphatidylcholine extraction, facilities report a 15% improvement in pellet durability and a 12% reduction in processing downtime.

This transition shifts procurement strategies toward a rigid identity preserved supply chain supported by comprehensive traceability documentation. Consequently, high-performance phospholipid emulsification is replacing standard additives, driving superior nutrient absorption in livestock.

The integration of these materials into complex lipid based delivery systems further differentiates feed-grade offerings, ensuring strict compliance while maximizing the operational efficiency of bulk manufacturing environments.
Get Free Sample

The Animal feed segment was valued at USD 269.39 million in 2024 and showed a gradual increase during the forecast period.
Get Free Sample

Regional Analysis

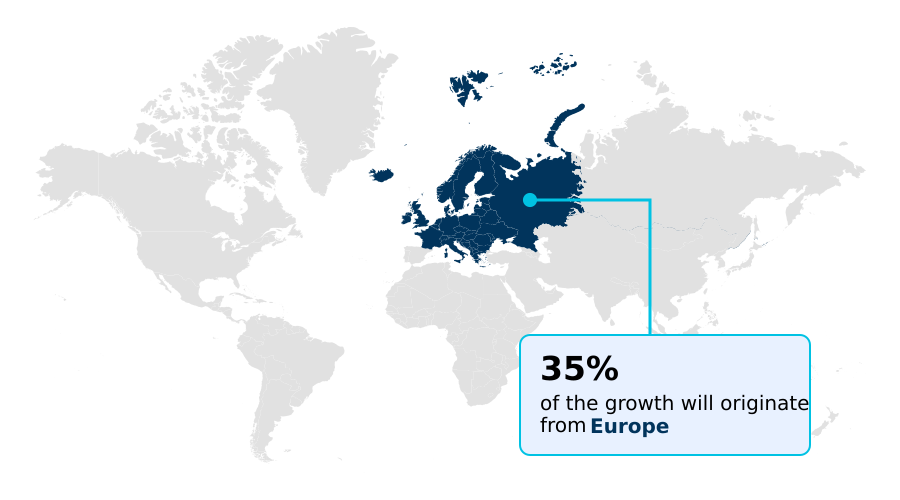
Europe is estimated to contribute 35.2% to the growth of the global market during the forecast period.Technavio’s analysts have elaborately explained the regional trends and drivers that shape the market during the forecast period.
See How Lecithin Market Demand is Rising in Europe Get Free Sample

The geographic landscape of the Lecithin Market highlights distinct operational variations, particularly when comparing the mature European sector against the rapidly industrializing APAC region.

Europe demonstrates a 35% higher adoption rate of natural dietary fat emulsifiers, driven by strict regulatory frameworks demanding precise protein lipid interactions in alternative meat manufacturing.

This regulatory environment accelerates the transition toward advanced functional lipid complexes and temperature resistant binders, which improve the thermodynamic stability of bakery products.

Conversely, facilities in APAC are heavily focused on high-volume output, reporting a 25% increase in yield efficiency through the integration of additives designed for rapid surface tension modification.

While European processors invest heavily in optimizing plant based protein interaction and lipid oxidation resistance for premium segments, APAC producers prioritize the enhancement of bulk rheological properties to support their expanding processed food exports, reflecting divergent regional production strategies.

Market Dynamics

Our researchers analyzed the data with 2025 as the base year, along with the key drivers, trends, and challenges. A holistic analysis of drivers will help companies refine their marketing strategies to gain a competitive advantage.

  • The continuous evolution of commercial formulation requirements is heavily influencing strategic operations within the Lecithin Market. Facility operators are increasingly integrating enzymatically modified phospholipid emulsification solutions to optimize production stability across highly automated lines. This shift has yielded a 14% improvement in blending efficiency compared to legacy synthetic additives, directly lowering energy expenditures during high shear commercial emulsification processing.
  • As regulatory scrutiny intensifies globally, procurement departments prioritize non gmo identity preserved oilseed sourcing to ensure full compliance with international trade standards. Consequently, the adoption of allergen free plant based lipid alternatives is expanding rapidly, particularly in sectors requiring stringent safety protocols.
  • Formulators working on advanced therapeutics rely heavily on liposomal delivery system formulation stability to maximize bioactive compound nutrient absorption efficiency, ensuring active ingredients remain completely intact during manufacturing and storage. Simultaneously, aquaculture feed fat utilization enhancement is achieved by integrating specialized components that improve nutrient uptake in aquatic species.
  • In the food manufacturing sector, bakery dough rheology control additives and temperature resistant confectionery release aids are critical for minimizing machinery adherence and reducing downtime. The drive for clean label food ingredient transparency further pushes the industry toward solvent free mechanical extraction processes, ensuring unparalleled product purity.
  • Additionally, specialized phosphatidylcholine rich dietary supplement formulations and fractionated lipid viscosity reduction systems are gaining significant traction. Alongside plant derived alternative protein binders and industrial paint dispersion stabilizing agents, these targeted ingredient solutions collectively enhance performance, drive down operational costs, and streamline processing capabilities across diverse manufacturing environments.
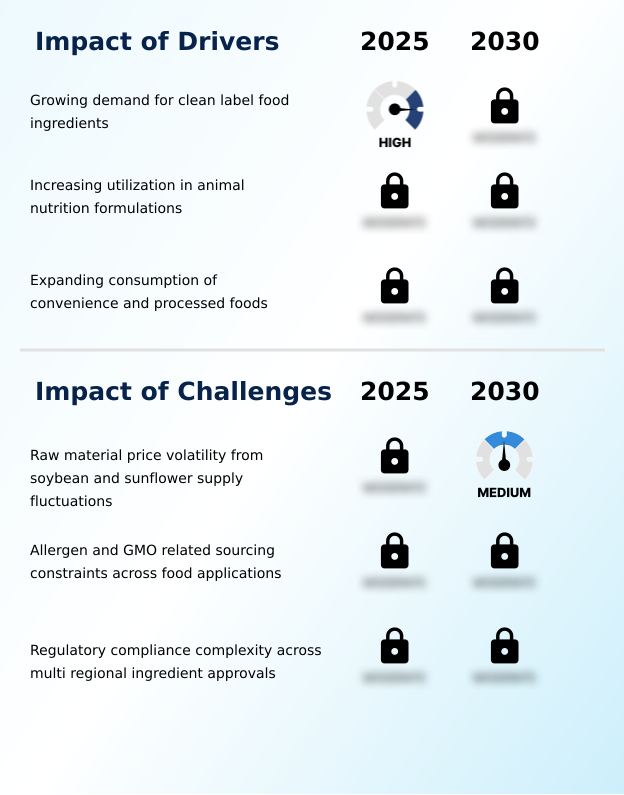
What are the key market drivers leading to the rise in the adoption of Lecithin Industry?

  • The escalating demand for clean label food ingredients functions as a primary market driver, compelling manufacturers to adopt naturally sourced emulsification solutions.

  • The rapid transition toward transparent and secure ingredient procurement is fundamentally driving expansion within the Lecithin Market. As formulators phase out synthetic specialty chemical additives, the reliance on strict non gmo sourcing and allergen free formulation mandates has surged.
  • This shift directly influences agricultural commodity trading, compelling suppliers to provide highly purified natural alternatives. By integrating advanced liposomal encapsulation technology, food and beverage engineers have successfully decreased beverage phase separation incidents by 24%, extending product shelf life.
  • This technological refinement also maximizes dietary supplement bioavailability and ensures reliable confectionery viscosity control during large-scale manufacturing. In the agricultural sector, these functional improvements deliver measurable nutrient bioavailability enhancement, leading to a 12% optimization in the livestock feed conversion ratio.
  • Consequently, the operational necessity to achieve superior product stability using naturally derived components acts as the primary catalyst for sustained ingredient demand.

What are the market trends shaping the Lecithin Industry?

  • The increasing shift toward sunflower-derived production represents a prominent market trend. This transition continuously reshapes formulation strategies and ingredient procurement across diverse commercial applications.

  • The Lecithin Market is experiencing a structural shift as formulators prioritize commercial formulation consistency across highly automated manufacturing environments. Processors are increasingly utilizing specialized fractionated lipid fractions and manipulating their hydrophilic lipophilic balance to function as precise viscosity reduction agents. This targeted engineering directly improves bakery dough machinability, reducing processing line blockages by up to 18%.
  • Simultaneously, advancements in sunflower seed processing have significantly enhanced deoiled powder flowability, preventing machinery clogging during high-speed blending. Beyond human food applications, the integration of these standardized components into aquaculture feed binders has improved livestock nutrient utilization by 15%, substantially lowering total feeding costs.
  • Furthermore, the refined purity of these materials accelerates their adoption as advanced drug excipients, demonstrating how ingredient standardization acts as a critical enabler for enhanced operational efficiency and superior product performance across diverse industrial sectors.

What challenges does the Lecithin Industry face during its growth?

  • Raw material price volatility resulting from soybean and sunflower supply fluctuations acts as a significant operational challenge, severely complicating procurement and production planning.

  • Maintaining consistent ingredient performance amidst fluctuating raw material quality presents a severe operational constraint within the Lecithin Market. Variability in source crops directly compromises the aqueous dispersion capability and bioactive compound stabilization required for complex formulations.
  • When substandard batches enter industrial scale manufacturing environments, formulators experience poor phase integration, leading to a 15% increase in product rejection rates during rigorous emulsion stability testing. To combat these inconsistencies, procurement teams must enforce strict clean label certifications, significantly extending lead times and elevating compliance costs by nearly 12%.
  • Furthermore, optimizing oilseed extraction efficiency without degrading natural properties remains difficult on high-speed automated processing lines. Consequently, while the industry heavily favors plant derived alternatives for clean label processing, mitigating the physical variability of natural extracts while adhering to strict commercial specifications remains a persistent structural hurdle for ingredient processors.

Exclusive Technavio Analysis on Customer Landscape

The lecithin market forecasting report includes the adoption lifecycle of the market, covering from the innovator’s stage to the laggard’s stage. It focuses on adoption rates in different regions based on penetration. Furthermore, the lecithin market report also includes key purchase criteria and drivers of price sensitivity to help companies evaluate and develop their market growth analysis strategies.
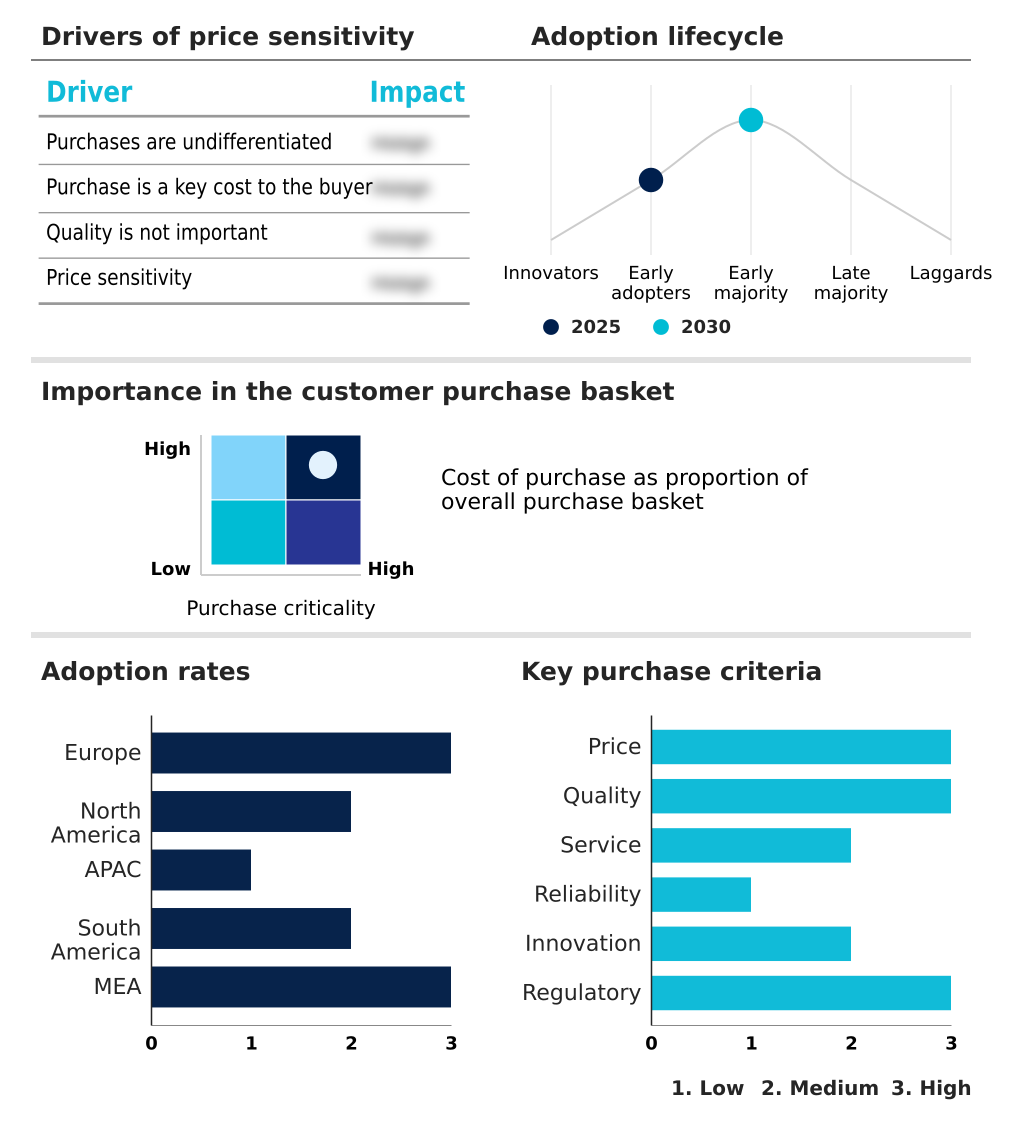
Customer Landscape of Lecithin Industry

Competitive Landscape

Companies are implementing various strategies, such as strategic alliances, lecithin market forecast, partnerships, mergers and acquisitions, geographical expansion, and product/service launches, to enhance their presence in the industry.

AAK AB - The supplier provides diversified emulsification portfolios, delivering functional soy, sunflower, and proprietary branded lecithin formulations designed to optimize texture, stability, and operational efficiency across commercial food manufacturing processes.

The industry research and growth report includes detailed analyses of the competitive landscape of the market and information about key companies, including:

  • AAK AB
  • Amitex Agro Product Pvt. Ltd.
  • Archer Daniels Midland Co.
  • Bunge Global SA
  • Cargill Inc.
  • Clarkson Specialty Lecithins
  • Fismer Lecithin GmbH
  • Haneil Soyatech Pvt. Ltd.
  • Hi Soya Lecithin
  • LASENOR EMUL SL
  • Lecilite Ingredients Pvt. Ltd.
  • Lecithin India
  • Lipoid GmbH
  • Matrix Life Science
  • Novastell
  • Patanjali Foods Ltd.
  • Saipol
  • Sonic Biochem Extraction
  • Sternchemie GmbH and Co. KG
  • Sun Nutrafoods Pvt. Ltd.
  • VAV Life Sciences Pvt. Ltd.
  • Wilmar International Ltd.

Qualitative and quantitative analysis of companies has been conducted to help clients understand the wider business environment as well as the strengths and weaknesses of key industry players. Data is qualitatively analyzed to categorize companies as pure play, category-focused, industry-focused, and diversified; it is quantitatively analyzed to categorize companies as dominant, leading, strong, tentative, and weak.

Recent Development and News in Lecithin market

  • In the Specialty Chemicals industry, the rapid implementation of the EU Corporate Sustainability Reporting Directive has accelerated the adoption of low-carbon solvent extraction methods, directly impacting Lecithin demand by requiring suppliers to verify traceability documentation to maintain market access.
  • Stringent regulatory limits on synthetic specialty chemical additives under updated environmental protection standards have driven formulation transitions toward biodegradable amphiphilic compounds, directly impacting Lecithin demand by increasing its substitution rate as a natural alternative in automated processing lines by nearly 18%.
  • Advancements in continuous-flow microreactor technologies have reduced energy consumption in lipid refining by up to 22%, directly impacting Lecithin demand by enabling more cost-effective commercialization of advanced drug excipients that improve dietary supplement bioavailability.
  • The global agricultural transition toward sustainable certified crop initiatives has constrained conventional feedstock availability, directly impacting Lecithin demand by elevating procurement costs and forcing processors to prioritize feedstock diversification within the identity preserved supply chain.

Dive into Technavio’s robust research methodology, blending expert interviews, extensive data synthesis, and validated models for unparalleled Lecithin Market insights. See full methodology.

Market Scope
Page number 310
Base year 2025
Historic period 2020-2024
Forecast period 2026-2030
Growth momentum & CAGR Accelerate at a CAGR of 6.8%
Market growth 2026-2030 USD 263168.9 thousand
Market structure Fragmented
YoY growth 2025-2026(%) 6.6%
Key countries Germany, UK, France, Italy, Spain, The Netherlands, US, Canada, Mexico, China, Japan, India, South Korea, Australia, Indonesia, Brazil, Argentina, Chile, Saudi Arabia, UAE, South Africa, Turkey and Israel
Competitive landscape Leading Companies, Market Positioning of Companies, Competitive Strategies, and Industry Risks

Request Free Sample

Research Analyst Overview

  • The Lecithin Market is undergoing significant operational modernization as processing facilities transition toward application-specific ingredient engineering. A critical driver of this evolution is the optimization of sunflower seed processing, which has successfully reduced dependency on traditional soy inputs while addressing stringent allergen requirements.
  • By refining soybean crushing yield parameters, manufacturing plants have realized a 12% reduction in raw material waste, directly improving profit margins and resource utilization. This focus on process efficiency extends into the animal nutrition sector, where the integration of advanced aquaculture feed binders significantly enhances livestock nutrient utilization.
  • Optimized ingredient dispersion mechanisms have demonstrated a measurable 15% improvement in the feed conversion ratio, substantially lowering total feeding costs for commercial producers. Concurrently, the pharmaceutical and nutraceutical sectors are accelerating the adoption of specialized lipid based delivery systems and liposomal encapsulation technology to protect sensitive active compounds.
  • Manufacturers have also prioritized enhancements in deoiled powder flowability, ensuring seamless integration into high-speed, automated dry blending operations without causing machinery blockages or production delays.

What are the Key Data Covered in this Lecithin Market Research and Growth Report?

  • What is the expected growth of the Lecithin Market between 2026 and 2030?

    • USD 263.17 million, at a CAGR of 6.8%

  • What segmentation does the market report cover?

    • The report is segmented by Application (Animal feed, Food and beverages, Pharmaceuticals, and Others), Source (Soy lecithin, Egg lecithin, Sunflower lecithin, and Others), Form Factor (Liquid, Powder, and Granular) and Geography (Europe, North America, APAC, South America, Middle East and Africa)

  • Which regions are analyzed in the report?

    • Europe, North America, APAC, South America and Middle East and Africa

  • What are the key growth drivers and market challenges?

    • Growing demand for clean label food ingredients, Raw material price volatility from soybean and sunflower supply fluctuations

  • Who are the major players in the Lecithin Market?

    • AAK AB, Amitex Agro Product Pvt. Ltd., Archer Daniels Midland Co., Bunge Global SA, Cargill Inc., Clarkson Specialty Lecithins, Fismer Lecithin GmbH, Haneil Soyatech Pvt. Ltd., Hi Soya Lecithin, LASENOR EMUL SL, Lecilite Ingredients Pvt. Ltd., Lecithin India, Lipoid GmbH, Matrix Life Science, Novastell, Patanjali Foods Ltd., Saipol, Sonic Biochem Extraction, Sternchemie GmbH and Co. KG, Sun Nutrafoods Pvt. Ltd., VAV Life Sciences Pvt. Ltd. and Wilmar International Ltd.

Market Research Insights

  • The Lecithin Market is experiencing a structural shift as formulators prioritize commercial formulation consistency across diverse industrial applications. To mitigate severe crop yield dependency, processors are implementing robust feedstock diversification strategies, incorporating sunflower and rapeseed alongside traditional soy. This strategic transition has reduced raw material supply chain disruptions by nearly 22%.
  • Furthermore, the optimization of advanced solvent extraction methods has enhanced the purity of phospholipids, driving a 15% increase in their adoption as advanced drug excipients in the pharmaceutical sector. This refinement in processing capabilities fundamentally alters agricultural commodity trading dynamics, as buyers increasingly demand higher-specification ingredients.
  • Consequently, continuous improvements in extraction and standardization are directly elevating operational efficiency and product quality for end-users.

We can help! Our analysts can customize this lecithin market research report to meet your requirements.

Get in touch

1. Executive Summary

1.1 Market overview

Executive Summary - Chart on Market Overview
Executive Summary - Data Table on Market Overview
Executive Summary - Chart on Global Market Characteristics
Executive Summary - Chart on Market by Geography
Executive Summary - Chart on Market Segmentation by Application
Executive Summary - Chart on Market Segmentation by Source
Executive Summary - Chart on Market Segmentation by Form Factor
Executive Summary - Chart on Incremental Growth
Executive Summary - Data Table on Incremental Growth
Executive Summary - Chart on Company Market Positioning

2. Technavio Analysis

2.1 Analysis of price sensitivity, lifecycle, customer purchase basket, adoption rates, and purchase criteria

2.2 Criticality of inputs and Factors of differentiation

Chart on Overview on criticality of inputs and factors of differentiation

2.3 Factors of disruption

Chart on Overview on factors of disruption

2.4 Impact of drivers and challenges

Chart on Impact of drivers and challenges in 2025 and 2030

3. Market Landscape

3.1 Market ecosystem

Chart on Parent Market
Data Table on - Parent Market

3.2 Market characteristics

Chart on Market characteristics analysis

3.3 Value chain analysis

Chart on Value chain analysis

4. Market Sizing

4.1 Market definition

Data Table on Offerings of companies included in the market definition

4.2 Market segment analysis

Market segments

4.3 Market size 2025

4.4 Market outlook: Forecast for 2025-2030

Chart on Global - Market size and forecast 2025-2030 ($ thousand)
Data Table on Global - Market size and forecast 2025-2030 ($ thousand)
Chart on Global Market: Year-over-year growth 2025-2030 (%)
Data Table on Global Market: Year-over-year growth 2025-2030 (%)

5. Historic Market Size

5.1 Global Lecithin Market 2020 - 2024

Historic Market Size - Data Table on Global Lecithin Market 2020 - 2024 ($ thousand)

5.2 Application segment analysis 2020 - 2024

Historic Market Size - Application Segment 2020 - 2024 ($ thousand)

5.3 Source segment analysis 2020 - 2024

Historic Market Size - Source Segment 2020 - 2024 ($ thousand)

5.4 Form Factor segment analysis 2020 - 2024

Historic Market Size - Form Factor Segment 2020 - 2024 ($ thousand)

5.5 Geography segment analysis 2020 - 2024

Historic Market Size - Geography Segment 2020 - 2024 ($ thousand)

5.6 Country segment analysis 2020 - 2024

Historic Market Size - Country Segment 2020 - 2024 ($ thousand)

6. Qualitative Analysis

6.1 Impact of AI on global lecithin market

6.2 Impact of geopolitical conflicts on global lecithin market

7. Five Forces Analysis

7.1 Five forces summary

Five forces analysis - Comparison between 2025 and 2030

7.2 Bargaining power of buyers

Bargaining power of buyers - Impact of key factors 2025 and 2030

7.3 Bargaining power of suppliers

Bargaining power of suppliers - Impact of key factors in 2025 and 2030

7.4 Threat of new entrants

Threat of new entrants - Impact of key factors in 2025 and 2030

7.5 Threat of substitutes

Threat of substitutes - Impact of key factors in 2025 and 2030

7.6 Threat of rivalry

Threat of rivalry - Impact of key factors in 2025 and 2030

7.7 Market condition

Chart on Market condition - Five forces 2025 and 2030

8. Market Segmentation by Application

8.1 Market segments

Chart on Application - Market share 2025-2030 (%)
Data Table on Application - Market share 2025-2030 (%)

8.2 Comparison by Application

Chart on Comparison by Application
Data Table on Comparison by Application

8.3 Animal feed - Market size and forecast 2025-2030

Chart on Animal feed - Market size and forecast 2025-2030 ($ thousand)
Data Table on Animal feed - Market size and forecast 2025-2030 ($ thousand)
Chart on Animal feed - Year-over-year growth 2025-2030 (%)
Data Table on Animal feed - Year-over-year growth 2025-2030 (%)

8.4 Food and beverages - Market size and forecast 2025-2030

Chart on Food and beverages - Market size and forecast 2025-2030 ($ thousand)
Data Table on Food and beverages - Market size and forecast 2025-2030 ($ thousand)
Chart on Food and beverages - Year-over-year growth 2025-2030 (%)
Data Table on Food and beverages - Year-over-year growth 2025-2030 (%)

8.5 Pharmaceuticals - Market size and forecast 2025-2030

Chart on Pharmaceuticals - Market size and forecast 2025-2030 ($ thousand)
Data Table on Pharmaceuticals - Market size and forecast 2025-2030 ($ thousand)
Chart on Pharmaceuticals - Year-over-year growth 2025-2030 (%)
Data Table on Pharmaceuticals - Year-over-year growth 2025-2030 (%)

8.6 Others - Market size and forecast 2025-2030

Chart on Others - Market size and forecast 2025-2030 ($ thousand)
Data Table on Others - Market size and forecast 2025-2030 ($ thousand)
Chart on Others - Year-over-year growth 2025-2030 (%)
Data Table on Others - Year-over-year growth 2025-2030 (%)

8.7 Market opportunity by Application

Market opportunity by Application ($ thousand)
Data Table on Market opportunity by Application ($ thousand)

9. Market Segmentation by Source

9.1 Market segments

Chart on Source - Market share 2025-2030 (%)
Data Table on Source - Market share 2025-2030 (%)

9.2 Comparison by Source

Chart on Comparison by Source
Data Table on Comparison by Source

9.3 Soy lecithin - Market size and forecast 2025-2030

Chart on Soy lecithin - Market size and forecast 2025-2030 ($ thousand)
Data Table on Soy lecithin - Market size and forecast 2025-2030 ($ thousand)
Chart on Soy lecithin - Year-over-year growth 2025-2030 (%)
Data Table on Soy lecithin - Year-over-year growth 2025-2030 (%)

9.4 Egg lecithin - Market size and forecast 2025-2030

Chart on Egg lecithin - Market size and forecast 2025-2030 ($ thousand)
Data Table on Egg lecithin - Market size and forecast 2025-2030 ($ thousand)
Chart on Egg lecithin - Year-over-year growth 2025-2030 (%)
Data Table on Egg lecithin - Year-over-year growth 2025-2030 (%)

9.5 Sunflower lecithin - Market size and forecast 2025-2030

Chart on Sunflower lecithin - Market size and forecast 2025-2030 ($ thousand)
Data Table on Sunflower lecithin - Market size and forecast 2025-2030 ($ thousand)
Chart on Sunflower lecithin - Year-over-year growth 2025-2030 (%)
Data Table on Sunflower lecithin - Year-over-year growth 2025-2030 (%)

9.6 Others - Market size and forecast 2025-2030

Chart on Others - Market size and forecast 2025-2030 ($ thousand)
Data Table on Others - Market size and forecast 2025-2030 ($ thousand)
Chart on Others - Year-over-year growth 2025-2030 (%)
Data Table on Others - Year-over-year growth 2025-2030 (%)

9.7 Market opportunity by Source

Market opportunity by Source ($ thousand)
Data Table on Market opportunity by Source ($ thousand)

10. Market Segmentation by Form Factor

10.1 Market segments

Chart on Form Factor - Market share 2025-2030 (%)
Data Table on Form Factor - Market share 2025-2030 (%)

10.2 Comparison by Form Factor

Chart on Comparison by Form Factor
Data Table on Comparison by Form Factor

10.3 Liquid - Market size and forecast 2025-2030

Chart on Liquid - Market size and forecast 2025-2030 ($ thousand)
Data Table on Liquid - Market size and forecast 2025-2030 ($ thousand)
Chart on Liquid - Year-over-year growth 2025-2030 (%)
Data Table on Liquid - Year-over-year growth 2025-2030 (%)

10.4 Powder - Market size and forecast 2025-2030

Chart on Powder - Market size and forecast 2025-2030 ($ thousand)
Data Table on Powder - Market size and forecast 2025-2030 ($ thousand)
Chart on Powder - Year-over-year growth 2025-2030 (%)
Data Table on Powder - Year-over-year growth 2025-2030 (%)

10.5 Granular - Market size and forecast 2025-2030

Chart on Granular - Market size and forecast 2025-2030 ($ thousand)
Data Table on Granular - Market size and forecast 2025-2030 ($ thousand)
Chart on Granular - Year-over-year growth 2025-2030 (%)
Data Table on Granular - Year-over-year growth 2025-2030 (%)

10.6 Market opportunity by Form Factor

Market opportunity by Form Factor ($ thousand)
Data Table on Market opportunity by Form Factor ($ thousand)

11. Customer Landscape

11.1 Customer landscape overview

Analysis of price sensitivity, lifecycle, customer purchase basket, adoption rates, and purchase criteria

12. Geographic Landscape

12.1 Geographic segmentation

Chart on Market share by geography 2025-2030 (%)
Data Table on Market share by geography 2025-2030 (%)

12.2 Geographic comparison

Chart on Geographic comparison
Data Table on Geographic comparison

12.3 Europe - Market size and forecast 2025-2030

Chart on Europe - Market size and forecast 2025-2030 ($ thousand)
Data Table on Europe - Market size and forecast 2025-2030 ($ thousand)
Chart on Europe - Year-over-year growth 2025-2030 (%)
Data Table on Europe - Year-over-year growth 2025-2030 (%)
Chart on Regional Comparison - Europe
Data Table on Regional Comparison - Europe

12.3.1 Germany - Market size and forecast 2025-2030

Chart on Germany - Market size and forecast 2025-2030 ($ thousand)
Data Table on Germany - Market size and forecast 2025-2030 ($ thousand)
Chart on Germany - Year-over-year growth 2025-2030 (%)
Data Table on Germany - Year-over-year growth 2025-2030 (%)

12.3.2 UK - Market size and forecast 2025-2030

Chart on UK - Market size and forecast 2025-2030 ($ thousand)
Data Table on UK - Market size and forecast 2025-2030 ($ thousand)
Chart on UK - Year-over-year growth 2025-2030 (%)
Data Table on UK - Year-over-year growth 2025-2030 (%)

12.3.3 France - Market size and forecast 2025-2030

Chart on France - Market size and forecast 2025-2030 ($ thousand)
Data Table on France - Market size and forecast 2025-2030 ($ thousand)
Chart on France - Year-over-year growth 2025-2030 (%)
Data Table on France - Year-over-year growth 2025-2030 (%)

12.3.4 Italy - Market size and forecast 2025-2030

Chart on Italy - Market size and forecast 2025-2030 ($ thousand)
Data Table on Italy - Market size and forecast 2025-2030 ($ thousand)
Chart on Italy - Year-over-year growth 2025-2030 (%)
Data Table on Italy - Year-over-year growth 2025-2030 (%)

12.3.5 Spain - Market size and forecast 2025-2030

Chart on Spain - Market size and forecast 2025-2030 ($ thousand)
Data Table on Spain - Market size and forecast 2025-2030 ($ thousand)
Chart on Spain - Year-over-year growth 2025-2030 (%)
Data Table on Spain - Year-over-year growth 2025-2030 (%)

12.3.6 The Netherlands - Market size and forecast 2025-2030

Chart on The Netherlands - Market size and forecast 2025-2030 ($ thousand)
Data Table on The Netherlands - Market size and forecast 2025-2030 ($ thousand)
Chart on The Netherlands - Year-over-year growth 2025-2030 (%)
Data Table on The Netherlands - Year-over-year growth 2025-2030 (%)

12.4 North America - Market size and forecast 2025-2030

Chart on North America - Market size and forecast 2025-2030 ($ thousand)
Data Table on North America - Market size and forecast 2025-2030 ($ thousand)
Chart on North America - Year-over-year growth 2025-2030 (%)
Data Table on North America - Year-over-year growth 2025-2030 (%)
Chart on Regional Comparison - North America
Data Table on Regional Comparison - North America

12.4.1 US - Market size and forecast 2025-2030

Chart on US - Market size and forecast 2025-2030 ($ thousand)
Data Table on US - Market size and forecast 2025-2030 ($ thousand)
Chart on US - Year-over-year growth 2025-2030 (%)
Data Table on US - Year-over-year growth 2025-2030 (%)

12.4.2 Canada - Market size and forecast 2025-2030

Chart on Canada - Market size and forecast 2025-2030 ($ thousand)
Data Table on Canada - Market size and forecast 2025-2030 ($ thousand)
Chart on Canada - Year-over-year growth 2025-2030 (%)
Data Table on Canada - Year-over-year growth 2025-2030 (%)

12.4.3 Mexico - Market size and forecast 2025-2030

Chart on Mexico - Market size and forecast 2025-2030 ($ thousand)
Data Table on Mexico - Market size and forecast 2025-2030 ($ thousand)
Chart on Mexico - Year-over-year growth 2025-2030 (%)
Data Table on Mexico - Year-over-year growth 2025-2030 (%)

12.5 APAC - Market size and forecast 2025-2030

Chart on APAC - Market size and forecast 2025-2030 ($ thousand)
Data Table on APAC - Market size and forecast 2025-2030 ($ thousand)
Chart on APAC - Year-over-year growth 2025-2030 (%)
Data Table on APAC - Year-over-year growth 2025-2030 (%)
Chart on Regional Comparison - APAC
Data Table on Regional Comparison - APAC

12.5.1 China - Market size and forecast 2025-2030

Chart on China - Market size and forecast 2025-2030 ($ thousand)
Data Table on China - Market size and forecast 2025-2030 ($ thousand)
Chart on China - Year-over-year growth 2025-2030 (%)
Data Table on China - Year-over-year growth 2025-2030 (%)

12.5.2 Japan - Market size and forecast 2025-2030

Chart on Japan - Market size and forecast 2025-2030 ($ thousand)
Data Table on Japan - Market size and forecast 2025-2030 ($ thousand)
Chart on Japan - Year-over-year growth 2025-2030 (%)
Data Table on Japan - Year-over-year growth 2025-2030 (%)

12.5.3 India - Market size and forecast 2025-2030

Chart on India - Market size and forecast 2025-2030 ($ thousand)
Data Table on India - Market size and forecast 2025-2030 ($ thousand)
Chart on India - Year-over-year growth 2025-2030 (%)
Data Table on India - Year-over-year growth 2025-2030 (%)

12.5.4 South Korea - Market size and forecast 2025-2030

Chart on South Korea - Market size and forecast 2025-2030 ($ thousand)
Data Table on South Korea - Market size and forecast 2025-2030 ($ thousand)
Chart on South Korea - Year-over-year growth 2025-2030 (%)
Data Table on South Korea - Year-over-year growth 2025-2030 (%)

12.5.5 Australia - Market size and forecast 2025-2030

Chart on Australia - Market size and forecast 2025-2030 ($ thousand)
Data Table on Australia - Market size and forecast 2025-2030 ($ thousand)
Chart on Australia - Year-over-year growth 2025-2030 (%)
Data Table on Australia - Year-over-year growth 2025-2030 (%)

12.5.6 Indonesia - Market size and forecast 2025-2030

Chart on Indonesia - Market size and forecast 2025-2030 ($ thousand)
Data Table on Indonesia - Market size and forecast 2025-2030 ($ thousand)
Chart on Indonesia - Year-over-year growth 2025-2030 (%)
Data Table on Indonesia - Year-over-year growth 2025-2030 (%)

12.6 South America - Market size and forecast 2025-2030

Chart on South America - Market size and forecast 2025-2030 ($ thousand)
Data Table on South America - Market size and forecast 2025-2030 ($ thousand)
Chart on South America - Year-over-year growth 2025-2030 (%)
Data Table on South America - Year-over-year growth 2025-2030 (%)
Chart on Regional Comparison - South America
Data Table on Regional Comparison - South America

12.6.1 Brazil - Market size and forecast 2025-2030

Chart on Brazil - Market size and forecast 2025-2030 ($ thousand)
Data Table on Brazil - Market size and forecast 2025-2030 ($ thousand)
Chart on Brazil - Year-over-year growth 2025-2030 (%)
Data Table on Brazil - Year-over-year growth 2025-2030 (%)

12.6.2 Argentina - Market size and forecast 2025-2030

Chart on Argentina - Market size and forecast 2025-2030 ($ thousand)
Data Table on Argentina - Market size and forecast 2025-2030 ($ thousand)
Chart on Argentina - Year-over-year growth 2025-2030 (%)
Data Table on Argentina - Year-over-year growth 2025-2030 (%)

12.6.3 Chile - Market size and forecast 2025-2030

Chart on Chile - Market size and forecast 2025-2030 ($ thousand)
Data Table on Chile - Market size and forecast 2025-2030 ($ thousand)
Chart on Chile - Year-over-year growth 2025-2030 (%)
Data Table on Chile - Year-over-year growth 2025-2030 (%)

12.7 Middle East and Africa - Market size and forecast 2025-2030

Chart on Middle East and Africa - Market size and forecast 2025-2030 ($ thousand)
Data Table on Middle East and Africa - Market size and forecast 2025-2030 ($ thousand)
Chart on Middle East and Africa - Year-over-year growth 2025-2030 (%)
Data Table on Middle East and Africa - Year-over-year growth 2025-2030 (%)
Chart on Regional Comparison - Middle East and Africa
Data Table on Regional Comparison - Middle East and Africa

12.7.1 Saudi Arabia - Market size and forecast 2025-2030

Chart on Saudi Arabia - Market size and forecast 2025-2030 ($ thousand)
Data Table on Saudi Arabia - Market size and forecast 2025-2030 ($ thousand)
Chart on Saudi Arabia - Year-over-year growth 2025-2030 (%)
Data Table on Saudi Arabia - Year-over-year growth 2025-2030 (%)

12.7.2 UAE - Market size and forecast 2025-2030

Chart on UAE - Market size and forecast 2025-2030 ($ thousand)
Data Table on UAE - Market size and forecast 2025-2030 ($ thousand)
Chart on UAE - Year-over-year growth 2025-2030 (%)
Data Table on UAE - Year-over-year growth 2025-2030 (%)

12.7.3 South Africa - Market size and forecast 2025-2030

Chart on South Africa - Market size and forecast 2025-2030 ($ thousand)
Data Table on South Africa - Market size and forecast 2025-2030 ($ thousand)
Chart on South Africa - Year-over-year growth 2025-2030 (%)
Data Table on South Africa - Year-over-year growth 2025-2030 (%)

12.7.4 Turkey - Market size and forecast 2025-2030

Chart on Turkey - Market size and forecast 2025-2030 ($ thousand)
Data Table on Turkey - Market size and forecast 2025-2030 ($ thousand)
Chart on Turkey - Year-over-year growth 2025-2030 (%)
Data Table on Turkey - Year-over-year growth 2025-2030 (%)

12.7.5 Israel - Market size and forecast 2025-2030

Chart on Israel - Market size and forecast 2025-2030 ($ thousand)
Data Table on Israel - Market size and forecast 2025-2030 ($ thousand)
Chart on Israel - Year-over-year growth 2025-2030 (%)
Data Table on Israel - Year-over-year growth 2025-2030 (%)

12.8 Market opportunity by geography

Market opportunity by geography ($ thousand)
Data Tables on Market opportunity by geography ($ thousand)

13. Drivers, Challenges, and Opportunity

13.1 Market drivers

Growing demand for clean label food ingredients
Increasing utilization in animal nutrition formulations
Expanding consumption of convenience and processed foods

13.2 Market challenges

Raw material price volatility from soybean and sunflower supply fluctuations
Allergen and GMO related sourcing constraints across food applications
Regulatory compliance complexity across multi regional ingredient approvals

13.3 Impact of drivers and challenges

Impact of drivers and challenges in 2025 and 2030

13.4 Market opportunities

Increasing shift toward sunflower derived lecithin production
Advancing adoption of specialty and customized lecithin formulations
Growing integration of traceability focused sourcing and certification practices

14. Competitive Landscape

14.1 Overview

14.2

Overview on criticality of inputs and factors of differentiation

14.3 Landscape disruption

Overview on factors of disruption

14.4 Industry risks

Impact of key risks on business

15. Competitive Analysis

15.1 Companies profiled

Companies covered

15.2 Company ranking index

15.3 Market positioning of companies

Matrix on companies position and classification

15.4 AAK AB

AAK AB - Overview
AAK AB - Business segments
AAK AB - Key offerings
AAK AB - Segment focus
SWOT

15.5 Amitex Agro Product Pvt. Ltd.

Amitex Agro Product Pvt. Ltd. - Overview
Amitex Agro Product Pvt. Ltd. - Product / Service
Amitex Agro Product Pvt. Ltd. - Key offerings
SWOT

15.6 Archer Daniels Midland Co.

Archer Daniels Midland Co. - Overview
Archer Daniels Midland Co. - Business segments
Archer Daniels Midland Co. - Key news
Archer Daniels Midland Co. - Key offerings
Archer Daniels Midland Co. - Segment focus
SWOT

15.7 Bunge Global SA

Bunge Global SA - Overview
Bunge Global SA - Business segments
Bunge Global SA - Key offerings
Bunge Global SA - Segment focus
SWOT

15.8 Cargill Inc.

Cargill Inc. - Overview
Cargill Inc. - Product / Service
Cargill Inc. - Key news
Cargill Inc. - Key offerings
SWOT

15.9 Lipoid GmbH

Lipoid GmbH - Overview
Lipoid GmbH - Product / Service
Lipoid GmbH - Key offerings
SWOT

15.10 Matrix Life Science

Matrix Life Science - Overview
Matrix Life Science - Product / Service
Matrix Life Science - Key offerings
SWOT

15.11 Novastell

Novastell - Overview
Novastell - Product / Service
Novastell - Key offerings
SWOT

15.12 Patanjali Foods Ltd.

Patanjali Foods Ltd. - Overview
Patanjali Foods Ltd. - Business segments
Patanjali Foods Ltd. - Key offerings
Patanjali Foods Ltd. - Segment focus
SWOT

15.13 Saipol

Saipol - Overview
Saipol - Product / Service
Saipol - Key offerings
SWOT

15.14 Sonic Biochem Extraction

Sonic Biochem Extraction - Overview
Sonic Biochem Extraction - Product / Service
Sonic Biochem Extraction - Key offerings
SWOT

15.15 Sternchemie GmbH and Co. KG

Sternchemie GmbH and Co. KG - Overview
Sternchemie GmbH and Co. KG - Product / Service
Sternchemie GmbH and Co. KG - Key offerings
SWOT

15.16 Sun Nutrafoods Pvt. Ltd.

Sun Nutrafoods Pvt. Ltd. - Overview
Sun Nutrafoods Pvt. Ltd. - Product / Service
Sun Nutrafoods Pvt. Ltd. - Key offerings
SWOT

15.17 VAV Life Sciences Pvt. Ltd.

VAV Life Sciences Pvt. Ltd. - Overview
VAV Life Sciences Pvt. Ltd. - Product / Service
VAV Life Sciences Pvt. Ltd. - Key offerings
SWOT

15.18 Wilmar International Ltd.

Wilmar International Ltd. - Overview
Wilmar International Ltd. - Business segments
Wilmar International Ltd. - Key offerings
Wilmar International Ltd. - Segment focus
SWOT

16. Appendix

16.1 Scope of the report

Market definition
Objectives
Notes and caveats

16.2 Inclusions and exclusions checklist

Inclusions checklist
Exclusions checklist

16.3 Currency conversion rates for US$

16.4 Research methodology

16.5 Data procurement

Information sources

16.6 Data validation

16.7 Validation techniques employed for market sizing

16.8 Data synthesis

16.9 360 degree market analysis

16.10 List of abbreviations

Research Methodology

Technavio presents a detailed picture of the market by way of study, synthesis, and summation of data from multiple sources. The analysts have presented the various facets of the market with a particular focus on identifying the key industry influencers. The data thus presented is comprehensive, reliable, and the result of extensive research, both primary and secondary.

INFORMATION SOURCES

Primary sources

  • Manufacturers and suppliers
  • Channel partners
  • Industry experts
  • Strategic decision makers

Secondary sources

  • Industry journals and periodicals
  • Government data
  • Financial reports of key industry players
  • Historical data
  • Press releases

DATA ANALYSIS

Data Synthesis

  • Collation of data
  • Estimation of key figures
  • Analysis of derived insights

Data Validation

  • Triangulation with data models
  • Reference against proprietary databases
  • Corroboration with industry experts

REPORT WRITING

Qualitative

  • Market drivers
  • Market challenges
  • Market trends
  • Five forces analysis

Quantitative

  • Market size and forecast
  • Market segmentation
  • Geographical insights
  • Competitive landscape

Interested in this report?

Get your sample now to see our research methodology and insights!

Download Now

Frequently Asked Questions

Lecithin market growth will increase by USD 263168.9 thousand thousand during 2026-2030.

The Lecithin market is expected to grow at a CAGR of 6.8% during 2026-2030.

Lecithin market is segmented by Application (Animal feed, Food and beverages, Pharmaceuticals, Others) Source (Soy lecithin, Egg lecithin, Sunflower lecithin, Others) Form factor (Liquid, Powder, Granular)

AAK AB, Amitex Agro Product Pvt. Ltd., Archer Daniels Midland Co., Bunge Global SA, Cargill Inc., Clarkson Specialty Lecithins, Fismer Lecithin GmbH, Haneil Soyatech Pvt. Ltd., Hi Soya Lecithin, LASENOR EMUL SL, Lecilite Ingredients Pvt. Ltd., Lecithin India, Lipoid GmbH, Matrix Life Science, Novastell, Patanjali Foods Ltd., Saipol, Sonic Biochem Extraction, Sternchemie GmbH and Co. KG, Sun Nutrafoods Pvt. Ltd., VAV Life Sciences Pvt. Ltd., Wilmar International Ltd. are a few of the key vendors in the Lecithin market.

Europe will register the highest growth rate of 35.2% among the other regions. Therefore, the Lecithin market in Europe is expected to garner significant business opportunities for the vendors during the forecast period.

Germany, UK, France, Italy, Spain, The Netherlands, US, Canada, Mexico, China, Japan, India, South Korea, Australia, Indonesia, Brazil, Argentina, Chile, Saudi Arabia, UAE, South Africa, Turkey, Israel

  • Growing demand for clean label food ingredients is the driving factor this market.

The Lecithin market vendors should focus on grabbing business opportunities from the Application segment as it accounted for the largest market share in the base year.
RIA - Research AI Assistant
Ask RIA
