Liquid Cooling For AI Data Centers Market Analysis, Size, and Forecast 2026-2030: North America (US, Canada, and Mexico), APAC (China, Japan, and India), Europe (Germany, UK, and France), South America (Brazil and Argentina), Middle East and Africa (Saudi Arabia, UAE, and South Africa), and Rest of World (ROW)

Liquid Cooling For AI Data Centers Market Analysis, Size, and Forecast 2026-2030:
North America (US, Canada, and Mexico), APAC (China, Japan, and India), Europe (Germany, UK, and France), South America (Brazil and Argentina), Middle East and Africa (Saudi Arabia, UAE, and South Africa), and Rest of World (ROW)

Published: Apr 2026 293 Pages SKU: IRTNTR80708

Market Overview at a Glance

$2.48 B
Market Opportunity
31.7%
CAGR 2025 - 2030
34.6%
North America Growth
$293.84 Mn
Cold plate cooling segment 2024

Liquid Cooling For AI Data Centers Market Size 2026-2030

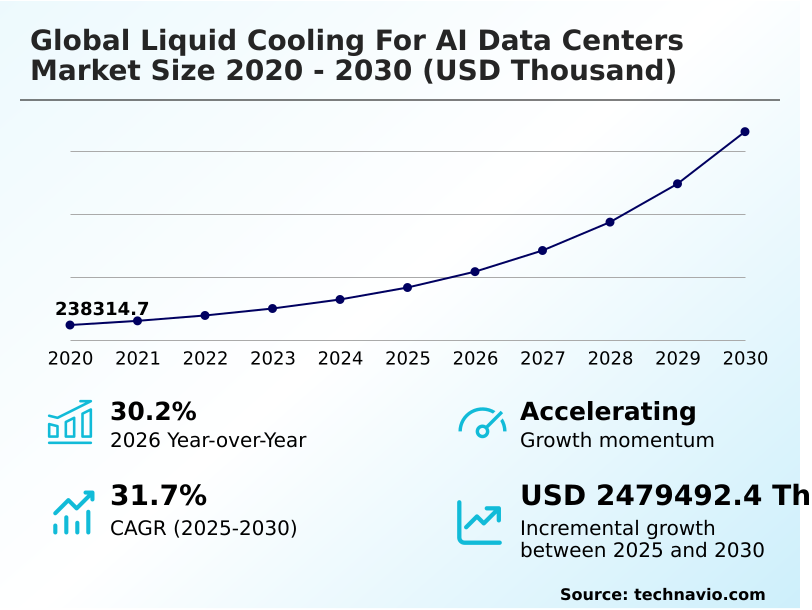
The liquid cooling for ai data centers market size is valued to increase by USD 2.48 billion, at a CAGR of 31.7% from 2025 to 2030. Elevated thermal design power and rack density in AI hardware will drive the liquid cooling for ai data centers market.

Major Market Trends & Insights

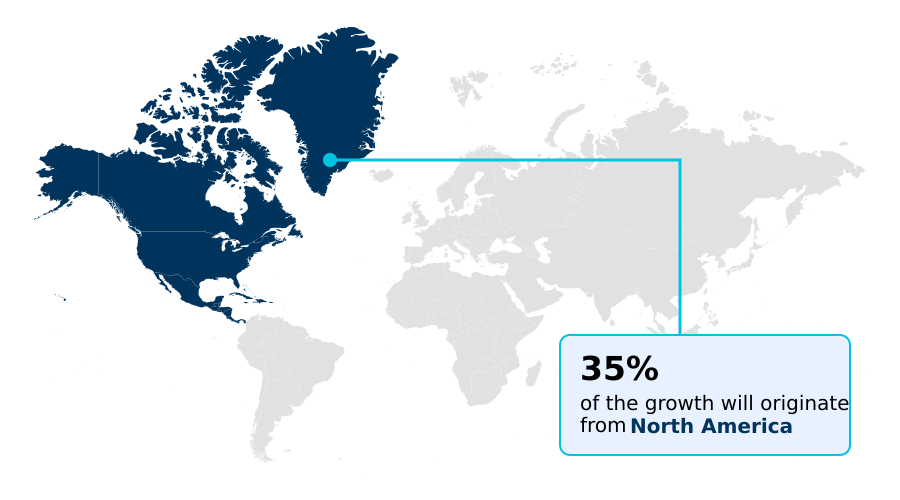
  • North America dominated the market and accounted for a 34.6% growth during the forecast period.
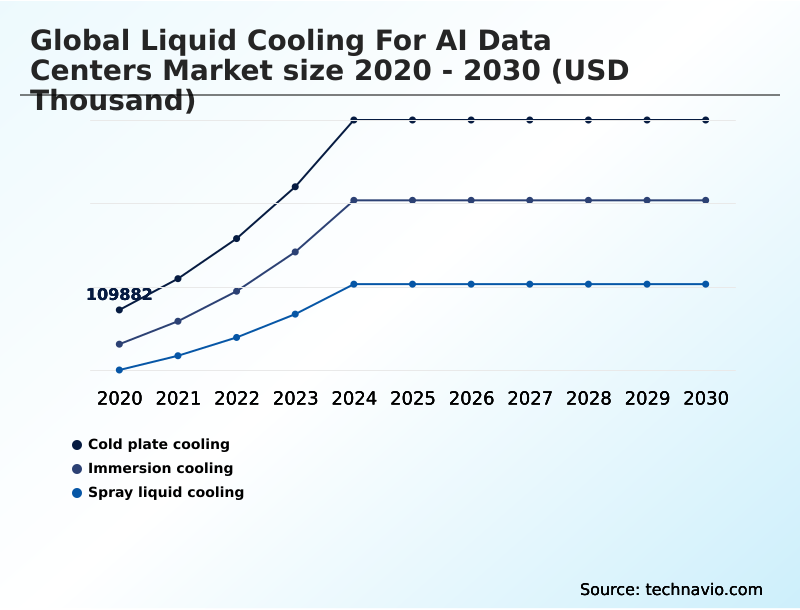
  • By Type - Cold plate cooling segment was valued at USD 293.84 million in 2024
  • By End-user - Hyperscale data centers segment accounted for the largest market revenue share in 2024

Market Size & Forecast

  • Market Opportunities:
  • Market Future Opportunities: USD 2.48 billion
  • CAGR from 2025 to 2030 : 31.7%

Market Summary

  • The liquid cooling for AI data centers market is fundamentally reshaped by the escalating computational demands of modern workloads. The transition away from traditional air cooling is no longer optional for facilities deploying high-density racks for generative AI infrastructure. Key innovations in direct-to-chip cooling and single-phase cooling are becoming standard to mitigate thermal throttling and ensure hardware reliability.
  • For instance, a financial services firm deploying an AI-powered risk modeling platform must prevent processor overheating to maintain data integrity and speed, making advanced thermal management systems a critical investment. This necessity drives the market toward solutions that not only manage extreme heat flux but also improve power usage effectiveness (PUE).
  • The industry is also seeing a move towards modular cooling and retrofitting existing brownfield data center sites, addressing the high capital costs associated with full greenfield deployment. Operational risks, such as managing coolant chemistry and ensuring leak detection systems are flawless, remain a significant consideration for facility management.

What will be the Size of the Liquid Cooling For AI Data Centers Market during the forecast period?

Get Key Insights on Market Forecast (PDF) Request Free Sample

How is the Liquid Cooling For AI Data Centers Market Segmented?

The liquid cooling for ai data centers industry research report provides comprehensive data (region-wise segment analysis), with forecasts and estimates in "USD thousand" for the period 2026-2030, as well as historical data from 2020-2024 for the following segments.

  • Type
    • Cold plate cooling
    • Immersion cooling
    • Spray liquid cooling
  • End-user
    • Hyperscale data centers
    • Colocation data centers
    • Others
  • Component
    • Solutions
    • Services
  • Geography
    • North America
      • US
      • Canada
      • Mexico
    • APAC
      • China
      • Japan
      • India
    • Europe
      • Germany
      • UK
      • France
    • South America
      • Brazil
      • Argentina
    • Middle East and Africa
      • Saudi Arabia
      • UAE
      • South Africa
    • Rest of World (ROW)

By Type Insights

The cold plate cooling segment is estimated to witness significant growth during the forecast period.

Cold plate cooling, a form of direct-to-chip cooling, is a pivotal segment in the liquid cooling for AI data centers market.

This method involves mounting a plate with microchannels directly onto high-power components, circulating a specialized non-conductive fluid to facilitate superior heat transfer.

Its adoption allows for a hybrid cooling environment, integrating with existing data center infrastructure management (DCIM) and reducing reliance on computer room air handler units, which can account for nearly 40% of power consumption.

The design is crucial for managing thermal throttling in AI accelerators and is a key component of effective thermal management systems.

This approach enhances hardware reliability for mission-critical hardware, offering a pragmatic balance between performance and the total cost of ownership.

Request Free Sample

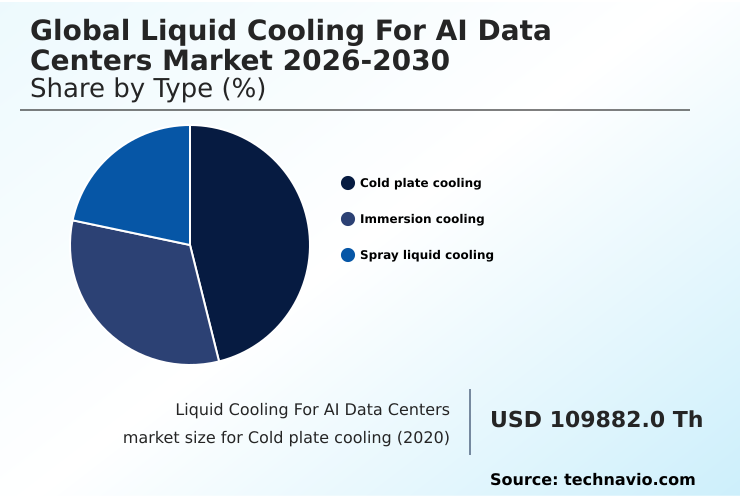
The Cold plate cooling segment was valued at USD 293.84 million in 2024 and showed a gradual increase during the forecast period.

Request Free Sample

Regional Analysis

North America is estimated to contribute 34.6% to the growth of the global market during the forecast period.Technavio’s analysts have elaborately explained the regional trends and drivers that shape the market during the forecast period.

See How Liquid Cooling For AI Data Centers Market Demand is Rising in North America Request Free Sample

The geographic landscape is defined by distinct regional drivers and adoption patterns. North America, contributing over 34% of the market’s incremental growth, leads due to its high concentration of hyperscale data centers and AI accelerators, necessitating advanced thermal management systems.

In APAC, which is the fastest-growing region, the push is driven by government-led digital transformation and the need for high-density computing in urban centers, leading to increased adoption of single-phase cooling and immersion cooling.

Europe's market is heavily influenced by stringent regulations on energy conservation and carbon emissions reduction, making power usage effectiveness (PUE) a critical metric. This has accelerated the deployment of solutions that support waste heat recovery.

South America and the Middle East are emerging markets, with initial deployments in colocation facilities focusing on improving data center efficiency to handle compute-intensive workloads in challenging climates.

Market Dynamics

Our researchers analyzed the data with 2025 as the base year, along with the key drivers, trends, and challenges. A holistic analysis of drivers will help companies refine their marketing strategies to gain a competitive advantage.

  • As organizations increasingly invest in high-performance computing, understanding the nuances of advanced thermal management becomes critical. The debate over immersion cooling vs direct-to-chip cooling often centers on application-specific needs, with the former offering comprehensive heat dissipation for the highest computational density, while the latter provides a targeted, more easily retrofitted solution.
  • The primary benefits of direct-to-chip cooling include its compatibility with existing server architecture and its efficiency in managing heat flux at the source. For new builds, strategies for data center liquid cooling design are evolving to incorporate modularity and waste heat recovery from the outset.
  • A major driver is reducing data center PUE with liquid cooling, which can lower energy consumption for cooling by more than half compared to legacy air systems. This is particularly crucial for AI training clusters, where the sustained, high-power draw of GPU clusters makes thermal management a primary operational challenge.
  • Consequently, the focus on liquid cooling for AI training clusters is intense. For existing facilities, the process of retrofitting data centers with liquid cooling presents a viable path to upgrade capabilities without a complete rebuild, allowing operators to support liquid cooling for high-density racks and manage escalating thermal loads effectively.

What are the key market drivers leading to the rise in the adoption of Liquid Cooling For AI Data Centers Industry?

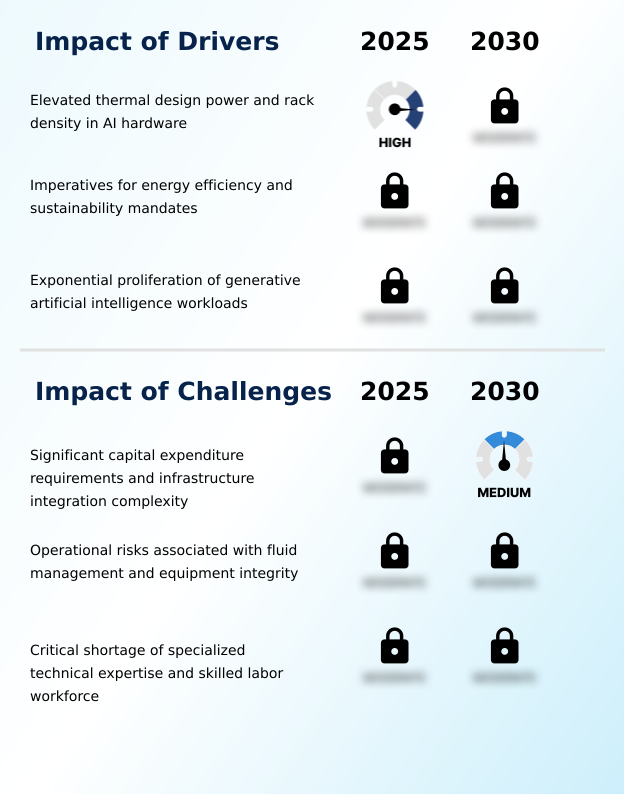
  • The market is primarily driven by the elevated thermal design power and increasing rack density of specialized AI hardware.

  • The primary market driver is the exponential growth in generative AI and high-performance computing (HPC) workloads, which has led to a rapid increase in the thermal design power of AI accelerators.
  • Modern GPUs now generate heat loads that make traditional air cooling ineffective, necessitating a shift to liquid-based thermal management systems. This transition is not a preference but a technical requirement for facilities hosting high-density computing clusters.
  • Adopting liquid cooling allows data centers to support more compute power in a smaller footprint, with some operators seeing a 50% increase in computational density per rack.
  • Furthermore, imperatives for energy conservation and sustainability are compelling operators to adopt these more efficient systems, which can reduce a data center's power usage effectiveness (PUE) ratio by up to 40% compared to legacy air-cooled facilities.

What are the market trends shaping the Liquid Cooling For AI Data Centers Industry?

  • A key trend is the industry's shift toward standardized, modular cooling architectures. This includes an emphasis on retrofitting strategies for existing data centers.

  • Key market trends are centered on the strategic dominance of single-phase cooling and innovations in direct-to-chip cooling. The industry is moving towards modular cooling architectures, enabling scalable greenfield deployment and simplifying the retrofitting of a brownfield data center.
  • These prefabricated systems, which integrate components like a coolant distribution unit, reduce onsite engineering complexity and accelerate deployment timelines for generative AI infrastructure. This standardization allows for greater interoperability between high-performance hardware and thermal management systems. For instance, facilities are achieving a 15% faster deployment time with modular units.
  • Additionally, the development of advanced cold plate designs, often using additive manufacturing, is enhancing heat transfer efficiency by over 25%, allowing single-phase systems to manage thermal loads previously thought to require more complex two-phase cooling solutions.

What challenges does the Liquid Cooling For AI Data Centers Industry face during its growth?

  • Significant capital expenditure requirements and the complexity of infrastructure integration present a key challenge to market growth.

  • A significant market challenge is the high upfront capital expenditure and the complexity of integrating liquid cooling into existing data center infrastructure. Retrofitting a facility often involves significant downtime and modifications to the central plant, disrupting critical services. These high costs create a barrier for smaller operators, slowing broader adoption.
  • The specialized nature of components like precision plumbing and coolant distribution units also leads to extended procurement lead times, delaying deployment of essential AI accelerators. Furthermore, there is a critical shortage of skilled labor capable of designing and maintaining these complex fluid dynamics systems.
  • This talent gap can increase operational expenditure by up to 20% due to the need for premium compensation or reliance on external consultants for routine facility management tasks.

Exclusive Technavio Analysis on Customer Landscape

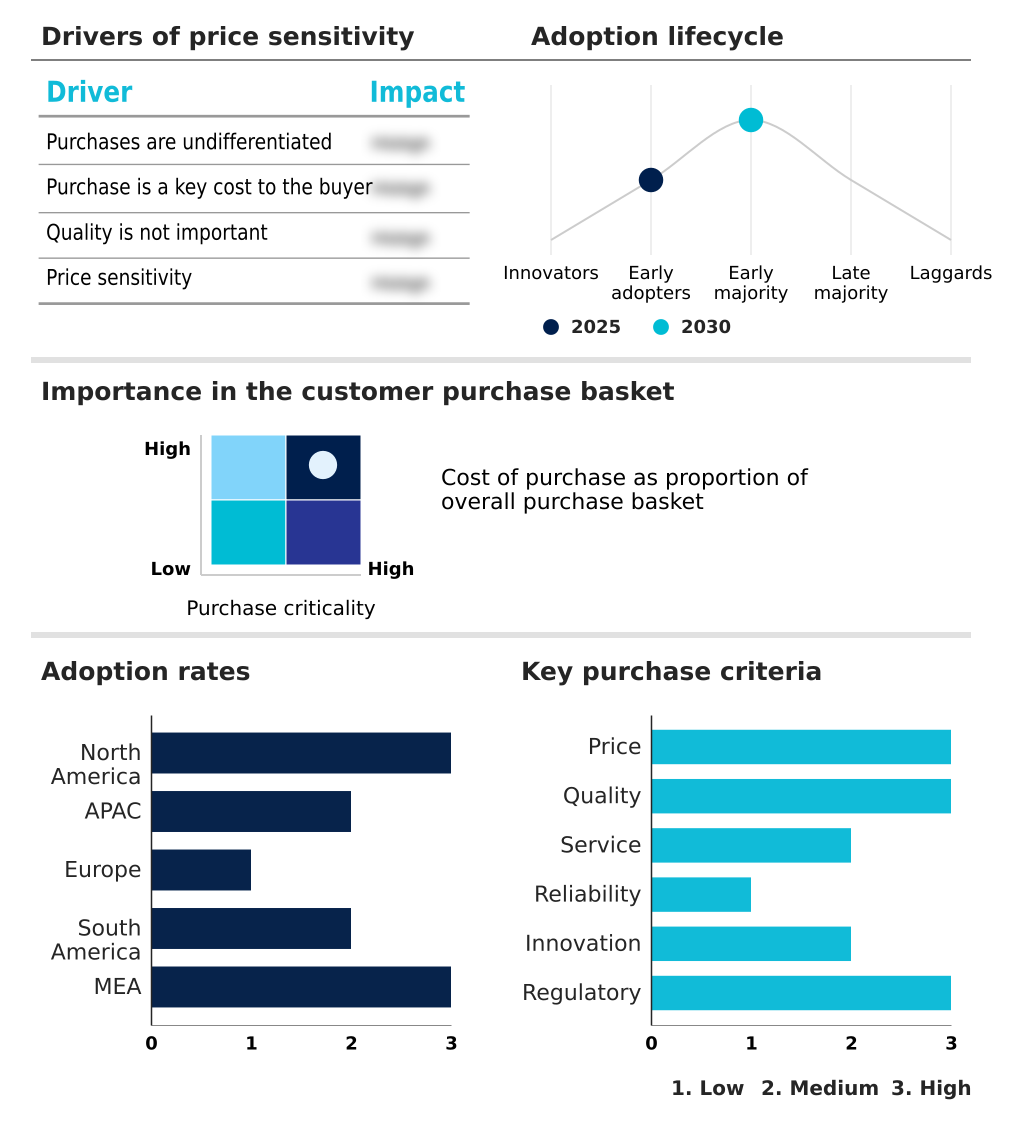
The liquid cooling for ai data centers market forecasting report includes the adoption lifecycle of the market, covering from the innovator’s stage to the laggard’s stage. It focuses on adoption rates in different regions based on penetration. Furthermore, the liquid cooling for ai data centers market report also includes key purchase criteria and drivers of price sensitivity to help companies evaluate and develop their market growth analysis strategies.

Customer Landscape of Liquid Cooling For AI Data Centers Industry

Competitive Landscape

Companies are implementing various strategies, such as strategic alliances, liquid cooling for ai data centers market forecast, partnerships, mergers and acquisitions, geographical expansion, and product/service launches, to enhance their presence in the industry.

Aecorsis BV - Offerings include advanced thermal management systems, such as direct-to-chip and immersion cooling, which are vital for high-density AI hardware and optimizing data center efficiency.

The industry research and growth report includes detailed analyses of the competitive landscape of the market and information about key companies, including:

  • Aecorsis BV
  • Asetek Danmark AS
  • Boyd Corp.
  • Chilldyne
  • Coolit Systems
  • Danfoss AS
  • Dell Technologies Inc.
  • Delta Electronics Inc.
  • Fujitsu Ltd
  • Hewlett Packard Enterprise Co.
  • Iceotope Technologies Ltd.
  • Lenovo Group Ltd.
  • LiquidStack BV
  • Motivair Corp.
  • nVent Electric Plc
  • Rittal GmbH and Co. KG
  • Schneider Electric SE
  • STULZ GmbH
  • Super Micro Computer Inc.
  • Vertiv Holdings Co.

Qualitative and quantitative analysis of companies has been conducted to help clients understand the wider business environment as well as the strengths and weaknesses of key industry players. Data is qualitatively analyzed to categorize companies as pure play, category-focused, industry-focused, and diversified; it is quantitatively analyzed to categorize companies as dominant, leading, strong, tentative, and weak.

Recent Development and News in Liquid cooling for ai data centers market

  • In February 2025, Microsoft announced a landmark update to its data center design philosophy, mandating direct-to-chip liquid cooling for all new server deployments intended for its Azure AI and high-performance computing cloud services.
  • In March 2025, Hewlett Packard Enterprise announced an expanded strategic alliance with Coolit Systems to co-engineer a new generation of servers for the HPE Cray portfolio, featuring pre-installed direct-to-chip liquid cooling.
  • In April 2025, Equinix announced the launch of its AI Powerhouse initiative in its Ashburn, Virginia campus, involving a strategic partnership with Vertiv to build new data halls engineered for immersion cooling.
  • In May 2025, G42, an Abu Dhabi-based AI and cloud computing company, announced a partnership with LiquidStack to build a new AI supercomputing center in Masdar City using two-phase immersion cooling.

Dive into Technavio’s robust research methodology, blending expert interviews, extensive data synthesis, and validated models for unparalleled Liquid Cooling For AI Data Centers Market insights. See full methodology.

Market Scope
Page number 293
Base year 2025
Historic period 2020-2024
Forecast period 2026-2030
Growth momentum & CAGR Accelerate at a CAGR of 31.7%
Market growth 2026-2030 USD 2479492.4 thousand
Market structure Fragmented
YoY growth 2025-2026(%) 30.2%
Key countries US, Canada, Mexico, China, Japan, India, South Korea, Australia, Indonesia, Germany, UK, France, Italy, Spain, The Netherlands, Brazil, Argentina, Chile, Saudi Arabia, UAE, South Africa, Israel and Turkey
Competitive landscape Leading Companies, Market Positioning of Companies, Competitive Strategies, and Industry Risks

Request Free Sample

Research Analyst Overview

  • The liquid cooling for AI data centers market is driven by the physical limitations of air in managing the thermal design power of modern processors. Innovations center on direct-to-chip cooling and immersion cooling, which offer superior heat transfer. Key components like a coolant distribution unit, cold plate, and heat exchanger are essential for system efficacy.
  • The industry focuses on improving power usage effectiveness (PUE) and managing the high heat flux from server rack power density. For boardroom decisions, the choice of a thermal management system directly impacts operational budgets, with advanced systems reducing energy use by over 30%. Technologies such as single-phase cooling and two-phase cooling are deployed to prevent thermal throttling and ensure reliability.
  • Operators must also consider coolant chemistry, refrigerant distribution, and the use of quick-disconnect fittings to mitigate risks. Modular cooling designs and rear-door cooling units are gaining traction for their flexibility in both new and existing facilities, addressing the need for scalable solutions that support evolving hardware requirements.

What are the Key Data Covered in this Liquid Cooling For AI Data Centers Market Research and Growth Report?

  • What is the expected growth of the Liquid Cooling For AI Data Centers Market between 2026 and 2030?

    • USD 2.48 billion, at a CAGR of 31.7%

  • What segmentation does the market report cover?

    • The report is segmented by Type (Cold plate cooling, Immersion cooling, and Spray liquid cooling), End-user (Hyperscale data centers, Colocation data centers, and Others), Component (Solutions, and Services) and Geography (North America, APAC, Europe, South America, Middle East and Africa)

  • Which regions are analyzed in the report?

    • North America, APAC, Europe, South America and Middle East and Africa

  • What are the key growth drivers and market challenges?

    • Elevated thermal design power and rack density in AI hardware, Significant capital expenditure requirements and infrastructure integration complexity

  • Who are the major players in the Liquid Cooling For AI Data Centers Market?

    • Aecorsis BV, Asetek Danmark AS, Boyd Corp., Chilldyne, Coolit Systems, Danfoss AS, Dell Technologies Inc., Delta Electronics Inc., Fujitsu Ltd, Hewlett Packard Enterprise Co., Iceotope Technologies Ltd., Lenovo Group Ltd., LiquidStack BV, Motivair Corp., nVent Electric Plc, Rittal GmbH and Co. KG, Schneider Electric SE, STULZ GmbH, Super Micro Computer Inc. and Vertiv Holdings Co.

Market Research Insights

  • Market dynamics are increasingly shaped by the need to support high-density computing and generative AI infrastructure. The total cost of ownership is a primary consideration, with operators seeking solutions that improve data center efficiency and reduce operational expenditure.
  • The adoption of liquid cooling can lower cooling energy costs by more than 30% compared to traditional methods, directly impacting a facility's power usage effectiveness (PUE). Furthermore, ensuring hardware reliability and uptime for mission-critical hardware is non-negotiable. Effective thermal management reduces component failure rates by over 20%, a critical factor for colocation facilities bound by strict service level agreements.
  • The shift from capital-intensive greenfield deployment to retrofitting a brownfield data center reflects a strategic pivot to manage investment while still upgrading thermal headroom for compute-intensive workloads.

We can help! Our analysts can customize this liquid cooling for ai data centers market research report to meet your requirements.

Get in touch

1. Executive Summary

1.1 Market overview

Executive Summary - Chart on Market Overview
Executive Summary - Data Table on Market Overview
Executive Summary - Chart on Global Market Characteristics
Executive Summary - Chart on Market by Geography
Executive Summary - Chart on Market Segmentation by Type
Executive Summary - Chart on Market Segmentation by End-user
Executive Summary - Chart on Market Segmentation by Component
Executive Summary - Chart on Incremental Growth
Executive Summary - Data Table on Incremental Growth
Executive Summary - Chart on Company Market Positioning

2. Technavio Analysis

2.1 Analysis of price sensitivity, lifecycle, customer purchase basket, adoption rates, and purchase criteria

2.2 Criticality of inputs and Factors of differentiation

Chart on Overview on criticality of inputs and factors of differentiation

2.3 Factors of disruption

Chart on Overview on factors of disruption

2.4 Impact of drivers and challenges

Chart on Impact of drivers and challenges in 2025 and 2030

3. Market Landscape

3.1 Market ecosystem

Chart on Parent Market
Data Table on - Parent Market

3.2 Market characteristics

Chart on Market characteristics analysis

3.3 Value chain analysis

Chart on Value chain analysis

4. Market Sizing

4.1 Market definition

Data Table on Offerings of companies included in the market definition

4.2 Market segment analysis

Market segments

4.3 Market size 2025

4.4 Market outlook: Forecast for 2025-2030

Chart on Global - Market size and forecast 2025-2030 ($ thousand)
Data Table on Global - Market size and forecast 2025-2030 ($ thousand)
Chart on Global Market: Year-over-year growth 2025-2030 (%)
Data Table on Global Market: Year-over-year growth 2025-2030 (%)

5. Historic Market Size

5.1 Global Liquid Cooling For AI Data Centers Market 2020 - 2024

Historic Market Size - Data Table on Global Liquid Cooling For AI Data Centers Market 2020 - 2024 ($ thousand)

5.2 Type segment analysis 2020 - 2024

Historic Market Size - Type Segment 2020 - 2024 ($ thousand)

5.3 End-user segment analysis 2020 - 2024

Historic Market Size - End-user Segment 2020 - 2024 ($ thousand)

5.4 Component segment analysis 2020 - 2024

Historic Market Size - Component Segment 2020 - 2024 ($ thousand)

5.5 Geography segment analysis 2020 - 2024

Historic Market Size - Geography Segment 2020 - 2024 ($ thousand)

5.6 Country segment analysis 2020 - 2024

Historic Market Size - Country Segment 2020 - 2024 ($ thousand)

6. Qualitative Analysis

6.1 Impact of geopolitical conflicts on global liquid cooling for AI data centers market

7. Five Forces Analysis

7.1 Five forces summary

Five forces analysis - Comparison between 2025 and 2030

7.2 Bargaining power of buyers

Bargaining power of buyers - Impact of key factors 2025 and 2030

7.3 Bargaining power of suppliers

Bargaining power of suppliers - Impact of key factors in 2025 and 2030

7.4 Threat of new entrants

Threat of new entrants - Impact of key factors in 2025 and 2030

7.5 Threat of substitutes

Threat of substitutes - Impact of key factors in 2025 and 2030

7.6 Threat of rivalry

Threat of rivalry - Impact of key factors in 2025 and 2030

7.7 Market condition

Chart on Market condition - Five forces 2025 and 2030

8. Market Segmentation by Type

8.1 Market segments

Chart on Type - Market share 2025-2030 (%)
Data Table on Type - Market share 2025-2030 (%)

8.2 Comparison by Type

Chart on Comparison by Type
Data Table on Comparison by Type

8.3 Cold plate cooling - Market size and forecast 2025-2030

Chart on Cold plate cooling - Market size and forecast 2025-2030 ($ thousand)
Data Table on Cold plate cooling - Market size and forecast 2025-2030 ($ thousand)
Chart on Cold plate cooling - Year-over-year growth 2025-2030 (%)
Data Table on Cold plate cooling - Year-over-year growth 2025-2030 (%)

8.4 Immersion cooling - Market size and forecast 2025-2030

Chart on Immersion cooling - Market size and forecast 2025-2030 ($ thousand)
Data Table on Immersion cooling - Market size and forecast 2025-2030 ($ thousand)
Chart on Immersion cooling - Year-over-year growth 2025-2030 (%)
Data Table on Immersion cooling - Year-over-year growth 2025-2030 (%)

8.5 Spray liquid cooling - Market size and forecast 2025-2030

Chart on Spray liquid cooling - Market size and forecast 2025-2030 ($ thousand)
Data Table on Spray liquid cooling - Market size and forecast 2025-2030 ($ thousand)
Chart on Spray liquid cooling - Year-over-year growth 2025-2030 (%)
Data Table on Spray liquid cooling - Year-over-year growth 2025-2030 (%)

8.6 Market opportunity by Type

Market opportunity by Type ($ thousand)
Data Table on Market opportunity by Type ($ thousand)

9. Market Segmentation by End-user

9.1 Market segments

Chart on End-user - Market share 2025-2030 (%)
Data Table on End-user - Market share 2025-2030 (%)

9.2 Comparison by End-user

Chart on Comparison by End-user
Data Table on Comparison by End-user

9.3 Hyperscale data centers - Market size and forecast 2025-2030

Chart on Hyperscale data centers - Market size and forecast 2025-2030 ($ thousand)
Data Table on Hyperscale data centers - Market size and forecast 2025-2030 ($ thousand)
Chart on Hyperscale data centers - Year-over-year growth 2025-2030 (%)
Data Table on Hyperscale data centers - Year-over-year growth 2025-2030 (%)

9.4 Colocation data centers - Market size and forecast 2025-2030

Chart on Colocation data centers - Market size and forecast 2025-2030 ($ thousand)
Data Table on Colocation data centers - Market size and forecast 2025-2030 ($ thousand)
Chart on Colocation data centers - Year-over-year growth 2025-2030 (%)
Data Table on Colocation data centers - Year-over-year growth 2025-2030 (%)

9.5 Others - Market size and forecast 2025-2030

Chart on Others - Market size and forecast 2025-2030 ($ thousand)
Data Table on Others - Market size and forecast 2025-2030 ($ thousand)
Chart on Others - Year-over-year growth 2025-2030 (%)
Data Table on Others - Year-over-year growth 2025-2030 (%)

9.6 Market opportunity by End-user

Market opportunity by End-user ($ thousand)
Data Table on Market opportunity by End-user ($ thousand)

10. Market Segmentation by Component

10.1 Market segments

Chart on Component - Market share 2025-2030 (%)
Data Table on Component - Market share 2025-2030 (%)

10.2 Comparison by Component

Chart on Comparison by Component
Data Table on Comparison by Component

10.3 Solutions - Market size and forecast 2025-2030

Chart on Solutions - Market size and forecast 2025-2030 ($ thousand)
Data Table on Solutions - Market size and forecast 2025-2030 ($ thousand)
Chart on Solutions - Year-over-year growth 2025-2030 (%)
Data Table on Solutions - Year-over-year growth 2025-2030 (%)

10.4 Services - Market size and forecast 2025-2030

Chart on Services - Market size and forecast 2025-2030 ($ thousand)
Data Table on Services - Market size and forecast 2025-2030 ($ thousand)
Chart on Services - Year-over-year growth 2025-2030 (%)
Data Table on Services - Year-over-year growth 2025-2030 (%)

10.5 Market opportunity by Component

Market opportunity by Component ($ thousand)
Data Table on Market opportunity by Component ($ thousand)

11. Customer Landscape

11.1 Customer landscape overview

Analysis of price sensitivity, lifecycle, customer purchase basket, adoption rates, and purchase criteria

12. Geographic Landscape

12.1 Geographic segmentation

Chart on Market share by geography 2025-2030 (%)
Data Table on Market share by geography 2025-2030 (%)

12.2 Geographic comparison

Chart on Geographic comparison
Data Table on Geographic comparison

12.3 North America - Market size and forecast 2025-2030

Chart on North America - Market size and forecast 2025-2030 ($ thousand)
Data Table on North America - Market size and forecast 2025-2030 ($ thousand)
Chart on North America - Year-over-year growth 2025-2030 (%)
Data Table on North America - Year-over-year growth 2025-2030 (%)
Chart on Regional Comparison - North America
Data Table on Regional Comparison - North America

12.3.1 US - Market size and forecast 2025-2030

Chart on US - Market size and forecast 2025-2030 ($ thousand)
Data Table on US - Market size and forecast 2025-2030 ($ thousand)
Chart on US - Year-over-year growth 2025-2030 (%)
Data Table on US - Year-over-year growth 2025-2030 (%)

12.3.2 Canada - Market size and forecast 2025-2030

Chart on Canada - Market size and forecast 2025-2030 ($ thousand)
Data Table on Canada - Market size and forecast 2025-2030 ($ thousand)
Chart on Canada - Year-over-year growth 2025-2030 (%)
Data Table on Canada - Year-over-year growth 2025-2030 (%)

12.3.3 Mexico - Market size and forecast 2025-2030

Chart on Mexico - Market size and forecast 2025-2030 ($ thousand)
Data Table on Mexico - Market size and forecast 2025-2030 ($ thousand)
Chart on Mexico - Year-over-year growth 2025-2030 (%)
Data Table on Mexico - Year-over-year growth 2025-2030 (%)

12.4 APAC - Market size and forecast 2025-2030

Chart on APAC - Market size and forecast 2025-2030 ($ thousand)
Data Table on APAC - Market size and forecast 2025-2030 ($ thousand)
Chart on APAC - Year-over-year growth 2025-2030 (%)
Data Table on APAC - Year-over-year growth 2025-2030 (%)
Chart on Regional Comparison - APAC
Data Table on Regional Comparison - APAC

12.4.1 China - Market size and forecast 2025-2030

Chart on China - Market size and forecast 2025-2030 ($ thousand)
Data Table on China - Market size and forecast 2025-2030 ($ thousand)
Chart on China - Year-over-year growth 2025-2030 (%)
Data Table on China - Year-over-year growth 2025-2030 (%)

12.4.2 Japan - Market size and forecast 2025-2030

Chart on Japan - Market size and forecast 2025-2030 ($ thousand)
Data Table on Japan - Market size and forecast 2025-2030 ($ thousand)
Chart on Japan - Year-over-year growth 2025-2030 (%)
Data Table on Japan - Year-over-year growth 2025-2030 (%)

12.4.3 India - Market size and forecast 2025-2030

Chart on India - Market size and forecast 2025-2030 ($ thousand)
Data Table on India - Market size and forecast 2025-2030 ($ thousand)
Chart on India - Year-over-year growth 2025-2030 (%)
Data Table on India - Year-over-year growth 2025-2030 (%)

12.4.4 South Korea - Market size and forecast 2025-2030

Chart on South Korea - Market size and forecast 2025-2030 ($ thousand)
Data Table on South Korea - Market size and forecast 2025-2030 ($ thousand)
Chart on South Korea - Year-over-year growth 2025-2030 (%)
Data Table on South Korea - Year-over-year growth 2025-2030 (%)

12.4.5 Australia - Market size and forecast 2025-2030

Chart on Australia - Market size and forecast 2025-2030 ($ thousand)
Data Table on Australia - Market size and forecast 2025-2030 ($ thousand)
Chart on Australia - Year-over-year growth 2025-2030 (%)
Data Table on Australia - Year-over-year growth 2025-2030 (%)

12.4.6 Indonesia - Market size and forecast 2025-2030

Chart on Indonesia - Market size and forecast 2025-2030 ($ thousand)
Data Table on Indonesia - Market size and forecast 2025-2030 ($ thousand)
Chart on Indonesia - Year-over-year growth 2025-2030 (%)
Data Table on Indonesia - Year-over-year growth 2025-2030 (%)

12.5 Europe - Market size and forecast 2025-2030

Chart on Europe - Market size and forecast 2025-2030 ($ thousand)
Data Table on Europe - Market size and forecast 2025-2030 ($ thousand)
Chart on Europe - Year-over-year growth 2025-2030 (%)
Data Table on Europe - Year-over-year growth 2025-2030 (%)
Chart on Regional Comparison - Europe
Data Table on Regional Comparison - Europe

12.5.1 Germany - Market size and forecast 2025-2030

Chart on Germany - Market size and forecast 2025-2030 ($ thousand)
Data Table on Germany - Market size and forecast 2025-2030 ($ thousand)
Chart on Germany - Year-over-year growth 2025-2030 (%)
Data Table on Germany - Year-over-year growth 2025-2030 (%)

12.5.2 UK - Market size and forecast 2025-2030

Chart on UK - Market size and forecast 2025-2030 ($ thousand)
Data Table on UK - Market size and forecast 2025-2030 ($ thousand)
Chart on UK - Year-over-year growth 2025-2030 (%)
Data Table on UK - Year-over-year growth 2025-2030 (%)

12.5.3 France - Market size and forecast 2025-2030

Chart on France - Market size and forecast 2025-2030 ($ thousand)
Data Table on France - Market size and forecast 2025-2030 ($ thousand)
Chart on France - Year-over-year growth 2025-2030 (%)
Data Table on France - Year-over-year growth 2025-2030 (%)

12.5.4 Italy - Market size and forecast 2025-2030

Chart on Italy - Market size and forecast 2025-2030 ($ thousand)
Data Table on Italy - Market size and forecast 2025-2030 ($ thousand)
Chart on Italy - Year-over-year growth 2025-2030 (%)
Data Table on Italy - Year-over-year growth 2025-2030 (%)

12.5.5 Spain - Market size and forecast 2025-2030

Chart on Spain - Market size and forecast 2025-2030 ($ thousand)
Data Table on Spain - Market size and forecast 2025-2030 ($ thousand)
Chart on Spain - Year-over-year growth 2025-2030 (%)
Data Table on Spain - Year-over-year growth 2025-2030 (%)

12.5.6 The Netherlands - Market size and forecast 2025-2030

Chart on The Netherlands - Market size and forecast 2025-2030 ($ thousand)
Data Table on The Netherlands - Market size and forecast 2025-2030 ($ thousand)
Chart on The Netherlands - Year-over-year growth 2025-2030 (%)
Data Table on The Netherlands - Year-over-year growth 2025-2030 (%)

12.6 South America - Market size and forecast 2025-2030

Chart on South America - Market size and forecast 2025-2030 ($ thousand)
Data Table on South America - Market size and forecast 2025-2030 ($ thousand)
Chart on South America - Year-over-year growth 2025-2030 (%)
Data Table on South America - Year-over-year growth 2025-2030 (%)
Chart on Regional Comparison - South America
Data Table on Regional Comparison - South America

12.6.1 Brazil - Market size and forecast 2025-2030

Chart on Brazil - Market size and forecast 2025-2030 ($ thousand)
Data Table on Brazil - Market size and forecast 2025-2030 ($ thousand)
Chart on Brazil - Year-over-year growth 2025-2030 (%)
Data Table on Brazil - Year-over-year growth 2025-2030 (%)

12.6.2 Argentina - Market size and forecast 2025-2030

Chart on Argentina - Market size and forecast 2025-2030 ($ thousand)
Data Table on Argentina - Market size and forecast 2025-2030 ($ thousand)
Chart on Argentina - Year-over-year growth 2025-2030 (%)
Data Table on Argentina - Year-over-year growth 2025-2030 (%)

12.6.3 Chile - Market size and forecast 2025-2030

Chart on Chile - Market size and forecast 2025-2030 ($ thousand)
Data Table on Chile - Market size and forecast 2025-2030 ($ thousand)
Chart on Chile - Year-over-year growth 2025-2030 (%)
Data Table on Chile - Year-over-year growth 2025-2030 (%)

12.7 Middle East and Africa - Market size and forecast 2025-2030

Chart on Middle East and Africa - Market size and forecast 2025-2030 ($ thousand)
Data Table on Middle East and Africa - Market size and forecast 2025-2030 ($ thousand)
Chart on Middle East and Africa - Year-over-year growth 2025-2030 (%)
Data Table on Middle East and Africa - Year-over-year growth 2025-2030 (%)
Chart on Regional Comparison - Middle East and Africa
Data Table on Regional Comparison - Middle East and Africa

12.7.1 Saudi Arabia - Market size and forecast 2025-2030

Chart on Saudi Arabia - Market size and forecast 2025-2030 ($ thousand)
Data Table on Saudi Arabia - Market size and forecast 2025-2030 ($ thousand)
Chart on Saudi Arabia - Year-over-year growth 2025-2030 (%)
Data Table on Saudi Arabia - Year-over-year growth 2025-2030 (%)

12.7.2 UAE - Market size and forecast 2025-2030

Chart on UAE - Market size and forecast 2025-2030 ($ thousand)
Data Table on UAE - Market size and forecast 2025-2030 ($ thousand)
Chart on UAE - Year-over-year growth 2025-2030 (%)
Data Table on UAE - Year-over-year growth 2025-2030 (%)

12.7.3 South Africa - Market size and forecast 2025-2030

Chart on South Africa - Market size and forecast 2025-2030 ($ thousand)
Data Table on South Africa - Market size and forecast 2025-2030 ($ thousand)
Chart on South Africa - Year-over-year growth 2025-2030 (%)
Data Table on South Africa - Year-over-year growth 2025-2030 (%)

12.7.4 Israel - Market size and forecast 2025-2030

Chart on Israel - Market size and forecast 2025-2030 ($ thousand)
Data Table on Israel - Market size and forecast 2025-2030 ($ thousand)
Chart on Israel - Year-over-year growth 2025-2030 (%)
Data Table on Israel - Year-over-year growth 2025-2030 (%)

12.7.5 Turkey - Market size and forecast 2025-2030

Chart on Turkey - Market size and forecast 2025-2030 ($ thousand)
Data Table on Turkey - Market size and forecast 2025-2030 ($ thousand)
Chart on Turkey - Year-over-year growth 2025-2030 (%)
Data Table on Turkey - Year-over-year growth 2025-2030 (%)

12.8 Market opportunity by geography

Market opportunity by geography ($ thousand)
Data Tables on Market opportunity by geography ($ thousand)

13. Drivers, Challenges, and Opportunity

13.1 Market drivers

Elevated thermal design power and rack density in AI hardware
Imperatives for energy efficiency and sustainability mandates
Exponential proliferation of generative artificial intelligence workloads

13.2 Market challenges

Significant capital expenditure requirements and infrastructure integration complexity
Operational risks associated with fluid management and equipment integrity
Critical shortage of specialized technical expertise and skilled labor workforce

13.3 Impact of drivers and challenges

Impact of drivers and challenges in 2025 and 2030

13.4 Market opportunities

Shift toward standardized modular cooling architectures and retrofitting strategies
Strategic dominance of single phase direct liquid cooling and advanced cold plate innovation
Collaborative ecosystem development and company consolidation via strategic partnerships

14. Competitive Landscape

14.1 Overview

14.2

Overview on criticality of inputs and factors of differentiation

14.3 Landscape disruption

Overview on factors of disruption

14.4 Industry risks

Impact of key risks on business

15. Competitive Analysis

15.1 Companies profiled

Companies covered

15.2 Company ranking index

15.3 Market positioning of companies

Matrix on companies position and classification

15.4 Boyd Corp.

Boyd Corp. - Overview
Boyd Corp. - Product / Service
Boyd Corp. - Key offerings
SWOT

15.5 Chilldyne

Chilldyne - Overview
Chilldyne - Product / Service
Chilldyne - Key offerings
SWOT

15.6 Danfoss AS

Danfoss AS - Overview
Danfoss AS - Product / Service
Danfoss AS - Key offerings
SWOT

15.7 Dell Technologies Inc.

Dell Technologies Inc. - Overview
Dell Technologies Inc. - Business segments
Dell Technologies Inc. - Key news
Dell Technologies Inc. - Key offerings
Dell Technologies Inc. - Segment focus
SWOT

15.8 Delta Electronics Inc.

Delta Electronics Inc. - Overview
Delta Electronics Inc. - Business segments
Delta Electronics Inc. - Key offerings
Delta Electronics Inc. - Segment focus
SWOT

15.9 Fujitsu Ltd

Fujitsu Ltd - Overview
Fujitsu Ltd - Product / Service
Fujitsu Ltd - Key news
Fujitsu Ltd - Key offerings
SWOT

15.10 Hewlett Packard Enterprise Co.

Hewlett Packard Enterprise Co. - Overview
Hewlett Packard Enterprise Co. - Business segments
Hewlett Packard Enterprise Co. - Key news
Hewlett Packard Enterprise Co. - Key offerings
Hewlett Packard Enterprise Co. - Segment focus
SWOT

15.11 Lenovo Group Ltd.

Lenovo Group Ltd. - Overview
Lenovo Group Ltd. - Business segments
Lenovo Group Ltd. - Key offerings
Lenovo Group Ltd. - Segment focus
SWOT

15.12 Motivair Corp.

Motivair Corp. - Overview
Motivair Corp. - Product / Service
Motivair Corp. - Key offerings
SWOT

15.13 nVent Electric Plc

nVent Electric Plc - Overview
nVent Electric Plc - Business segments
nVent Electric Plc - Key offerings
nVent Electric Plc - Segment focus
SWOT

15.14 Rittal GmbH and Co. KG

Rittal GmbH and Co. KG - Overview
Rittal GmbH and Co. KG - Product / Service
Rittal GmbH and Co. KG - Key offerings
SWOT

15.15 Schneider Electric SE

Schneider Electric SE - Overview
Schneider Electric SE - Business segments
Schneider Electric SE - Key news
Schneider Electric SE - Key offerings
Schneider Electric SE - Segment focus
SWOT

15.16 STULZ GmbH

STULZ GmbH - Overview
STULZ GmbH - Product / Service
STULZ GmbH - Key offerings
SWOT

15.17 Super Micro Computer Inc.

Super Micro Computer Inc. - Overview
Super Micro Computer Inc. - Business segments
Super Micro Computer Inc. - Key offerings
Super Micro Computer Inc. - Segment focus
SWOT

15.18 Vertiv Holdings Co.

Vertiv Holdings Co. - Overview
Vertiv Holdings Co. - Business segments
Vertiv Holdings Co. - Key news
Vertiv Holdings Co. - Key offerings
Vertiv Holdings Co. - Segment focus
SWOT

16. Appendix

16.1 Scope of the report

Market definition
Objectives
Notes and caveats

16.2 Inclusions and exclusions checklist

Inclusions checklist
Exclusions checklist

16.3 Currency conversion rates for US$

16.4 Research methodology

16.5 Data procurement

Information sources

16.6 Data validation

16.7 Validation techniques employed for market sizing

16.8 Data synthesis

16.9 360 degree market analysis

16.10 List of abbreviations

Research Methodology

Technavio presents a detailed picture of the market by way of study, synthesis, and summation of data from multiple sources. The analysts have presented the various facets of the market with a particular focus on identifying the key industry influencers. The data thus presented is comprehensive, reliable, and the result of extensive research, both primary and secondary.

INFORMATION SOURCES

Primary sources

  • Manufacturers and suppliers
  • Channel partners
  • Industry experts
  • Strategic decision makers

Secondary sources

  • Industry journals and periodicals
  • Government data
  • Financial reports of key industry players
  • Historical data
  • Press releases

DATA ANALYSIS

Data Synthesis

  • Collation of data
  • Estimation of key figures
  • Analysis of derived insights

Data Validation

  • Triangulation with data models
  • Reference against proprietary databases
  • Corroboration with industry experts

REPORT WRITING

Qualitative

  • Market drivers
  • Market challenges
  • Market trends
  • Five forces analysis

Quantitative

  • Market size and forecast
  • Market segmentation
  • Geographical insights
  • Competitive landscape

Interested in this report?

Get your sample now to see our research methodology and insights!

Download Now

Frequently Asked Questions

Liquid Cooling For AI Data Centers market growth will increase by USD 2479492.4 thousand thousand during 2026-2030.

The Liquid Cooling For AI Data Centers market is expected to grow at a CAGR of 31.7% during 2026-2030.

Liquid Cooling For AI Data Centers market is segmented by Type (Cold plate cooling, Immersion cooling, Spray liquid cooling) End-user (Hyperscale data centers, Colocation data centers, Others) Component (Solutions, Services)

Aecorsis BV, Asetek Danmark AS, Boyd Corp., Chilldyne, Coolit Systems, Danfoss AS, Dell Technologies Inc., Delta Electronics Inc., Fujitsu Ltd, Hewlett Packard Enterprise Co., Iceotope Technologies Ltd., Lenovo Group Ltd., LiquidStack BV, Motivair Corp., nVent Electric Plc, Rittal GmbH and Co. KG, Schneider Electric SE, STULZ GmbH, Super Micro Computer Inc., Vertiv Holdings Co. are a few of the key vendors in the Liquid Cooling For AI Data Centers market.

North America will register the highest growth rate of 34.6% among the other regions. Therefore, the Liquid Cooling For AI Data Centers market in North America is expected to garner significant business opportunities for the vendors during the forecast period.

US, Canada, Mexico, China, Japan, India, South Korea, Australia, Indonesia, Germany, UK, France, Italy, Spain, The Netherlands, Brazil, Argentina, Chile, Saudi Arabia, UAE, South Africa, Israel, Turkey

  • Elevated thermal design power and rack density in AI hardware is the driving factor this market.

The Liquid Cooling For AI Data Centers market vendors should focus on grabbing business opportunities from the Type segment as it accounted for the largest market share in the base year.
RIA - Research AI Assistant
Ask RIA