Liquorice Market Size 2025-2029
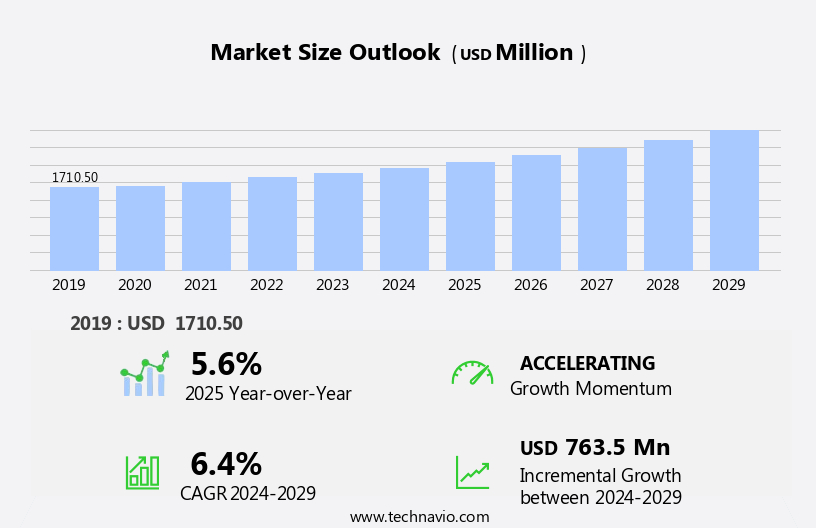
The liquorice market size is forecast to increase by USD 763.5 million, at a CAGR of 6.4% between 2024 and 2029.
- The market is witnessing significant growth due to the increasing consumer preference for organic food and beverages containing herbal ingredients. The immunity-boosting properties of herbal extracts, such as those found in liquorice, are driving demand in various end-use industries. Companies focusing on providing high-quality herbal products are well-positioned to capitalize on this trend. However, challenges persist in the form of stringent regulations regarding the use of certain herbal ingredients in food and beverages, which may limit innovation and product development. Additionally, ensuring sustainable sourcing and ethical production practices is crucial to maintain consumer trust and meet evolving market expectations.
- To succeed in this market, companies must navigate these challenges by staying informed of regulatory changes and implementing robust supply chain management systems. By delivering high-quality, herbal products that cater to consumer health trends, businesses can effectively capitalize on the growth opportunities presented in the market.
What will be the Size of the Liquorice Market during the forecast period?

Explore in-depth regional segment analysis with market size data - historical 2019-2023 and forecasts 2025-2029 - in the full report.
Request Free Sample
The market continues to evolve, shaped by dynamic market forces and emerging trends. Liquorice, derived from the root of the Glycyrrhiza plant, offers a diverse range of applications across various sectors. In the realm of cosmetics, liquorice's bioactive compounds, including glycyrrhizic acid and flavonoids, are increasingly sought after for their skin-soothing properties. Post-harvest handling techniques and powder processing methods are continually refined to optimize the extraction and preservation of these valuable components. The food industry also remains a significant market for liquorice, with ongoing innovation in product development and flavor profiles. Liquorice's unique aroma and saponin content contribute to its widespread use in confectionery, baked goods, and beverages.
Storage conditions play a crucial role in maintaining the quality and value of liquorice, with temperature, humidity, and protective packaging all critical factors. Plant breeding programs are also advancing, with a focus on improving yield, disease resistance, and sustainability practices. Consumer demand for liquorice continues to grow, driven by its medicinal properties and versatility. Regulatory compliance and price volatility are ongoing challenges, requiring efficient cultivation techniques and soil requirements to ensure a consistent supply. The liquorice industry is characterized by ongoing research and development, with a focus on extract standardization, purification, and value-added products. The future of the market is shaped by these evolving trends and the continuous unfolding of market activities.
How is this Liquorice Industry segmented?
The liquorice industry research report provides comprehensive data (region-wise segment analysis), with forecasts and estimates in "USD million" for the period 2025-2029, as well as historical data from 2019-2023 for the following segments.
- Grade Type
- Food grade
- Feed grade
- Pharmaceutical grade
- Application
- Food and beverages
- Pharmaceuticals
- Tobacco
- Others
- Product Type
- Fruit flavored licorice
- Original black licorice
- Distribution Channel
- Supermarkets
- Online sales
- Convenience stores
- End-user
- Individual consumers
- Industrial users
- Geography
- North America
- Europe
- France
- Germany
- Italy
- Spain
- UK
- Middle East and Africa
- APAC
- China
- India
- Japan
- South Korea
- South America
- Rest of World (ROW)
By Grade Type Insights
The food grade segment is estimated to witness significant growth during the forecast period.

Request Free Sample
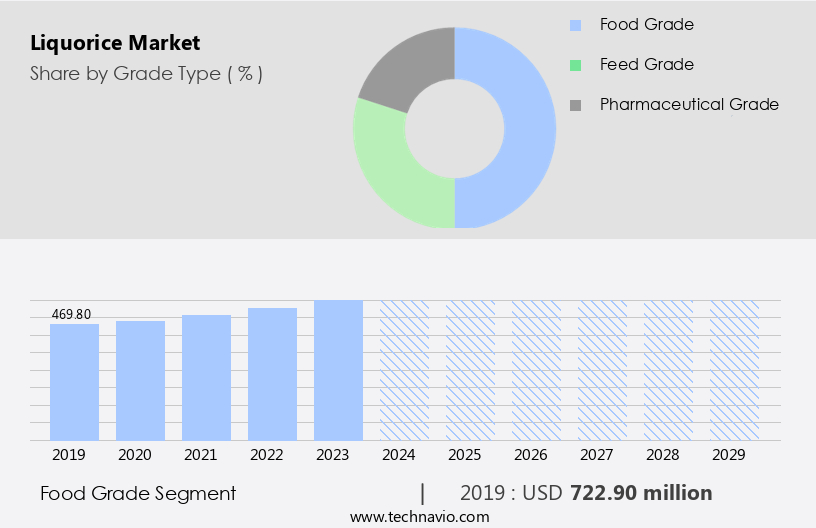
The Food grade segment was valued at USD 722.90 million in 2019 and showed a gradual increase during the forecast period.
Regional Analysis
APAC is estimated to contribute 34% to the growth of the global market during the forecast period.Technavio's analysts have elaborately explained the regional trends and drivers that shape the market during the forecast period.

Request Free Sample
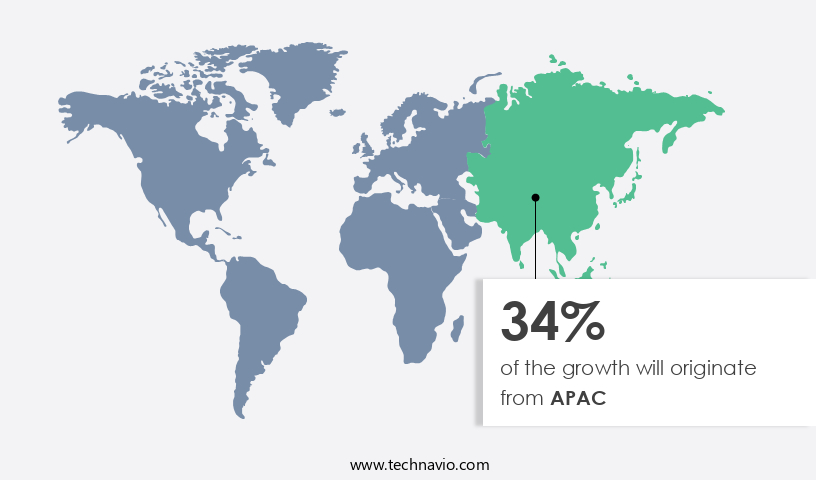
The market in Asia Pacific is experiencing moderate growth due to increasing consumer awareness of the side effects of allopathic medicines and the therapeutic benefits of herbal products, including liquorice. This awareness has led to a higher demand for herbal extracts and dietary supplements in the region. Moreover, the rise in obesity and the prevalence of cardiovascular and other nutrient-deficiency related diseases in countries like China and India are driving the use of liquorice extracts in food and beverage products. Liquorice root morphology and cultivation techniques play a significant role in optimizing yield and improving processing efficiency. Irrigation management and sustainability practices are essential to maintain soil requirements and ensure regulatory compliance.
Liquorice extract standardization and purification techniques are crucial to ensure the quality of the final product. The market segmentation includes various applications, such as food, pharmaceuticals, cosmetics, and dietary supplements. Liquorice's chemical composition, including bioactive compounds like glycyrrhizic acid, flavonoids, and saponins, contributes to its medicinal properties and value-added products. The market trends include the development of new liquorice-based products, such as cosmetics and functional foods, and the optimization of post-harvest handling and powder processing techniques. Consumer demand for liquorice remains strong due to its unique aroma profile and medicinal properties.
Market Dynamics
Our researchers analyzed the data with 2024 as the base year, along with the key drivers, trends, and challenges. A holistic analysis of drivers will help companies refine their marketing strategies to gain a competitive advantage.
The global liquorice market size and forecast projects growth, driven by liquorice market trends 2025-2029. B2B liquorice supply solutions leverage natural extract technologies for quality. Liquorice market growth opportunities 2025 include liquorice for confectionery and liquorice for health supplements, meeting demand. Liquorice supply chain software optimizes operations, while liquorice market competitive analysis highlights key suppliers. Sustainable liquorice practices align with eco-friendly ingredient trends. Liquorice regulations 2025-2029 shapes liquorice demand in Asia 2025. High-purity liquorice solutions and premium liquorice insights boost adoption. Liquorice for beverages and customized liquorice products target niches. Liquorice market challenges and solutions address sourcing, with direct procurement strategies for liquorice and liquorice pricing optimization enhancing profitability. Data-driven liquorice market analytics and natural sweetener trends drive innovation.
What are the key market drivers leading to the rise in the adoption of Liquorice Industry?
- The surging market trend is driven primarily by the increasing consumer preference for food and beverage products infused with herbal ingredients.
- The market for liquorice-based products is experiencing significant growth due to increasing consumer preference for natural ingredients in food and beverages. With a rise in health consciousness, there is a growing demand for herbal extracts, including liquorice, which are free from gluten, artificial flavors, and preservatives. Liquorice extracts offer numerous benefits, such as a unique aroma profile and medicinal properties, which are driving their adoption in various industries. Manufacturers of value-added products, such as herbal teas, are leveraging the benefits of liquorice to cater to the needs of health-conscious consumers. Liquorice flavonoids analysis and liquorice saponin content are crucial factors in the production of standardized and purified liquorice extracts.
- The focus on liquorice extract standardization and purification is essential to ensure consistency and quality in the final product. The natural liquorice flavor compounds are gaining popularity due to their ability to provide a harmonious and immersive taste experience. The market dynamics are driven by the increasing demand for natural ingredients and the growing awareness of the adverse effects of synthetic chemicals used in food and beverages. The demand for liquorice extracts is expected to continue to surge as consumers seek out natural alternatives to synthetic ingredients.
What are the market trends shaping the Liquorice Industry?
- The trend in the market is leaning towards herbal extracts and their immunity-boosting properties The market has witnessed significant growth due to the increasing consumer demand for immunity-boosting herbal products. The enzymes found in liquorice plant roots contribute to the production of lymphocytes and macrophages, which are essential for the body's natural defense against microbes, pollutants, and allergens. In developed countries, including the US, Canada, and the UK, the consumption of herbal supplements is prevalent due to rising health concerns among consumers. Obesity and other inflammatory health conditions are common in these countries, leading health-conscious consumers to opt for functional food and beverage options that enhance immunity.
- Liquorice cosmetic ingredients and post-harvest handling techniques have gained importance to ensure the quality and purity of the product. Liquorice powder processing methods have been refined to maintain the flavor and nutritional value of the root. Liquorice food applications have expanded beyond traditional confectionery uses to include baked goods, beverages, and functional foods. Proper storage conditions are crucial to preserve the liquorice plant's properties and ensure its efficacy. Plant breeding and research continue to focus on improving the yield, quality, and resistance to diseases and pests. The market's growth is driven by these factors and the increasing consumer awareness of the health benefits associated with the use of liquorice.
What challenges does the Liquorice Industry face during its growth?
- Ensuring the production and provision of high-quality herbal products is a critical requirement for the industry's growth, as consumer trust and regulatory compliance heavily depend on it.
- The market encompasses the production and sale of liquorice and its derived products. The primary raw material for these products is the liquorice root, derived from the Glycyrrhiza glabra plant. However, ensuring the quality and safety of these products poses challenges. The extraction of glycyrrhizic acid, a key bioactive compound in liquorice, can be complex due to the plant's morphology and the need for precise irrigation management. Contamination is also a concern, as the conditions under which the root is grown and harvested can impact the final product's quality.
- To address these challenges, companies are focusing on innovations in liquorice product development and implementing sustainability practices. These efforts include improving cultivation methods, optimizing irrigation, and implementing rigorous quality control measures to ensure the production of safe and effective liquorice products.
Exclusive Customer Landscape
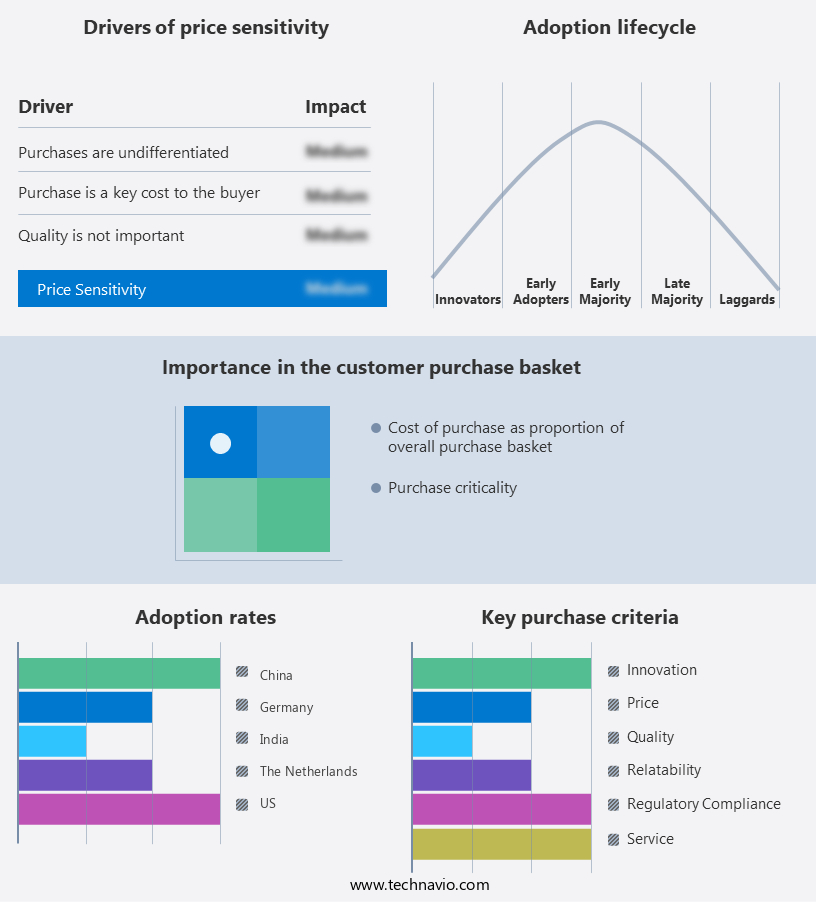
The liquorice market forecasting report includes the adoption lifecycle of the market, covering from the innovator's stage to the laggard's stage. It focuses on adoption rates in different regions based on penetration. Furthermore, the liquorice market report also includes key purchase criteria and drivers of price sensitivity to help companies evaluate and develop their market growth analysis strategies.

Customer Landscape
Key Companies & Market Insights
Companies are implementing various strategies, such as strategic alliances, liquorice market forecast, partnerships, mergers and acquisitions, geographical expansion, and product/service launches, to enhance their presence in the industry.
HARIBO GmbH & Co. KG - This company specializes in the production and supply of high-quality liquorice products, including Licorice Extract Block and Powder, catering to various industries and applications. Their offerings undergo rigorous quality control processes to ensure consistency and purity.
The industry research and growth report includes detailed analyses of the competitive landscape of the market and information about key companies, including:
- HARIBO GmbH & Co. KG
- Mondelez International Inc.
- Nestlé S.A.
- Perfetti Van Melle Group B.V.
- Mars Incorporated
- Cloetta AB
- Katjes International GmbH
- August Storck KG
- Gustaf's Licorice
- Ricola Group Ltd.
- Yildiz Holding A.S.
- Hershey Company
- Ferrara Candy Company
- Switzer's Licorice
- RJ's Licorice Ltd.
- Toms Group A/S
- Lakrids by Bülow
- Darrell Lea Confectionery Co. Pty Ltd
- Amarelli Fabbrica di Liquirizia
- Panda Licorice
Qualitative and quantitative analysis of companies has been conducted to help clients understand the wider business environment as well as the strengths and weaknesses of key industry players. Data is qualitatively analyzed to categorize companies as pure play, category-focused, industry-focused, and diversified; it is quantitatively analyzed to categorize companies as dominant, leading, strong, tentative, and weak.
Recent Development and News in Liquorice Market
- In January 2024, Ferrara Candy Company, a leading confectionery manufacturer, announced the launch of its new line of Black Forest Liquorice gummies, expanding its product offerings in the market (Ferrara Candy Company Press Release).
- In March 2024, Nestle and Ferrero, two major players in the food industry, entered into a strategic partnership to co-manufacture and distribute Ferrero's liquorice products in Europe, aiming to strengthen their market presence and optimize production costs (Bloomberg).
- In May 2025, the European Commission approved the acquisition of the Swedish liquorice manufacturer, Salmiakki-Kauppa Oy, by the Finnish candy company, Fazer Group, for â¬150 million, marking Fazer's entry into the market and increasing its presence in the Nordic region (Fazer Group Press Release).
- In May 2025, the Food and Drug Administration (FDA) in the United States granted GRAS (Generally Recognized as Safe) status to natural licorice extract, allowing its use as a flavoring agent in food and beverages, potentially boosting demand for liquorice products in the US market (FDA Press Release).
Research Analyst Overview
- In the dynamic the market, various aspects influence the production and consumption of this ancient sweet root. Authentication methods and quality assessment play a crucial role in ensuring consumer trust, while flavour enhancement and product formulation cater to evolving taste preferences. Sustainability initiatives, such as waste management and by-product utilization, are essential for the industry's economic impact and social responsibility. Liquorice's drying methods and genetic diversity impact its phytochemical profile, affecting therapeutic uses and health benefits. Phytochemistry research uncovers new applications for glycyrrhetinic acid derivatives.
- Brand positioning and marketing strategies rely on consumer sensory evaluation and packaging solutions to differentiate products. Processing technology advancements enable traceability systems, ensuring product authenticity and reducing adulteration risks. Liquorice cultivation regions and traditional medicine practices add to the market's rich history. Extraction solvents and sustainability initiatives contribute to the industry's progress, shaping the future of this versatile market.
Dive into Technavio's robust research methodology, blending expert interviews, extensive data synthesis, and validated models for unparalleled Liquorice Market insights. See full methodology.
|
Market Scope
|
|
Report Coverage
|
Details
|
|
Page number
|
248
|
|
Base year
|
2024
|
|
Historic period
|
2019-2023 |
|
Forecast period
|
2025-2029
|
|
Growth momentum & CAGR
|
Accelerate at a CAGR of 6.4%
|
|
Market growth 2025-2029
|
USD 763.5 million
|
|
Market structure
|
Fragmented
|
|
YoY growth 2024-2025(%)
|
5.6
|
|
Key countries
|
US, China, Germany, Canada, India, South Korea, France, Japan, Italy, Brazil, UAE, UK, Spain, and Mexico
|
|
Competitive landscape
|
Leading Companies, Market Positioning of Companies, Competitive Strategies, and Industry Risks
|
Request Free Sample
What are the Key Data Covered in this Liquorice Market Research and Growth Report?
- CAGR of the Liquorice industry during the forecast period
- Detailed information on factors that will drive the growth and forecasting between 2025 and 2029
- Precise estimation of the size of the market and its contribution of the industry in focus to the parent market
- Accurate predictions about upcoming growth and trends and changes in consumer behaviour
- Growth of the market across APAC, Europe, North America, Middle East and Africa, and South America
- Thorough analysis of the market's competitive landscape and detailed information about companies
- Comprehensive analysis of factors that will challenge the liquorice market growth of industry companies
We can help! Our analysts can customize this liquorice market research report to meet your requirements.
Get in touch
1 Executive Summary
- 1.1 Market overview
- Executive Summary - Chart on Market Overview
- Executive Summary - Data Table on Market Overview
- Executive Summary - Chart on Global Market Characteristics
- Executive Summary - Chart on Market by Geography
- Executive Summary - Chart on Market Segmentation by Grade Type
- Executive Summary - Chart on Market Segmentation by Application
- Executive Summary - Chart on Market Segmentation by Product Type
- Executive Summary - Chart on Market Segmentation by Distribution Channel
- Executive Summary - Chart on Market Segmentation by End-user
- Executive Summary - Chart on Incremental Growth
- Executive Summary - Data Table on Incremental Growth
- Executive Summary - Chart on Company Market Positioning
2 Technavio Analysis
- 2.1 Analysis of price sensitivity, lifecycle, customer purchase basket, adoption rates, and purchase criteria
- Analysis of price sensitivity, lifecycle, customer purchase basket, adoption rates, and purchase criteria
- 2.2 Criticality of inputs and Factors of differentiation
- Overview on criticality of inputs and factors of differentiation
- 2.3 Factors of disruption
- Overview on factors of disruption
- 2.4 Impact of drivers and challenges
- Impact of drivers and challenges in 2024 and 2029
3 Market Landscape
- 3.1 Market ecosystem
- Parent Market
- Data Table on - Parent Market
- 3.2 Market characteristics
- Market characteristics analysis
4 Market Sizing
- 4.1 Market definition
- Offerings of companies included in the market definition
- 4.2 Market segment analysis
- 4.4 Market outlook: Forecast for 2024-2029
- Chart on Global - Market size and forecast 2024-2029 ($ million)
- Data Table on Global - Market size and forecast 2024-2029 ($ million)
- Chart on Global Market: Year-over-year growth 2024-2029 (%)
- Data Table on Global Market: Year-over-year growth 2024-2029 (%)
5 Historic Market Size
- 5.1 Global Liquorice Market 2019 - 2023
- Historic Market Size - Data Table on Global Liquorice Market 2019 - 2023 ($ million)
- 5.2 Grade Type segment analysis 2019 - 2023
- Historic Market Size - Grade Type Segment 2019 - 2023 ($ million)
- 5.3 Application segment analysis 2019 - 2023
- Historic Market Size - Application Segment 2019 - 2023 ($ million)
- 5.4 Product Type segment analysis 2019 - 2023
- Historic Market Size - Product Type Segment 2019 - 2023 ($ million)
- 5.5 Distribution Channel segment analysis 2019 - 2023
- Historic Market Size - Distribution Channel Segment 2019 - 2023 ($ million)
- 5.6 End-user segment analysis 2019 - 2023
- Historic Market Size - End-user Segment 2019 - 2023 ($ million)
- 5.7 Geography segment analysis 2019 - 2023
- Historic Market Size - Geography Segment 2019 - 2023 ($ million)
- 5.8 Country segment analysis 2019 - 2023
- Historic Market Size - Country Segment 2019 - 2023 ($ million)
6 Qualitative Analysis
- 6.1 The AI impact on global liquorice market
7 Five Forces Analysis
- 7.1 Five forces summary
- Five forces analysis - Comparison between 2024 and 2029
- 7.2 Bargaining power of buyers
- Bargaining power of buyers - Impact of key factors 2024 and 2029
- 7.3 Bargaining power of suppliers
- Bargaining power of suppliers - Impact of key factors in 2024 and 2029
- 7.4 Threat of new entrants
- Threat of new entrants - Impact of key factors in 2024 and 2029
- 7.5 Threat of substitutes
- Threat of substitutes - Impact of key factors in 2024 and 2029
- 7.6 Threat of rivalry
- Threat of rivalry - Impact of key factors in 2024 and 2029
- 7.7 Market condition
- Chart on Market condition - Five forces 2024 and 2029
8 Market Segmentation by Grade Type
- 8.1 Market segments
- Chart on Grade Type - Market share (2024-2029) (%)
- Data Table on Grade Type - Market share (2024-2029) (%)
- 8.2 Comparison by Grade Type
- Chart on Comparison by Grade Type
- Data Table on Comparison by Grade Type
- 8.3 Food grade - Market size and forecast (2024-2029)
- Chart on Food grade - Market size and forecast (2024-2029) ($ million)
- Data Table on Food grade - Market size and forecast (2024-2029) ($ million)
- Chart on Food grade - Year-over-year growth (2024-2029) (%)
- Data Table on Food grade - Year-over-year growth (2024-2029) (%)
- 8.4 Feed grade - Market size and forecast (2024-2029)
- Chart on Feed grade - Market size and forecast (2024-2029) ($ million)
- Data Table on Feed grade - Market size and forecast (2024-2029) ($ million)
- Chart on Feed grade - Year-over-year growth (2024-2029) (%)
- Data Table on Feed grade - Year-over-year growth (2024-2029) (%)
- 8.5 Pharmaceutical grade - Market size and forecast (2024-2029)
- Chart on Pharmaceutical grade - Market size and forecast (2024-2029) ($ million)
- Data Table on Pharmaceutical grade - Market size and forecast (2024-2029) ($ million)
- Chart on Pharmaceutical grade - Year-over-year growth (2024-2029) (%)
- Data Table on Pharmaceutical grade - Year-over-year growth (2024-2029) (%)
- 8.6 Market opportunity by Grade Type
- Market opportunity by Grade Type ($ million)
- Data Table on Market opportunity by Grade Type ($ million)
9 Market Segmentation by Application
- 9.1 Market segments
- Chart on Application - Market share (2024-2029) (%)
- Data Table on Application - Market share (2024-2029) (%)
- 9.2 Comparison by Application
- Chart on Comparison by Application
- Data Table on Comparison by Application
- 9.3 Food and beverages - Market size and forecast (2024-2029)
- Chart on Food and beverages - Market size and forecast (2024-2029) ($ million)
- Data Table on Food and beverages - Market size and forecast (2024-2029) ($ million)
- Chart on Food and beverages - Year-over-year growth (2024-2029) (%)
- Data Table on Food and beverages - Year-over-year growth (2024-2029) (%)
- 9.4 Pharmaceuticals - Market size and forecast (2024-2029)
- Chart on Pharmaceuticals - Market size and forecast (2024-2029) ($ million)
- Data Table on Pharmaceuticals - Market size and forecast (2024-2029) ($ million)
- Chart on Pharmaceuticals - Year-over-year growth (2024-2029) (%)
- Data Table on Pharmaceuticals - Year-over-year growth (2024-2029) (%)
- 9.5 Tobacco - Market size and forecast (2024-2029)
- Chart on Tobacco - Market size and forecast (2024-2029) ($ million)
- Data Table on Tobacco - Market size and forecast (2024-2029) ($ million)
- Chart on Tobacco - Year-over-year growth (2024-2029) (%)
- Data Table on Tobacco - Year-over-year growth (2024-2029) (%)
- 9.6 Others - Market size and forecast (2024-2029)
- Chart on Others - Market size and forecast (2024-2029) ($ million)
- Data Table on Others - Market size and forecast (2024-2029) ($ million)
- Chart on Others - Year-over-year growth (2024-2029) (%)
- Data Table on Others - Year-over-year growth (2024-2029) (%)
- 9.7 Market opportunity by Application
- Market opportunity by Application ($ million)
- Data Table on Market opportunity by Application ($ million)
10 Market Segmentation by Product Type
- 10.1 Market segments
- Chart on Product Type - Market share (2024-2029) (%)
- Data Table on Product Type - Market share (2024-2029) (%)
- 10.2 Comparison by Product Type
- Chart on Comparison by Product Type
- Data Table on Comparison by Product Type
- 10.3 Fruit flavored licorice - Market size and forecast (2024-2029)
- Chart on Fruit flavored licorice - Market size and forecast (2024-2029) ($ million)
- Data Table on Fruit flavored licorice - Market size and forecast (2024-2029) ($ million)
- Chart on Fruit flavored licorice - Year-over-year growth (2024-2029) (%)
- Data Table on Fruit flavored licorice - Year-over-year growth (2024-2029) (%)
- 10.4 Original black licorice - Market size and forecast (2024-2029)
- Chart on Original black licorice - Market size and forecast (2024-2029) ($ million)
- Data Table on Original black licorice - Market size and forecast (2024-2029) ($ million)
- Chart on Original black licorice - Year-over-year growth (2024-2029) (%)
- Data Table on Original black licorice - Year-over-year growth (2024-2029) (%)
- 10.5 Market opportunity by Product Type
- Market opportunity by Product Type ($ million)
- Data Table on Market opportunity by Product Type ($ million)
11 Market Segmentation by Distribution Channel
- 11.1 Market segments
- Chart on Distribution Channel - Market share (2024-2029) (%)
- Data Table on Distribution Channel - Market share (2024-2029) (%)
- 11.2 Comparison by Distribution Channel
- Chart on Comparison by Distribution Channel
- Data Table on Comparison by Distribution Channel
- 11.3 Supermarkets - Market size and forecast (2024-2029)
- Chart on Supermarkets - Market size and forecast (2024-2029) ($ million)
- Data Table on Supermarkets - Market size and forecast (2024-2029) ($ million)
- Chart on Supermarkets - Year-over-year growth (2024-2029) (%)
- Data Table on Supermarkets - Year-over-year growth (2024-2029) (%)
- 11.4 Online sales - Market size and forecast (2024-2029)
- Chart on Online sales - Market size and forecast (2024-2029) ($ million)
- Data Table on Online sales - Market size and forecast (2024-2029) ($ million)
- Chart on Online sales - Year-over-year growth (2024-2029) (%)
- Data Table on Online sales - Year-over-year growth (2024-2029) (%)
- 11.5 Convenience stores - Market size and forecast (2024-2029)
- Chart on Convenience stores - Market size and forecast (2024-2029) ($ million)
- Data Table on Convenience stores - Market size and forecast (2024-2029) ($ million)
- Chart on Convenience stores - Year-over-year growth (2024-2029) (%)
- Data Table on Convenience stores - Year-over-year growth (2024-2029) (%)
- 11.6 Market opportunity by Distribution Channel
- Market opportunity by Distribution Channel ($ million)
- Data Table on Market opportunity by Distribution Channel ($ million)
12 Market Segmentation by End-user
- 12.1 Market segments
- Chart on End-user - Market share (2024-2029) (%)
- Data Table on End-user - Market share (2024-2029) (%)
- 12.2 Comparison by End-user
- Chart on Comparison by End-user
- Data Table on Comparison by End-user
- 12.3 Individual consumers - Market size and forecast (2024-2029)
- Chart on Individual consumers - Market size and forecast (2024-2029) ($ million)
- Data Table on Individual consumers - Market size and forecast (2024-2029) ($ million)
- Chart on Individual consumers - Year-over-year growth (2024-2029) (%)
- Data Table on Individual consumers - Year-over-year growth (2024-2029) (%)
- 12.4 Industrial users - Market size and forecast (2024-2029)
- Chart on Industrial users - Market size and forecast (2024-2029) ($ million)
- Data Table on Industrial users - Market size and forecast (2024-2029) ($ million)
- Chart on Industrial users - Year-over-year growth (2024-2029) (%)
- Data Table on Industrial users - Year-over-year growth (2024-2029) (%)
- 12.5 Market opportunity by End-user
- Market opportunity by End-user ($ million)
- Data Table on Market opportunity by End-user ($ million)
13 Customer Landscape
- 13.1 Customer landscape overview
- Analysis of price sensitivity, lifecycle, customer purchase basket, adoption rates, and purchase criteria
14 Geographic Landscape
- 14.1 Geographic segmentation
- Chart on Market share by geography 2024-2029 (%)
- Data Table on Market share by geography 2024-2029 (%)
- 14.2 Geographic comparison
- Chart on Geographic comparison
- Data Table on Geographic comparison
- 14.3 APAC - Market size and forecast 2024-2029
- Chart on APAC - Market size and forecast 2024-2029 ($ million)
- Data Table on APAC - Market size and forecast 2024-2029 ($ million)
- Chart on APAC - Year-over-year growth 2024-2029 (%)
- Data Table on APAC - Year-over-year growth 2024-2029 (%)
- 14.4 Europe - Market size and forecast 2024-2029
- Chart on Europe - Market size and forecast 2024-2029 ($ million)
- Data Table on Europe - Market size and forecast 2024-2029 ($ million)
- Chart on Europe - Year-over-year growth 2024-2029 (%)
- Data Table on Europe - Year-over-year growth 2024-2029 (%)
- 14.5 North America - Market size and forecast 2024-2029
- Chart on North America - Market size and forecast 2024-2029 ($ million)
- Data Table on North America - Market size and forecast 2024-2029 ($ million)
- Chart on North America - Year-over-year growth 2024-2029 (%)
- Data Table on North America - Year-over-year growth 2024-2029 (%)
- 14.6 Middle East and Africa - Market size and forecast 2024-2029
- Chart on Middle East and Africa - Market size and forecast 2024-2029 ($ million)
- Data Table on Middle East and Africa - Market size and forecast 2024-2029 ($ million)
- Chart on Middle East and Africa - Year-over-year growth 2024-2029 (%)
- Data Table on Middle East and Africa - Year-over-year growth 2024-2029 (%)
- 14.7 South America - Market size and forecast 2024-2029
- Chart on South America - Market size and forecast 2024-2029 ($ million)
- Data Table on South America - Market size and forecast 2024-2029 ($ million)
- Chart on South America - Year-over-year growth 2024-2029 (%)
- Data Table on South America - Year-over-year growth 2024-2029 (%)
- 14.8 US - Market size and forecast 2024-2029
- Chart on US - Market size and forecast 2024-2029 ($ million)
- Data Table on US - Market size and forecast 2024-2029 ($ million)
- Chart on US - Year-over-year growth 2024-2029 (%)
- Data Table on US - Year-over-year growth 2024-2029 (%)
- 14.9 China - Market size and forecast 2024-2029
- Chart on China - Market size and forecast 2024-2029 ($ million)
- Data Table on China - Market size and forecast 2024-2029 ($ million)
- Chart on China - Year-over-year growth 2024-2029 (%)
- Data Table on China - Year-over-year growth 2024-2029 (%)
- 14.10 Germany - Market size and forecast 2024-2029
- Chart on Germany - Market size and forecast 2024-2029 ($ million)
- Data Table on Germany - Market size and forecast 2024-2029 ($ million)
- Chart on Germany - Year-over-year growth 2024-2029 (%)
- Data Table on Germany - Year-over-year growth 2024-2029 (%)
- 14.11 Japan - Market size and forecast 2024-2029
- Chart on Japan - Market size and forecast 2024-2029 ($ million)
- Data Table on Japan - Market size and forecast 2024-2029 ($ million)
- Chart on Japan - Year-over-year growth 2024-2029 (%)
- Data Table on Japan - Year-over-year growth 2024-2029 (%)
- 14.12 India - Market size and forecast 2024-2029
- Chart on India - Market size and forecast 2024-2029 ($ million)
- Data Table on India - Market size and forecast 2024-2029 ($ million)
- Chart on India - Year-over-year growth 2024-2029 (%)
- Data Table on India - Year-over-year growth 2024-2029 (%)
- 14.13 UK - Market size and forecast 2024-2029
- Chart on UK - Market size and forecast 2024-2029 ($ million)
- Data Table on UK - Market size and forecast 2024-2029 ($ million)
- Chart on UK - Year-over-year growth 2024-2029 (%)
- Data Table on UK - Year-over-year growth 2024-2029 (%)
- 14.14 South Korea - Market size and forecast 2024-2029
- Chart on South Korea - Market size and forecast 2024-2029 ($ million)
- Data Table on South Korea - Market size and forecast 2024-2029 ($ million)
- Chart on South Korea - Year-over-year growth 2024-2029 (%)
- Data Table on South Korea - Year-over-year growth 2024-2029 (%)
- 14.15 France - Market size and forecast 2024-2029
- Chart on France - Market size and forecast 2024-2029 ($ million)
- Data Table on France - Market size and forecast 2024-2029 ($ million)
- Chart on France - Year-over-year growth 2024-2029 (%)
- Data Table on France - Year-over-year growth 2024-2029 (%)
- 14.16 Italy - Market size and forecast 2024-2029
- Chart on Italy - Market size and forecast 2024-2029 ($ million)
- Data Table on Italy - Market size and forecast 2024-2029 ($ million)
- Chart on Italy - Year-over-year growth 2024-2029 (%)
- Data Table on Italy - Year-over-year growth 2024-2029 (%)
- 14.17 Canada - Market size and forecast 2024-2029
- Chart on Canada - Market size and forecast 2024-2029 ($ million)
- Data Table on Canada - Market size and forecast 2024-2029 ($ million)
- Chart on Canada - Year-over-year growth 2024-2029 (%)
- Data Table on Canada - Year-over-year growth 2024-2029 (%)
- 14.18 Market opportunity by geography
- Market opportunity by geography ($ million)
- Data Tables on Market opportunity by geography ($ million)
- 14.19 Brazil - Market size and forecast (2024-2029)
- Chart on Brazil - Market size and forecast (2024-2029) ($ million)
- Data Table on Brazil - Market size and forecast (2024-2029) ($ million)
- Chart on Brazil - Year-over-year growth (2024-2029) (%)
- Data Table on Brazil - Year-over-year growth (2024-2029) (%)
- 14.20 UAE - Market size and forecast (2024-2029)
- Chart on UAE - Market size and forecast (2024-2029) ($ million)
- Data Table on UAE - Market size and forecast (2024-2029) ($ million)
- Chart on UAE - Year-over-year growth (2024-2029) (%)
- Data Table on UAE - Year-over-year growth (2024-2029) (%)
- 14.21 Spain - Market size and forecast (2024-2029)
- Chart on Spain - Market size and forecast (2024-2029) ($ million)
- Data Table on Spain - Market size and forecast (2024-2029) ($ million)
- Chart on Spain - Year-over-year growth (2024-2029) (%)
- Data Table on Spain - Year-over-year growth (2024-2029) (%)
- 14.22 Mexico - Market size and forecast (2024-2029)
- Chart on Mexico - Market size and forecast (2024-2029) ($ million)
- Data Table on Mexico - Market size and forecast (2024-2029) ($ million)
- Chart on Mexico - Year-over-year growth (2024-2029) (%)
- Data Table on Mexico - Year-over-year growth (2024-2029) (%)
- 14.23 Rest of World (ROW) - Market size and forecast (2024-2029)
- Chart on Rest of World (ROW) - Market size and forecast (2024-2029) ($ million)
- Data Table on Rest of World (ROW) - Market size and forecast (2024-2029) ($ million)
- Chart on Rest of World (ROW) - Year-over-year growth (2024-2029) (%)
- Data Table on Rest of World (ROW) - Year-over-year growth (2024-2029) (%)
15 Drivers, Challenges, and Opportunity/Restraints
- 15.3 Impact of drivers and challenges
- Impact of drivers and challenges in 2024 and 2029
- 15.4 Market opportunities/restraints
16 Competitive Landscape
- 16.2 Competitive Landscape
- Overview on criticality of inputs and factors of differentiation
- 16.3 Landscape disruption
- Overview on factors of disruption
- 16.4 Industry risks
- Impact of key risks on business
17 Competitive Analysis
- 17.2 Market positioning of companies
- Matrix on companies position and classification
- 17.3 HARIBO GmbH & Co. KG
- HARIBO GmbH & Co. KG - Overview
- HARIBO GmbH & Co. KG - Product / Service
- HARIBO GmbH & Co. KG - Key offerings
- 17.4 Mondelez International Inc.
- Mondelez International Inc. - Overview
- Mondelez International Inc. - Product / Service
- Mondelez International Inc. - Key offerings
- 17.5 Nestlé S.A.
- Nestlé S.A. - Overview
- Nestlé S.A. - Product / Service
- Nestlé S.A. - Key offerings
- 17.6 Perfetti Van Melle Group B.V.
- Perfetti Van Melle Group B.V. - Overview
- Perfetti Van Melle Group B.V. - Product / Service
- Perfetti Van Melle Group B.V. - Key offerings
- 17.7 Mars Incorporated
- Mars Incorporated - Overview
- Mars Incorporated - Product / Service
- Mars Incorporated - Key offerings
- 17.8 Cloetta AB
- Cloetta AB - Overview
- Cloetta AB - Product / Service
- Cloetta AB - Key offerings
- 17.9 Katjes International GmbH
- Katjes International GmbH - Overview
- Katjes International GmbH - Product / Service
- Katjes International GmbH - Key offerings
- 17.10 August Storck KG
- August Storck KG - Overview
- August Storck KG - Product / Service
- August Storck KG - Key offerings
- 17.11 Gustaf’s Licorice
- Gustaf’s Licorice - Overview
- Gustaf’s Licorice - Product / Service
- Gustaf’s Licorice - Key offerings
- 17.12 Ricola Group Ltd.
- Ricola Group Ltd. - Overview
- Ricola Group Ltd. - Product / Service
- Ricola Group Ltd. - Key offerings
- 17.13 Yildiz Holding A.S.
- Yildiz Holding A.S. - Overview
- Yildiz Holding A.S. - Product / Service
- Yildiz Holding A.S. - Key offerings
- 17.14 Hershey Company
- Hershey Company - Overview
- Hershey Company - Product / Service
- Hershey Company - Key offerings
- 17.15 Ferrara Candy Company
- Ferrara Candy Company - Overview
- Ferrara Candy Company - Product / Service
- Ferrara Candy Company - Key offerings
- 17.16 Switzer’s Licorice
- Switzer’s Licorice - Overview
- Switzer’s Licorice - Product / Service
- Switzer’s Licorice - Key offerings
- 17.17 RJ’s Licorice Ltd.
- RJ’s Licorice Ltd. - Overview
- RJ’s Licorice Ltd. - Product / Service
- RJ’s Licorice Ltd. - Key offerings
- 17.18 Toms Group A/S
- Toms Group A/S - Overview
- Toms Group A/S - Product / Service
- Toms Group A/S - Key offerings
- 17.19 Lakrids by Bülow
- Lakrids by Bülow - Overview
- Lakrids by Bülow - Product / Service
- Lakrids by Bülow - Key offerings
- 17.20 Darrell Lea Confectionery Co. Pty Ltd
- Darrell Lea Confectionery Co. Pty Ltd - Overview
- Darrell Lea Confectionery Co. Pty Ltd - Product / Service
- Darrell Lea Confectionery Co. Pty Ltd - Key offerings
- 17.21 Amarelli Fabbrica di Liquirizia
- Amarelli Fabbrica di Liquirizia - Overview
- Amarelli Fabbrica di Liquirizia - Product / Service
- Amarelli Fabbrica di Liquirizia - Key offerings
- 17.22 Panda Licorice
- Panda Licorice - Overview
- Panda Licorice - Product / Service
- Panda Licorice - Key offerings
- 17.23 HARIBO GmbH & Co. KG (Germany)
- HARIBO GmbH & Co. KG (Germany) - Overview
- HARIBO GmbH & Co. KG (Germany) - Product / Service
- HARIBO GmbH & Co. KG (Germany) - Key offerings
- 17.24 Mondelez International Inc. (United States)
- Mondelez International Inc. (United States) - Overview
- Mondelez International Inc. (United States) - Product / Service
- Mondelez International Inc. (United States) - Key offerings
- 17.25 Nestlé S.A. (Switzerland)
- Nestlé S.A. (Switzerland) - Overview
- Nestlé S.A. (Switzerland) - Product / Service
- Nestlé S.A. (Switzerland) - Key offerings
- 17.26 Perfetti Van Melle Group B.V. (Netherlands)
- Perfetti Van Melle Group B.V. (Netherlands) - Overview
- Perfetti Van Melle Group B.V. (Netherlands) - Product / Service
- Perfetti Van Melle Group B.V. (Netherlands) - Key offerings
- 17.27 Mars Incorporated (United States)
- Mars Incorporated (United States) - Overview
- Mars Incorporated (United States) - Product / Service
- Mars Incorporated (United States) - Key offerings
- 17.28 Cloetta AB (Sweden)
- Cloetta AB (Sweden) - Overview
- Cloetta AB (Sweden) - Product / Service
- Cloetta AB (Sweden) - Key offerings
- 17.29 Katjes International GmbH (Germany)
- Katjes International GmbH (Germany) - Overview
- Katjes International GmbH (Germany) - Product / Service
- Katjes International GmbH (Germany) - Key offerings
- 17.30 August Storck KG (Germany)
- August Storck KG (Germany) - Overview
- August Storck KG (Germany) - Product / Service
- August Storck KG (Germany) - Key offerings
- 17.31 Gustaf’s Licorice (Netherlands)
- Gustaf’s Licorice (Netherlands) - Overview
- Gustaf’s Licorice (Netherlands) - Product / Service
- Gustaf’s Licorice (Netherlands) - Key offerings
- 17.32 Ricola Group Ltd. (Switzerland)
- Ricola Group Ltd. (Switzerland) - Overview
- Ricola Group Ltd. (Switzerland) - Product / Service
- Ricola Group Ltd. (Switzerland) - Key offerings
- 17.33 Yildiz Holding A.S. (Turkey)
- Yildiz Holding A.S. (Turkey) - Overview
- Yildiz Holding A.S. (Turkey) - Product / Service
- Yildiz Holding A.S. (Turkey) - Key offerings
- 17.34 Hershey Company (United States)
- Hershey Company (United States) - Overview
- Hershey Company (United States) - Product / Service
- Hershey Company (United States) - Key offerings
- 17.35 Ferrara Candy Company (United States)
- Ferrara Candy Company (United States) - Overview
- Ferrara Candy Company (United States) - Product / Service
- Ferrara Candy Company (United States) - Key offerings
- 17.36 Switzer’s Licorice (United States)
- Switzer’s Licorice (United States) - Overview
- Switzer’s Licorice (United States) - Product / Service
- Switzer’s Licorice (United States) - Key offerings
- 17.37 RJ’s Licorice Ltd. (New Zealand)
- RJ’s Licorice Ltd. (New Zealand) - Overview
- RJ’s Licorice Ltd. (New Zealand) - Product / Service
- RJ’s Licorice Ltd. (New Zealand) - Key offerings
- 17.38 Toms Group A/S (Denmark)
- Toms Group A/S (Denmark) - Overview
- Toms Group A/S (Denmark) - Product / Service
- Toms Group A/S (Denmark) - Key offerings
- 17.39 Lakrids by Bülow (Denmark)
- Lakrids by Bülow (Denmark) - Overview
- Lakrids by Bülow (Denmark) - Product / Service
- Lakrids by Bülow (Denmark) - Key offerings
- 17.40 Darrell Lea Confectionery Co. Pty Ltd (Australia)
- Darrell Lea Confectionery Co. Pty Ltd (Australia) - Overview
- Darrell Lea Confectionery Co. Pty Ltd (Australia) - Product / Service
- Darrell Lea Confectionery Co. Pty Ltd (Australia) - Key offerings
- 17.41 Amarelli Fabbrica di Liquirizia (Italy)
- Amarelli Fabbrica di Liquirizia (Italy) - Overview
- Amarelli Fabbrica di Liquirizia (Italy) - Product / Service
- Amarelli Fabbrica di Liquirizia (Italy) - Key offerings
- 17.42 Panda Licorice (Finland)
- Panda Licorice (Finland) - Overview
- Panda Licorice (Finland) - Product / Service
- Panda Licorice (Finland) - Key offerings
18 Appendix
- 18.2 Inclusions and exclusions checklist
- Inclusions checklist
- Exclusions checklist
- 18.3 Currency conversion rates for US$
- Currency conversion rates for US$
- 18.4 Research methodology
- 18.7 Validation techniques employed for market sizing
- Validation techniques employed for market sizing
- 18.9 360 degree market analysis
- 360 degree market analysis
- 18.10 List of abbreviations