Low And Medium Voltage Switchgear Market Analysis, Size, and Forecast 2026-2030: APAC (China, India, and Japan), Europe (Germany, UK, and France), North America (US, Canada, and Mexico), Middle East and Africa (Saudi Arabia, UAE, and South Africa), South America (Brazil, Argentina, and Chile), and Rest of World (ROW)

Low And Medium Voltage Switchgear Market Analysis, Size, and Forecast 2026-2030:
APAC (China, India, and Japan), Europe (Germany, UK, and France), North America (US, Canada, and Mexico), Middle East and Africa (Saudi Arabia, UAE, and South Africa), South America (Brazil, Argentina, and Chile), and Rest of World (ROW)

Published: Oct 2026 304 Pages SKU: IRTNTR45137

Market Overview at a Glance

$54.58 B
Market Opportunity
7.4%
CAGR 2025 - 2030
51%
APAC Growth
$70.16 B
GIS segment 2024

Low And Medium Voltage Switchgear Market Size 2026-2030

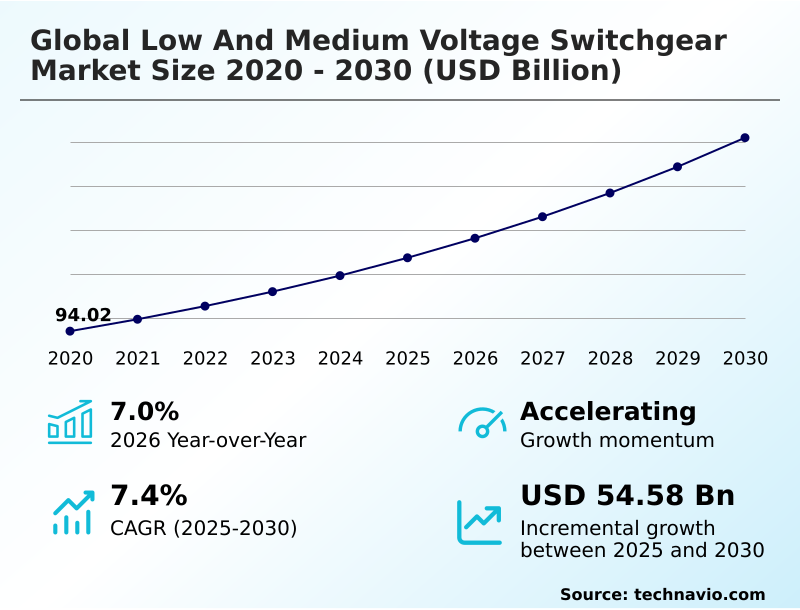
The low and medium voltage switchgear market size is valued to increase by USD 54.58 billion, at a CAGR of 7.4% from 2025 to 2030. Grid modernization and upgradation of aging infrastructure will drive the low and medium voltage switchgear market.

Major Market Trends & Insights

  • APAC dominated the market and accounted for a 51% growth during the forecast period.
  • By Type - GIS segment was valued at USD 70.16 billion in 2024
  • By Installation Sites - Indoor segment accounted for the largest market revenue share in 2024

Market Size & Forecast

  • Market Opportunities: USD 87.92 billion
  • Market Future Opportunities: USD 54.58 billion
  • CAGR from 2025 to 2030 : 7.4%

Market Summary

  • The Low And Medium Voltage Switchgear Market exhibits robust acceleration driven by the imperative to upgrade legacy power distribution networks. Utility operators face mounting pressure to integrate decentralized renewable generation sources requiring highly responsive isolation and protection mechanisms.
  • A primary driver is the modernization of aging infrastructure; grid operators replacing outdated electromechanical systems with intelligent digital nodes have documented a 40% reduction in unplanned outage durations. This modernization allows facilities to optimize load balancing and extend equipment lifecycles through continuous condition monitoring. Conversely manufacturers confront significant challenges stemming from raw material supply chain volatility and aggressive price competition.
  • Fluctuating costs for copper and semiconductor components frequently erode profit margins forcing companies to balance rigorous cost controls with essential research investments. In a practical supply chain optimization scenario industrial manufacturers are increasingly diversifying supplier networks and localizing component sourcing to mitigate extended lead times.
  • The shift toward sustainable SF6-free insulation mediums further necessitates substantial capital realignments to meet stringent new environmental compliance standards across heavy industrial and utility sectors.

What will be the Size of the Low And Medium Voltage Switchgear Market during the forecast period?
Get Key Insights on Market Forecast (PDF) Get Free Sample

How is the Low And Medium Voltage Switchgear Market Segmented?

The low and medium voltage switchgear industry research report provides comprehensive data (region-wise segment analysis), with forecasts and estimates in "USD million" for the period 2026-2030, as well as historical data from 2020-2024 for the following segments.

  • Type
    • GIS
    • AIS
  • Installation sites
    • Indoor
    • Outdoor
  • Component
    • Circuit breaker
    • Bus bars and switches
    • Relays
    • Others
  • Geography
    • APAC
      • China
      • India
      • Japan
      • South Korea
      • Australia
      • Singapore
    • Europe
      • Germany
      • UK
      • France
      • Italy
      • Spain
      • The Netherlands
    • North America
      • US
      • Canada
      • Mexico
    • Middle East and Africa
      • Saudi Arabia
      • UAE
      • South Africa
      • Turkey
      • Egypt
    • South America
      • Brazil
      • Argentina
      • Chile

By Type Insights

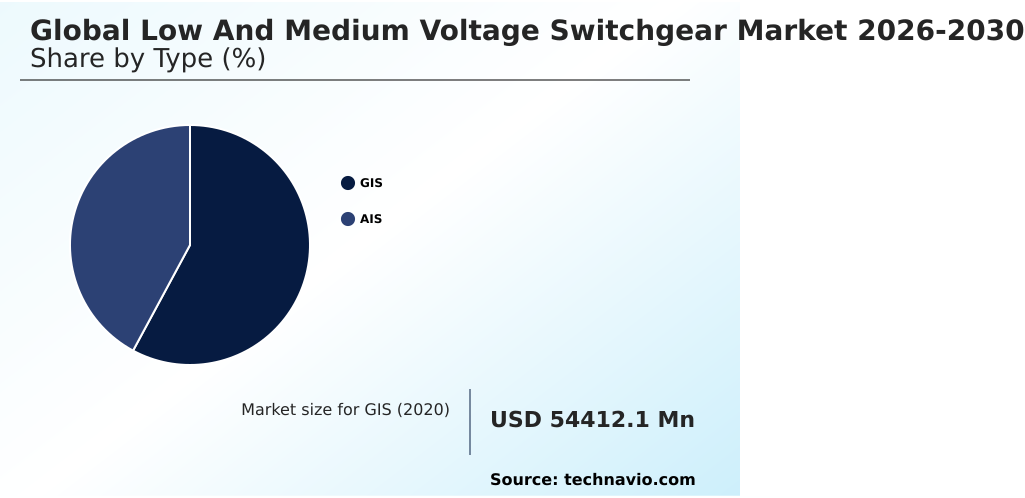
The gis segment is estimated to witness significant growth during the forecast period.

The gas insulated switchgear segment fundamentally redefines spatial utilization in densely constrained urban and industrial environments by employing compressed dielectric media rather than ambient air.

This technological shift enables a compact modular form factor that reduces the physical footprint of substations by up to 75% compared to conventional alternatives.

The integration of solid dielectric insulation and vacuum arc quenching within fully sealed metal clad enclosures provides exceptional resilience against external contaminants, significantly extending the operational lifecycle.

These systems rely on the iec 61850 communication protocol for seamless data exchange between load break switches, motor control centers, and protective devices.

By incorporating advanced thermal stress management and high current bus duct systems, facilities achieve superior continuous current handling capabilities. This architectural evolution not only accelerates deployment but inherently minimizes long-term maintenance expenditures across complex power distribution networks.
Get Free Sample

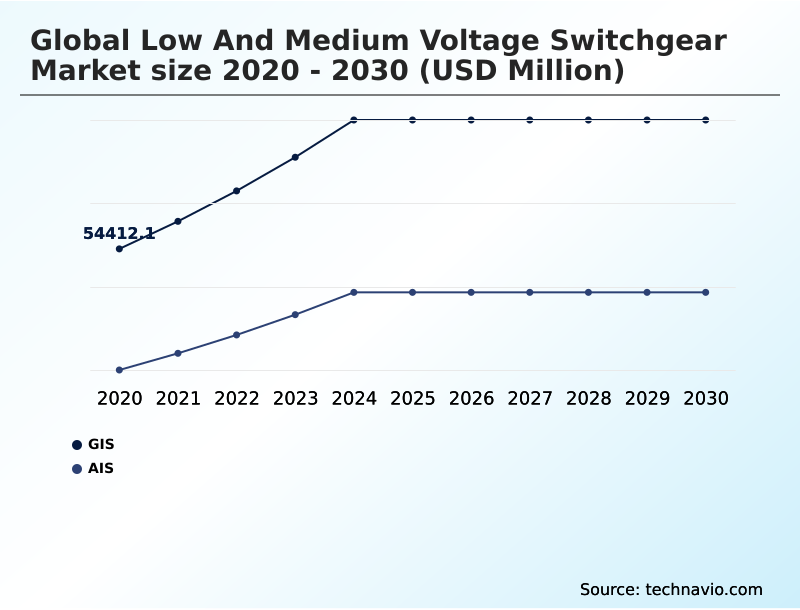
The GIS segment was valued at USD 70.16 billion in 2024 and showed a gradual increase during the forecast period.
Get Free Sample

Regional Analysis

APAC is estimated to contribute 51% to the growth of the global market during the forecast period.Technavio’s analysts have elaborately explained the regional trends and drivers that shape the market during the forecast period.
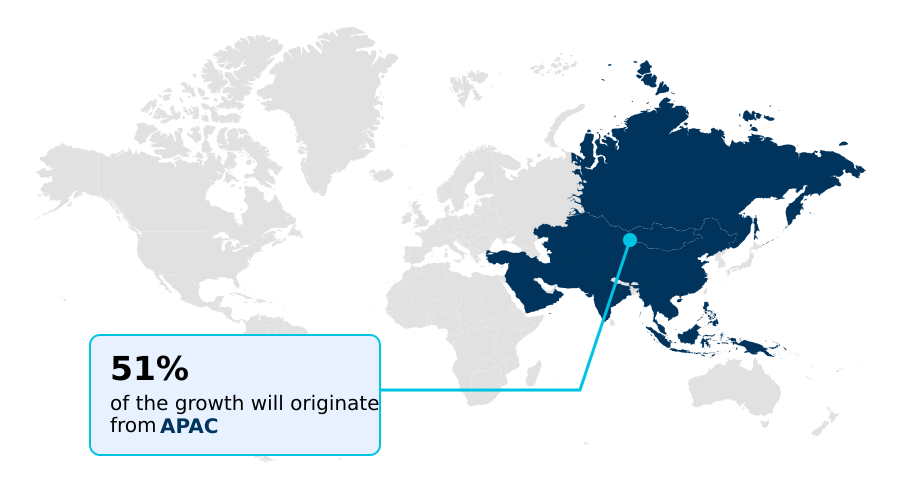
See How Low And Medium Voltage Switchgear Market Demand is Rising in APAC Get Free Sample

The geographic landscape of the Low And Medium Voltage Switchgear reveals distinct adoption disparities between the Asia Pacific and European regions.

APAC demonstrates an aggressive 51% incremental expansion rate driven heavily by rapid industrialization and the massive scale of distributed energy resource integration across emerging urban centers.

In contrast Europe prioritizes strict environmental compliance leading to a 30% higher penetration rate of sf6 free clean air insulation technologies compared to Asian markets.

This regional divergence dictates localized supply chain strategies; European utilities invest heavily in intelligent electronic devices equipped with advanced remote diagnostic telemetry to optimize aging grids while APAC operators focus on high-capacity dead tank vacuum breaker installations for new infrastructure.

Furthermore the deployment of fiber optic current sensors within weatherproof ruggedized enclosures has reduced installation footprints by 20% in space-constrained Asian megacities highlighting how differing regulatory and spatial realities shape technical procurement.

Market Dynamics

Our researchers analyzed the data with 2025 as the base year, along with the key drivers, trends, and challenges. A holistic analysis of drivers will help companies refine their marketing strategies to gain a competitive advantage.

  • The architectural complexity of modern power distribution networks requires highly specialized equipment to ensure operational continuity and personnel safety. Facilities are increasingly prioritizing arc flash mitigation safety protocols to protect workers from catastrophic electrical faults driving the adoption of metal clad indoor distribution enclosures that contain and redirect hazardous energy.
  • Concurrently strict environmental regulations mandate the transition toward sf6 free clean air insulation forcing operators to evaluate vacuum arc quenching medium voltage solutions that deliver equivalent dielectric performance without the severe global warming impact. Integrating renewable generation introduces distinct technical hurdles. Effective bidirectional power flow microgrid integration is essential for maintaining stability when managing decentralized inputs.
  • This is particularly evident in offshore wind collector substation integration where extreme environmental conditions demand weatherproof outdoor substation structural enclosures and precise fiber optic digital instrument transformers for accurate measurement. Similarly battery energy storage switchgear connections require robust high current thermal stress management to handle rapid charge and discharge cycles without degrading conductive materials.
  • In comparison to legacy electromechanical systems modern digital substations exhibit a 45% faster fault isolation response. Achieving this requires seamless iec 61850 digital substation interoperability ensuring components communicate flawlessly. Advanced overcurrent differential protective relay logic provides precise fault detection while predictive maintenance condition monitoring systems analyze real-time data to prevent unexpected failures.
  • As these networks become increasingly interconnected deploying post quantum cryptography relay security is vital to safeguard critical infrastructure against sophisticated cyber threats. Compact gas insulated switchgear footprints remain highly favored in urban applications balancing the need for distributed energy resource grid synchronization with severe spatial limitations.
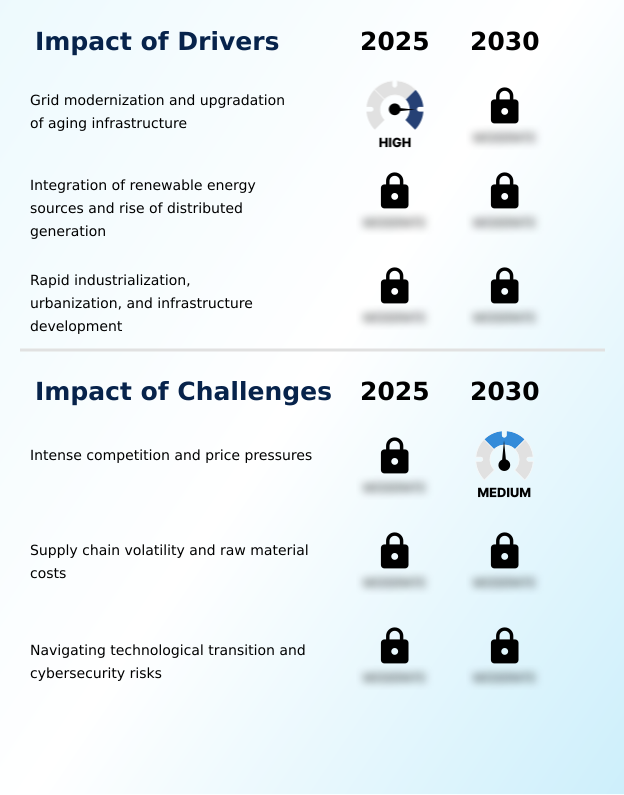
What are the key market drivers leading to the rise in the adoption of Low And Medium Voltage Switchgear Industry?

  • The urgent necessity for grid modernization and the systematic upgrading of aging electrical infrastructure serve as the primary drivers propelling market expansion.

  • The rapid expansion of decentralized renewable energy networks serves as the primary catalyst for modernizing the Low And Medium Voltage Switchgear.
  • The necessity for seamless distributed energy resource integration demands highly responsive air insulated switchgear capable of sophisticated bidirectional power flow management. Implementing precise microgrid synchronization protocols has improved overall grid resilience reducing local blackout durations by 40%.
  • Furthermore the surge in utility-scale solar and wind projects requires robust battery energy storage connection interfaces and specialized offshore wind collector substation designs.
  • Industrial automation power distribution networks are also upgrading to interconnected ring main units and substation automation systems achieving a 15% improvement in operational energy efficiency through dynamic load balancing automated control thereby driving sustained equipment investments.

What are the market trends shaping the Low And Medium Voltage Switchgear Industry?

  • Digitalization and the rise of smart switchgear represent a prevailing trend transforming power distribution networks. These advanced systems incorporate embedded sensors and communication protocols to enable predictive maintenance and real-time grid monitoring.

  • The pervasive digitalization of power infrastructure has fundamentally shifted the Low And Medium Voltage Switchgear toward highly communicative data-centric architectures. Utilities are rapidly deploying microprocessor based numerical relays alongside digital instrument transformers to enhance grid visibility and protection.
  • This technological pivot enables sophisticated condition based predictive maintenance reducing equipment failure rates by 35% and extending overall asset lifespans by up to 20% compared to legacy time-based servicing models. The integration of real time power quality monitoring ensures the stability of sensitive industrial processes.
  • Furthermore to safeguard these interconnected digital assets against future cyber threats operators are embedding post quantum cryptography into network protocols. The push toward sustainability also accelerates the adoption of sulfur hexafluoride alternatives as facilities transition to clean air insulation technology to meet strict regulatory decarbonization targets without sacrificing the compact modular form factor required in dense urban substations.

What challenges does the Low And Medium Voltage Switchgear Industry face during its growth?

  • Intense market competition and aggressive price pressures constitute major challenges that significantly compress profit margins for equipment manufacturers.

  • Transitioning legacy power distribution networks to modern digital architectures introduces profound structural and supply chain constraints within the Low And Medium Voltage Switchgear. Manufacturers face critical semiconductor component lead times that have delayed project commissioning schedules by up to 25% complicating the rollout of advanced protection systems.
  • Upgrading to intelligent systems requires robust cybersecurity defense in depth to secure sensitive fault record data acquisition against external infiltration. Additionally navigating strict regulations regarding gas mixture global warming potential necessitates the complex electromechanical component replacement of aging assets. Engineering challenges remain in ensuring high integrity pressure protection and reliable short circuit current interruption while maintaining optimal dielectric breakdown strength.
  • These stringent requirements increase initial capital expenditures by approximately 15% slowing the immediate adoption of advanced overcurrent differential protection schemes.

Exclusive Technavio Analysis on Customer Landscape

The low and medium voltage switchgear market forecasting report includes the adoption lifecycle of the market, covering from the innovator’s stage to the laggard’s stage. It focuses on adoption rates in different regions based on penetration. Furthermore, the low and medium voltage switchgear market report also includes key purchase criteria and drivers of price sensitivity to help companies evaluate and develop their market growth analysis strategies.
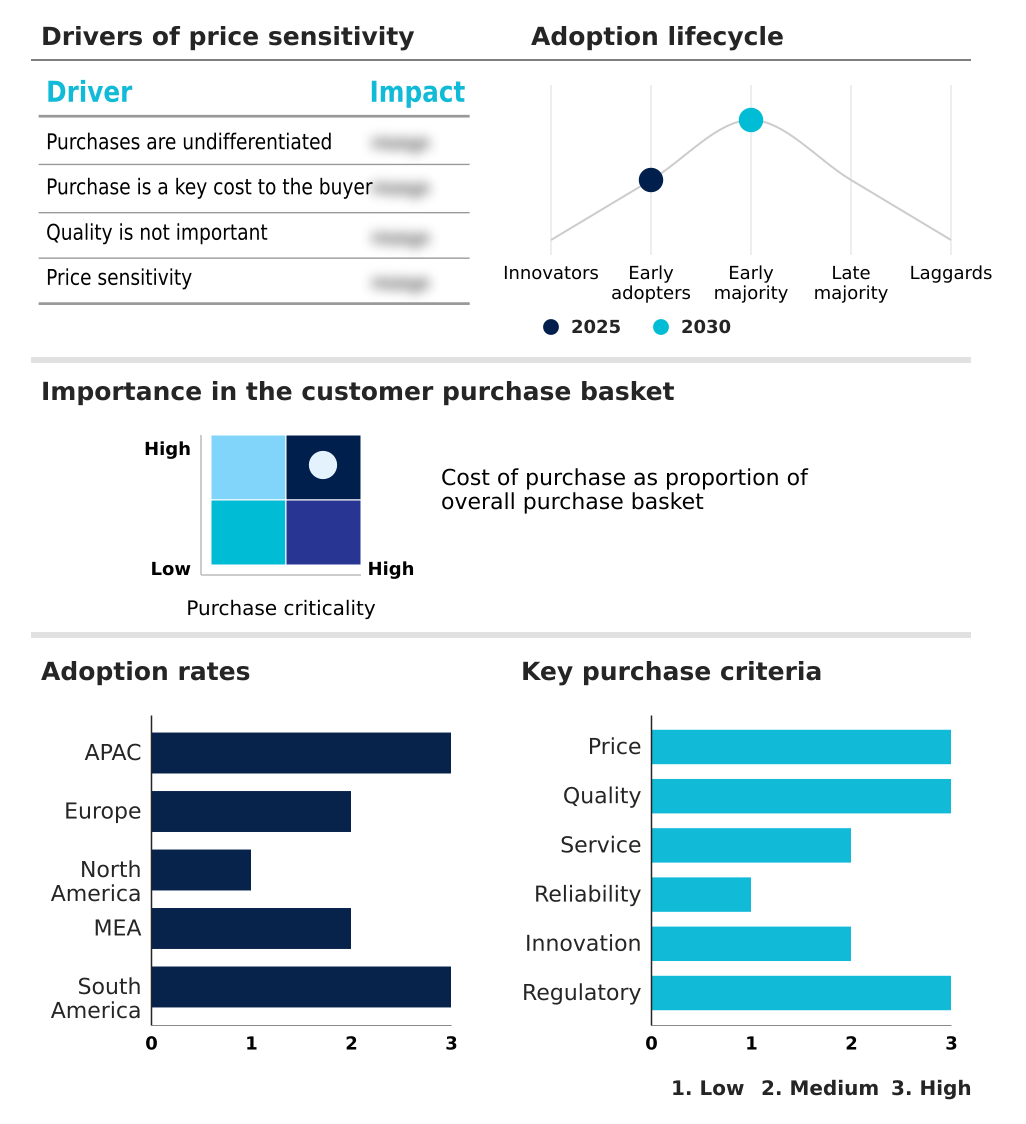
Customer Landscape of Low And Medium Voltage Switchgear Industry

Competitive Landscape

Companies are implementing various strategies, such as strategic alliances, low and medium voltage switchgear market forecast, partnerships, mergers and acquisitions, geographical expansion, and product/service launches, to enhance their presence in the industry.

ABB Ltd. - Comprehensive portfolios feature advanced low and medium voltage switchgear integrating intelligent distribution solutions and arc-resistant assemblies to ensure operational continuity and superior personnel safety across critical industrial applications.

The industry research and growth report includes detailed analyses of the competitive landscape of the market and information about key companies, including:

  • ABB Ltd.
  • Bharat Heavy Electricals Ltd.
  • CG Power and Industrial Ltd.
  • CHINT Group
  • Eaton Corp. Plc
  • Emerson Electric Co.
  • Fuji Electric Co. Ltd.
  • GE Vernova Inc.
  • HD Hyundai Electric Co. Ltd.
  • Honeywell International Inc.
  • Legrand SA
  • LS ELECTRIC Co. Ltd.
  • Lucy Electric UK Ltd.
  • Mitsubishi Electric Corp.
  • Ormazabal
  • Powell Industries Inc.
  • Rockwell Automation Inc.
  • Schneider Electric SE
  • Toshiba Corp.
  • WEG S.A

Qualitative and quantitative analysis of companies has been conducted to help clients understand the wider business environment as well as the strengths and weaknesses of key industry players. Data is qualitatively analyzed to categorize companies as pure play, category-focused, industry-focused, and diversified; it is quantitatively analyzed to categorize companies as dominant, leading, strong, tentative, and weak.

Recent Development and News in Low and medium voltage switchgear market

  • In the Electrical Components and Equipment industry the transition toward decentralized microgrids has required advanced smart grid interoperability directly impacting Low And Medium Voltage Switchgear demand by mandating equipment capable of real-time bidirectional power flow management.
  • The widespread implementation of stringent environmental regulations targeting sulfur hexafluoride alternatives has accelerated the commercialization of clean air insulation technology forcing rapid redesigns of medium voltage distribution equipment to meet new global warming potential thresholds.
  • Severe semiconductor component lead times and raw material bottlenecks have disrupted traditional manufacturing supply chains prompting electrical component providers to redesign intelligent electronic devices with alternative microprocessors temporarily altering delivery schedules for complex distribution assemblies.
  • The rapid expansion of battery energy storage connection requirements for utility-scale solar projects has necessitated specialized high current bus duct configurations and overcurrent differential protection mechanisms increasing the deployment of heavy-duty power isolation components.

Dive into Technavio’s robust research methodology, blending expert interviews, extensive data synthesis, and validated models for unparalleled Low And Medium Voltage Switchgear Market insights. See full methodology.

Market Scope
Page number 304
Base year 2025
Historic period 2020-2024
Forecast period 2026-2030
Growth momentum & CAGR Accelerate at a CAGR of 7.4%
Market growth 2026-2030 USD 54577.1 million
Market structure Fragmented
YoY growth 2025-2026(%) 7.0%
Key countries China, India, Japan, South Korea, Australia, Singapore, Germany, UK, France, Italy, Spain, The Netherlands, US, Canada, Mexico, Saudi Arabia, UAE, South Africa, Turkey, Egypt, Brazil, Argentina and Chile
Competitive landscape Leading Companies, Market Positioning of Companies, Competitive Strategies, and Industry Risks

Request Free Sample

Research Analyst Overview

  • The continuous evolution of the Low And Medium Voltage Switchgear reflects a fundamental transition toward intelligent decentralized and environmentally sustainable power architectures. Modern grid operators are aggressively adopting microprocessor based numerical relays to achieve superior system protection and real-time monitoring capabilities.
  • This digitalization directly supports condition based predictive maintenance allowing utilities to optimize asset lifecycles and reduce unplanned maintenance downtime by an average of 28% compared to traditional reactive schedules. The integration of digital instrument transformers further enhances measurement accuracy and safety by eliminating hazardous high-voltage signals within control panels.
  • As facilities prioritize decarbonization the strategic shift toward sulfur hexafluoride alternatives represents a critical boardroom-level compliance objective fundamentally altering procurement strategies. Engineers are increasingly specifying clean air insulation technology to meet stringent greenhouse gas reduction targets without compromising electrical performance.
  • Furthermore the deployment of robust post quantum cryptography within substation communication networks has become essential to secure critical power infrastructure against advanced digital vulnerabilities ensuring uninterrupted real time power quality monitoring across increasingly complex distribution environments.

What are the Key Data Covered in this Low And Medium Voltage Switchgear Market Research and Growth Report?

  • What is the expected growth of the Low And Medium Voltage Switchgear Market between 2026 and 2030?

    • USD 54.58 billion, at a CAGR of 7.4%

  • What segmentation does the market report cover?

    • The report is segmented by Type (GIS, and AIS), Installation Sites (Indoor, and Outdoor), Component (Circuit breaker, Bus bars and switches, Relays, and Others) and Geography (APAC, Europe, North America, Middle East and Africa, South America)

  • Which regions are analyzed in the report?

    • APAC, Europe, North America, Middle East and Africa and South America

  • What are the key growth drivers and market challenges?

    • Grid modernization and upgradation of aging infrastructure, Intense competition and price pressures

  • Who are the major players in the Low And Medium Voltage Switchgear Market?

    • ABB Ltd., Bharat Heavy Electricals Ltd., CG Power and Industrial Ltd., CHINT Group, Eaton Corp. Plc, Emerson Electric Co., Fuji Electric Co. Ltd., GE Vernova Inc., HD Hyundai Electric Co. Ltd., Honeywell International Inc., Legrand SA, LS ELECTRIC Co. Ltd., Lucy Electric UK Ltd., Mitsubishi Electric Corp., Ormazabal, Powell Industries Inc., Rockwell Automation Inc., Schneider Electric SE, Toshiba Corp. and WEG S.A

Market Research Insights

  • The Low And Medium Voltage Switchgear Market is undergoing a rapid technological evolution centered on intelligent power distribution and operational reliability. Facilities upgrading to digital switchgear architectures observe a 35% improvement in fault record data acquisition speed dramatically reducing diagnostic timelines.
  • The integration of advanced remote diagnostic telemetry enables operators to transition from reactive to predictive maintenance strategies yielding up to a 25% decrease in routine maintenance expenditures. Furthermore the deployment of smart grid interoperability protocols ensures seamless communication across substations enhancing system responsiveness.
  • Implementing robust cybersecurity defense in depth has become critical for protecting these interconnected assets as utilities prioritize secure network integration to safeguard critical infrastructure against emerging digital threats.

We can help! Our analysts can customize this low and medium voltage switchgear market research report to meet your requirements.

Get in touch

1. Executive Summary

1.1 Market overview

Executive Summary - Chart on Market Overview
Executive Summary - Data Table on Market Overview
Executive Summary - Chart on Global Market Characteristics
Executive Summary - Chart on Market by Geography
Executive Summary - Chart on Market Segmentation by Type
Executive Summary - Chart on Market Segmentation by Installation Sites
Executive Summary - Chart on Market Segmentation by Component
Executive Summary - Chart on Incremental Growth
Executive Summary - Data Table on Incremental Growth
Executive Summary - Chart on Company Market Positioning

2. Technavio Analysis

2.1 Analysis of price sensitivity, lifecycle, customer purchase basket, adoption rates, and purchase criteria

2.2 Criticality of inputs and Factors of differentiation

Chart on Overview on criticality of inputs and factors of differentiation

2.3 Factors of disruption

Chart on Overview on factors of disruption

2.4 Impact of drivers and challenges

Chart on Impact of drivers and challenges in 2025 and 2030

3. Market Landscape

3.1 Market ecosystem

Chart on Parent Market
Data Table on - Parent Market

3.2 Market characteristics

Chart on Market characteristics analysis

3.3 Value chain analysis

Chart on Value chain analysis

4. Market Sizing

4.1 Market definition

Data Table on Offerings of companies included in the market definition

4.2 Market segment analysis

Market segments

4.3 Market size 2025

4.4 Market outlook: Forecast for 2025-2030

Chart on Global - Market size and forecast 2025-2030 ($ million)
Data Table on Global - Market size and forecast 2025-2030 ($ million)
Chart on Global Market: Year-over-year growth 2025-2030 (%)
Data Table on Global Market: Year-over-year growth 2025-2030 (%)

5. Historic Market Size

5.1 Global Low And Medium Voltage Switchgear Market 2020 - 2024

Historic Market Size - Data Table on Global Low And Medium Voltage Switchgear Market 2020 - 2024 ($ million)

5.2 Type segment analysis 2020 - 2024

Historic Market Size - Type Segment 2020 - 2024 ($ million)

5.3 Installation Sites segment analysis 2020 - 2024

Historic Market Size - Installation Sites Segment 2020 - 2024 ($ million)

5.4 Component segment analysis 2020 - 2024

Historic Market Size - Component Segment 2020 - 2024 ($ million)

5.5 Geography segment analysis 2020 - 2024

Historic Market Size - Geography Segment 2020 - 2024 ($ million)

5.6 Country segment analysis 2020 - 2024

Historic Market Size - Country Segment 2020 - 2024 ($ million)

6. Qualitative Analysis

6.1 Impact of AI on Global Low and Medium Voltage Switchgear Market

6.2 Impact of Geopolitical Conflicts on Global Low and Medium Voltage Switchgear Market

7. Five Forces Analysis

7.1 Five forces summary

Five forces analysis - Comparison between 2025 and 2030

7.2 Bargaining power of buyers

Bargaining power of buyers - Impact of key factors 2025 and 2030

7.3 Bargaining power of suppliers

Bargaining power of suppliers - Impact of key factors in 2025 and 2030

7.4 Threat of new entrants

Threat of new entrants - Impact of key factors in 2025 and 2030

7.5 Threat of substitutes

Threat of substitutes - Impact of key factors in 2025 and 2030

7.6 Threat of rivalry

Threat of rivalry - Impact of key factors in 2025 and 2030

7.7 Market condition

Chart on Market condition - Five forces 2025 and 2030

8. Market Segmentation by Type

8.1 Market segments

Chart on Type - Market share 2025-2030 (%)
Data Table on Type - Market share 2025-2030 (%)

8.2 Comparison by Type

Chart on Comparison by Type
Data Table on Comparison by Type

8.3 GIS - Market size and forecast 2025-2030

Chart on GIS - Market size and forecast 2025-2030 ($ million)
Data Table on GIS - Market size and forecast 2025-2030 ($ million)
Chart on GIS - Year-over-year growth 2025-2030 (%)
Data Table on GIS - Year-over-year growth 2025-2030 (%)

8.4 AIS - Market size and forecast 2025-2030

Chart on AIS - Market size and forecast 2025-2030 ($ million)
Data Table on AIS - Market size and forecast 2025-2030 ($ million)
Chart on AIS - Year-over-year growth 2025-2030 (%)
Data Table on AIS - Year-over-year growth 2025-2030 (%)

8.5 Market opportunity by Type

Market opportunity by Type ($ million)
Data Table on Market opportunity by Type ($ million)

9. Market Segmentation by Installation Sites

9.1 Market segments

Chart on Installation Sites - Market share 2025-2030 (%)
Data Table on Installation Sites - Market share 2025-2030 (%)

9.2 Comparison by Installation Sites

Chart on Comparison by Installation Sites
Data Table on Comparison by Installation Sites

9.3 Indoor - Market size and forecast 2025-2030

Chart on Indoor - Market size and forecast 2025-2030 ($ million)
Data Table on Indoor - Market size and forecast 2025-2030 ($ million)
Chart on Indoor - Year-over-year growth 2025-2030 (%)
Data Table on Indoor - Year-over-year growth 2025-2030 (%)

9.4 Outdoor - Market size and forecast 2025-2030

Chart on Outdoor - Market size and forecast 2025-2030 ($ million)
Data Table on Outdoor - Market size and forecast 2025-2030 ($ million)
Chart on Outdoor - Year-over-year growth 2025-2030 (%)
Data Table on Outdoor - Year-over-year growth 2025-2030 (%)

9.5 Market opportunity by Installation Sites

Market opportunity by Installation Sites ($ million)
Data Table on Market opportunity by Installation Sites ($ million)

10. Market Segmentation by Component

10.1 Market segments

Chart on Component - Market share 2025-2030 (%)
Data Table on Component - Market share 2025-2030 (%)

10.2 Comparison by Component

Chart on Comparison by Component
Data Table on Comparison by Component

10.3 Circuit breaker - Market size and forecast 2025-2030

Chart on Circuit breaker - Market size and forecast 2025-2030 ($ million)
Data Table on Circuit breaker - Market size and forecast 2025-2030 ($ million)
Chart on Circuit breaker - Year-over-year growth 2025-2030 (%)
Data Table on Circuit breaker - Year-over-year growth 2025-2030 (%)

10.4 Bus bars and switches - Market size and forecast 2025-2030

Chart on Bus bars and switches - Market size and forecast 2025-2030 ($ million)
Data Table on Bus bars and switches - Market size and forecast 2025-2030 ($ million)
Chart on Bus bars and switches - Year-over-year growth 2025-2030 (%)
Data Table on Bus bars and switches - Year-over-year growth 2025-2030 (%)

10.5 Relays - Market size and forecast 2025-2030

Chart on Relays - Market size and forecast 2025-2030 ($ million)
Data Table on Relays - Market size and forecast 2025-2030 ($ million)
Chart on Relays - Year-over-year growth 2025-2030 (%)
Data Table on Relays - Year-over-year growth 2025-2030 (%)

10.6 Others - Market size and forecast 2025-2030

Chart on Others - Market size and forecast 2025-2030 ($ million)
Data Table on Others - Market size and forecast 2025-2030 ($ million)
Chart on Others - Year-over-year growth 2025-2030 (%)
Data Table on Others - Year-over-year growth 2025-2030 (%)

10.7 Market opportunity by Component

Market opportunity by Component ($ million)
Data Table on Market opportunity by Component ($ million)

11. Customer Landscape

11.1 Customer landscape overview

Analysis of price sensitivity, lifecycle, customer purchase basket, adoption rates, and purchase criteria

12. Geographic Landscape

12.1 Geographic segmentation

Chart on Market share by geography 2025-2030 (%)
Data Table on Market share by geography 2025-2030 (%)

12.2 Geographic comparison

Chart on Geographic comparison
Data Table on Geographic comparison

12.3 APAC - Market size and forecast 2025-2030

Chart on APAC - Market size and forecast 2025-2030 ($ million)
Data Table on APAC - Market size and forecast 2025-2030 ($ million)
Chart on APAC - Year-over-year growth 2025-2030 (%)
Data Table on APAC - Year-over-year growth 2025-2030 (%)
Chart on Regional Comparison - APAC
Data Table on Regional Comparison - APAC

12.3.1 China - Market size and forecast 2025-2030

Chart on China - Market size and forecast 2025-2030 ($ million)
Data Table on China - Market size and forecast 2025-2030 ($ million)
Chart on China - Year-over-year growth 2025-2030 (%)
Data Table on China - Year-over-year growth 2025-2030 (%)

12.3.2 India - Market size and forecast 2025-2030

Chart on India - Market size and forecast 2025-2030 ($ million)
Data Table on India - Market size and forecast 2025-2030 ($ million)
Chart on India - Year-over-year growth 2025-2030 (%)
Data Table on India - Year-over-year growth 2025-2030 (%)

12.3.3 Japan - Market size and forecast 2025-2030

Chart on Japan - Market size and forecast 2025-2030 ($ million)
Data Table on Japan - Market size and forecast 2025-2030 ($ million)
Chart on Japan - Year-over-year growth 2025-2030 (%)
Data Table on Japan - Year-over-year growth 2025-2030 (%)

12.3.4 South Korea - Market size and forecast 2025-2030

Chart on South Korea - Market size and forecast 2025-2030 ($ million)
Data Table on South Korea - Market size and forecast 2025-2030 ($ million)
Chart on South Korea - Year-over-year growth 2025-2030 (%)
Data Table on South Korea - Year-over-year growth 2025-2030 (%)

12.3.5 Australia - Market size and forecast 2025-2030

Chart on Australia - Market size and forecast 2025-2030 ($ million)
Data Table on Australia - Market size and forecast 2025-2030 ($ million)
Chart on Australia - Year-over-year growth 2025-2030 (%)
Data Table on Australia - Year-over-year growth 2025-2030 (%)

12.3.6 Singapore - Market size and forecast 2025-2030

Chart on Singapore - Market size and forecast 2025-2030 ($ million)
Data Table on Singapore - Market size and forecast 2025-2030 ($ million)
Chart on Singapore - Year-over-year growth 2025-2030 (%)
Data Table on Singapore - Year-over-year growth 2025-2030 (%)

12.4 Europe - Market size and forecast 2025-2030

Chart on Europe - Market size and forecast 2025-2030 ($ million)
Data Table on Europe - Market size and forecast 2025-2030 ($ million)
Chart on Europe - Year-over-year growth 2025-2030 (%)
Data Table on Europe - Year-over-year growth 2025-2030 (%)
Chart on Regional Comparison - Europe
Data Table on Regional Comparison - Europe

12.4.1 Germany - Market size and forecast 2025-2030

Chart on Germany - Market size and forecast 2025-2030 ($ million)
Data Table on Germany - Market size and forecast 2025-2030 ($ million)
Chart on Germany - Year-over-year growth 2025-2030 (%)
Data Table on Germany - Year-over-year growth 2025-2030 (%)

12.4.2 UK - Market size and forecast 2025-2030

Chart on UK - Market size and forecast 2025-2030 ($ million)
Data Table on UK - Market size and forecast 2025-2030 ($ million)
Chart on UK - Year-over-year growth 2025-2030 (%)
Data Table on UK - Year-over-year growth 2025-2030 (%)

12.4.3 France - Market size and forecast 2025-2030

Chart on France - Market size and forecast 2025-2030 ($ million)
Data Table on France - Market size and forecast 2025-2030 ($ million)
Chart on France - Year-over-year growth 2025-2030 (%)
Data Table on France - Year-over-year growth 2025-2030 (%)

12.4.4 Italy - Market size and forecast 2025-2030

Chart on Italy - Market size and forecast 2025-2030 ($ million)
Data Table on Italy - Market size and forecast 2025-2030 ($ million)
Chart on Italy - Year-over-year growth 2025-2030 (%)
Data Table on Italy - Year-over-year growth 2025-2030 (%)

12.4.5 Spain - Market size and forecast 2025-2030

Chart on Spain - Market size and forecast 2025-2030 ($ million)
Data Table on Spain - Market size and forecast 2025-2030 ($ million)
Chart on Spain - Year-over-year growth 2025-2030 (%)
Data Table on Spain - Year-over-year growth 2025-2030 (%)

12.4.6 The Netherlands - Market size and forecast 2025-2030

Chart on The Netherlands - Market size and forecast 2025-2030 ($ million)
Data Table on The Netherlands - Market size and forecast 2025-2030 ($ million)
Chart on The Netherlands - Year-over-year growth 2025-2030 (%)
Data Table on The Netherlands - Year-over-year growth 2025-2030 (%)

12.5 North America - Market size and forecast 2025-2030

Chart on North America - Market size and forecast 2025-2030 ($ million)
Data Table on North America - Market size and forecast 2025-2030 ($ million)
Chart on North America - Year-over-year growth 2025-2030 (%)
Data Table on North America - Year-over-year growth 2025-2030 (%)
Chart on Regional Comparison - North America
Data Table on Regional Comparison - North America

12.5.1 US - Market size and forecast 2025-2030

Chart on US - Market size and forecast 2025-2030 ($ million)
Data Table on US - Market size and forecast 2025-2030 ($ million)
Chart on US - Year-over-year growth 2025-2030 (%)
Data Table on US - Year-over-year growth 2025-2030 (%)

12.5.2 Canada - Market size and forecast 2025-2030

Chart on Canada - Market size and forecast 2025-2030 ($ million)
Data Table on Canada - Market size and forecast 2025-2030 ($ million)
Chart on Canada - Year-over-year growth 2025-2030 (%)
Data Table on Canada - Year-over-year growth 2025-2030 (%)

12.5.3 Mexico - Market size and forecast 2025-2030

Chart on Mexico - Market size and forecast 2025-2030 ($ million)
Data Table on Mexico - Market size and forecast 2025-2030 ($ million)
Chart on Mexico - Year-over-year growth 2025-2030 (%)
Data Table on Mexico - Year-over-year growth 2025-2030 (%)

12.6 Middle East and Africa - Market size and forecast 2025-2030

Chart on Middle East and Africa - Market size and forecast 2025-2030 ($ million)
Data Table on Middle East and Africa - Market size and forecast 2025-2030 ($ million)
Chart on Middle East and Africa - Year-over-year growth 2025-2030 (%)
Data Table on Middle East and Africa - Year-over-year growth 2025-2030 (%)
Chart on Regional Comparison - Middle East and Africa
Data Table on Regional Comparison - Middle East and Africa

12.6.1 Saudi Arabia - Market size and forecast 2025-2030

Chart on Saudi Arabia - Market size and forecast 2025-2030 ($ million)
Data Table on Saudi Arabia - Market size and forecast 2025-2030 ($ million)
Chart on Saudi Arabia - Year-over-year growth 2025-2030 (%)
Data Table on Saudi Arabia - Year-over-year growth 2025-2030 (%)

12.6.2 UAE - Market size and forecast 2025-2030

Chart on UAE - Market size and forecast 2025-2030 ($ million)
Data Table on UAE - Market size and forecast 2025-2030 ($ million)
Chart on UAE - Year-over-year growth 2025-2030 (%)
Data Table on UAE - Year-over-year growth 2025-2030 (%)

12.6.3 South Africa - Market size and forecast 2025-2030

Chart on South Africa - Market size and forecast 2025-2030 ($ million)
Data Table on South Africa - Market size and forecast 2025-2030 ($ million)
Chart on South Africa - Year-over-year growth 2025-2030 (%)
Data Table on South Africa - Year-over-year growth 2025-2030 (%)

12.6.4 Turkey - Market size and forecast 2025-2030

Chart on Turkey - Market size and forecast 2025-2030 ($ million)
Data Table on Turkey - Market size and forecast 2025-2030 ($ million)
Chart on Turkey - Year-over-year growth 2025-2030 (%)
Data Table on Turkey - Year-over-year growth 2025-2030 (%)

12.6.5 Egypt - Market size and forecast 2025-2030

Chart on Egypt - Market size and forecast 2025-2030 ($ million)
Data Table on Egypt - Market size and forecast 2025-2030 ($ million)
Chart on Egypt - Year-over-year growth 2025-2030 (%)
Data Table on Egypt - Year-over-year growth 2025-2030 (%)

12.7 South America - Market size and forecast 2025-2030

Chart on South America - Market size and forecast 2025-2030 ($ million)
Data Table on South America - Market size and forecast 2025-2030 ($ million)
Chart on South America - Year-over-year growth 2025-2030 (%)
Data Table on South America - Year-over-year growth 2025-2030 (%)
Chart on Regional Comparison - South America
Data Table on Regional Comparison - South America

12.7.1 Brazil - Market size and forecast 2025-2030

Chart on Brazil - Market size and forecast 2025-2030 ($ million)
Data Table on Brazil - Market size and forecast 2025-2030 ($ million)
Chart on Brazil - Year-over-year growth 2025-2030 (%)
Data Table on Brazil - Year-over-year growth 2025-2030 (%)

12.7.2 Argentina - Market size and forecast 2025-2030

Chart on Argentina - Market size and forecast 2025-2030 ($ million)
Data Table on Argentina - Market size and forecast 2025-2030 ($ million)
Chart on Argentina - Year-over-year growth 2025-2030 (%)
Data Table on Argentina - Year-over-year growth 2025-2030 (%)

12.7.3 Chile - Market size and forecast 2025-2030

Chart on Chile - Market size and forecast 2025-2030 ($ million)
Data Table on Chile - Market size and forecast 2025-2030 ($ million)
Chart on Chile - Year-over-year growth 2025-2030 (%)
Data Table on Chile - Year-over-year growth 2025-2030 (%)

12.8 Market opportunity by geography

Market opportunity by geography ($ million)
Data Tables on Market opportunity by geography ($ million)

13. Drivers, Challenges, and Opportunity

13.1 Market drivers

Grid modernization and upgradation of aging infrastructure
Integration of renewable energy sources and rise of distributed generation
Rapid industrialization, urbanization, and infrastructure development

13.2 Market challenges

Intense competition and price pressures
Supply chain volatility and raw material costs
Navigating technological transition and cybersecurity risks

13.3 Impact of drivers and challenges

Impact of drivers and challenges in 2025 and 2030

13.4 Market opportunities

Digitalization and rise of smart switchgear
Adoption of eco-friendly and SF6-free alternatives
Increasing demand for modular and compact switchgear

14. Competitive Landscape

14.1 Overview

14.2

Overview on criticality of inputs and factors of differentiation

14.3 Landscape disruption

Overview on factors of disruption

14.4 Industry risks

Impact of key risks on business

15. Competitive Analysis

15.1 Companies profiled

Companies covered

15.2 Company ranking index

15.3 Market positioning of companies

Matrix on companies position and classification

15.4 ABB Ltd.

ABB Ltd. - Overview
ABB Ltd. - Business segments
ABB Ltd. - Key news
ABB Ltd. - Key offerings
ABB Ltd. - Segment focus
SWOT

15.5 Bharat Heavy Electricals Ltd.

Bharat Heavy Electricals Ltd. - Overview
Bharat Heavy Electricals Ltd. - Business segments
Bharat Heavy Electricals Ltd. - Key offerings
Bharat Heavy Electricals Ltd. - Segment focus
SWOT

15.6 CG Power and Industrial Ltd.

CG Power and Industrial Ltd. - Overview
CG Power and Industrial Ltd. - Business segments
CG Power and Industrial Ltd. - Key offerings
CG Power and Industrial Ltd. - Segment focus
SWOT

15.7 Eaton Corp. Plc

Eaton Corp. Plc - Overview
Eaton Corp. Plc - Business segments
Eaton Corp. Plc - Key news
Eaton Corp. Plc - Key offerings
Eaton Corp. Plc - Segment focus
SWOT

15.8 Emerson Electric Co.

Emerson Electric Co. - Overview
Emerson Electric Co. - Business segments
Emerson Electric Co. - Key news
Emerson Electric Co. - Key offerings
Emerson Electric Co. - Segment focus
SWOT

15.9 Fuji Electric Co. Ltd.

Fuji Electric Co. Ltd. - Overview
Fuji Electric Co. Ltd. - Business segments
Fuji Electric Co. Ltd. - Key offerings
Fuji Electric Co. Ltd. - Segment focus
SWOT

15.10 HD Hyundai Electric Co. Ltd.

HD Hyundai Electric Co. Ltd. - Overview
HD Hyundai Electric Co. Ltd. - Business segments
HD Hyundai Electric Co. Ltd. - Key offerings
HD Hyundai Electric Co. Ltd. - Segment focus
SWOT

15.11 Honeywell International Inc.

Honeywell International Inc. - Overview
Honeywell International Inc. - Business segments
Honeywell International Inc. - Key news
Honeywell International Inc. - Key offerings
Honeywell International Inc. - Segment focus
SWOT

15.12 Legrand SA

Legrand SA - Overview
Legrand SA - Business segments
Legrand SA - Key news
Legrand SA - Key offerings
Legrand SA - Segment focus
SWOT

15.13 LS ELECTRIC Co. Ltd.

LS ELECTRIC Co. Ltd. - Overview
LS ELECTRIC Co. Ltd. - Business segments
LS ELECTRIC Co. Ltd. - Key offerings
LS ELECTRIC Co. Ltd. - Segment focus
SWOT

15.14 Mitsubishi Electric Corp.

Mitsubishi Electric Corp. - Overview
Mitsubishi Electric Corp. - Business segments
Mitsubishi Electric Corp. - Key offerings
Mitsubishi Electric Corp. - Segment focus
SWOT

15.15 Powell Industries Inc.

Powell Industries Inc. - Overview
Powell Industries Inc. - Product / Service
Powell Industries Inc. - Key offerings
SWOT

15.16 Rockwell Automation Inc.

Rockwell Automation Inc. - Overview
Rockwell Automation Inc. - Business segments
Rockwell Automation Inc. - Key news
Rockwell Automation Inc. - Key offerings
Rockwell Automation Inc. - Segment focus
SWOT

15.17 Schneider Electric SE

Schneider Electric SE - Overview
Schneider Electric SE - Business segments
Schneider Electric SE - Key news
Schneider Electric SE - Key offerings
Schneider Electric SE - Segment focus
SWOT

15.18 WEG S.A

WEG S.A - Overview
WEG S.A - Business segments
WEG S.A - Key offerings
WEG S.A - Segment focus
SWOT

16. Appendix

16.1 Scope of the report

Market definition
Objectives
Notes and caveats

16.2 Inclusions and exclusions checklist

Inclusions checklist
Exclusions checklist

16.3 Currency conversion rates for US$

16.4 Research methodology

16.5 Data procurement

Information sources

16.6 Data validation

16.7 Validation techniques employed for market sizing

16.8 Data synthesis

16.9 360 degree market analysis

16.10 List of abbreviations

Research Methodology

Technavio presents a detailed picture of the market by way of study, synthesis, and summation of data from multiple sources. The analysts have presented the various facets of the market with a particular focus on identifying the key industry influencers. The data thus presented is comprehensive, reliable, and the result of extensive research, both primary and secondary.

INFORMATION SOURCES

Primary sources

  • Manufacturers and suppliers
  • Channel partners
  • Industry experts
  • Strategic decision makers

Secondary sources

  • Industry journals and periodicals
  • Government data
  • Financial reports of key industry players
  • Historical data
  • Press releases

DATA ANALYSIS

Data Synthesis

  • Collation of data
  • Estimation of key figures
  • Analysis of derived insights

Data Validation

  • Triangulation with data models
  • Reference against proprietary databases
  • Corroboration with industry experts

REPORT WRITING

Qualitative

  • Market drivers
  • Market challenges
  • Market trends
  • Five forces analysis

Quantitative

  • Market size and forecast
  • Market segmentation
  • Geographical insights
  • Competitive landscape

Interested in this report?

Get your sample now to see our research methodology and insights!

Download Now

Frequently Asked Questions

Low And Medium Voltage Switchgear market growth will increase by USD 54577.1 million during 2026-2030.

The Low And Medium Voltage Switchgear market is expected to grow at a CAGR of 7.4% during 2026-2030.

Low And Medium Voltage Switchgear market is segmented by Type (GIS, AIS) Installation sites (Indoor, Outdoor) Component (Circuit breaker, Bus bars and switches, Relays, Others)

ABB Ltd., Bharat Heavy Electricals Ltd., CG Power and Industrial Ltd., CHINT Group, Eaton Corp. Plc, Emerson Electric Co., Fuji Electric Co. Ltd., GE Vernova Inc., HD Hyundai Electric Co. Ltd., Honeywell International Inc., Legrand SA, LS ELECTRIC Co. Ltd., Lucy Electric UK Ltd., Mitsubishi Electric Corp., Ormazabal, Powell Industries Inc., Rockwell Automation Inc., Schneider Electric SE, Toshiba Corp., WEG S.A are a few of the key vendors in the Low And Medium Voltage Switchgear market.

APAC will register the highest growth rate of 51% among the other regions. Therefore, the Low And Medium Voltage Switchgear market in APAC is expected to garner significant business opportunities for the vendors during the forecast period.

China, India, Japan, South Korea, Australia, Singapore, Germany, UK, France, Italy, Spain, The Netherlands, US, Canada, Mexico, Saudi Arabia, UAE, South Africa, Turkey, Egypt, Brazil, Argentina, Chile

  • Grid modernization and upgradation of aging infrastructure is the driving factor this market.

The Low And Medium Voltage Switchgear market vendors should focus on grabbing business opportunities from the Type segment as it accounted for the largest market share in the base year.
RIA - Research AI Assistant
Ask RIA