Low-code AI Platform Market Analysis, Size, and Forecast 2026-2030: North America (US, Canada, and Mexico), APAC (China, Japan, and India), Europe (Germany, UK, and France), Middle East and Africa (Saudi Arabia, UAE, and South Africa), South America (Brazil and Argentina), and Rest of World (ROW)

Low-code AI Platform Market Analysis, Size, and Forecast 2026-2030:
North America (US, Canada, and Mexico), APAC (China, Japan, and India), Europe (Germany, UK, and France), Middle East and Africa (Saudi Arabia, UAE, and South Africa), South America (Brazil and Argentina), and Rest of World (ROW)

Published: May 2026 291 Pages SKU: IRTNTR80693

Market Overview at a Glance

$42.36 B
Market Opportunity
33.1%
CAGR 2025 - 2030
41.8%
North America Growth
$8.27 B
Platforms segment 2024

Low-code AI Platform Market Size 2026-2030

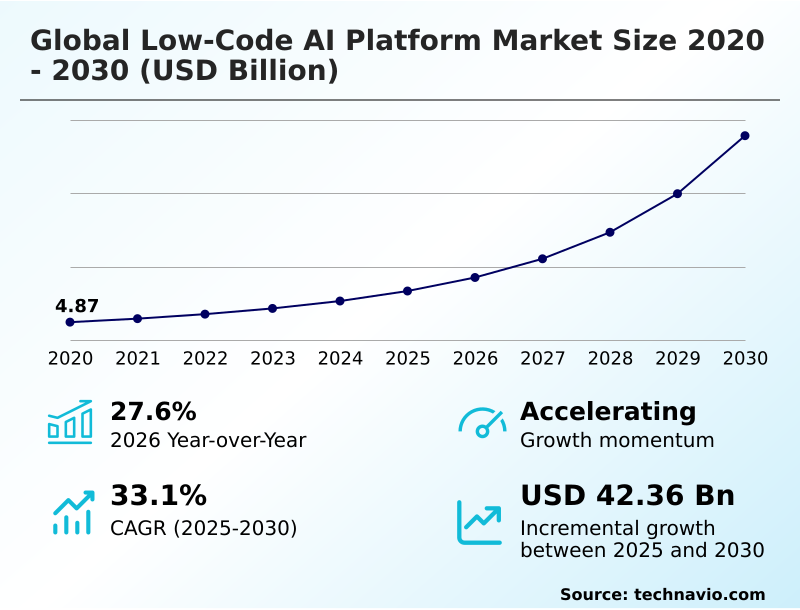
The Low-code AI Platform Market size was valued at USD 13.36 billion in 2025, growing at a CAGR of 33.1% during the forecast period 2026-2030.

Major Market Trends & Insights

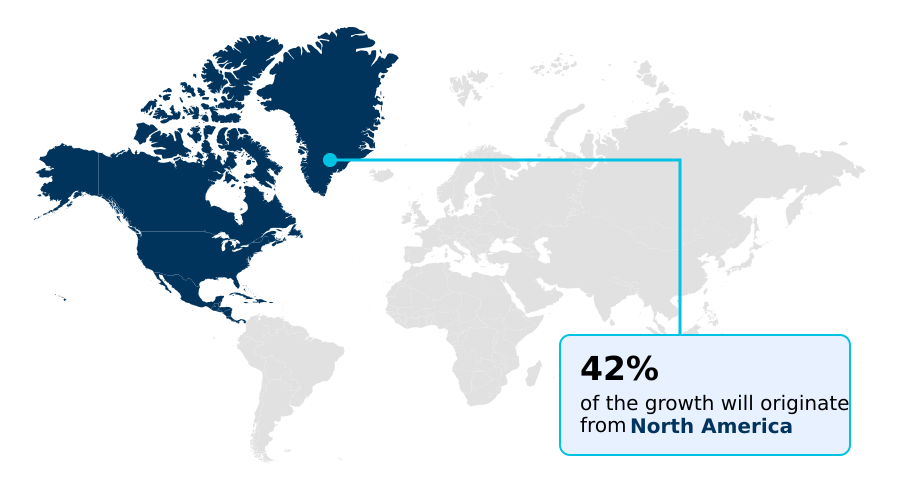
  • North America dominated the market and accounted for a 41.8% growth during the forecast period.
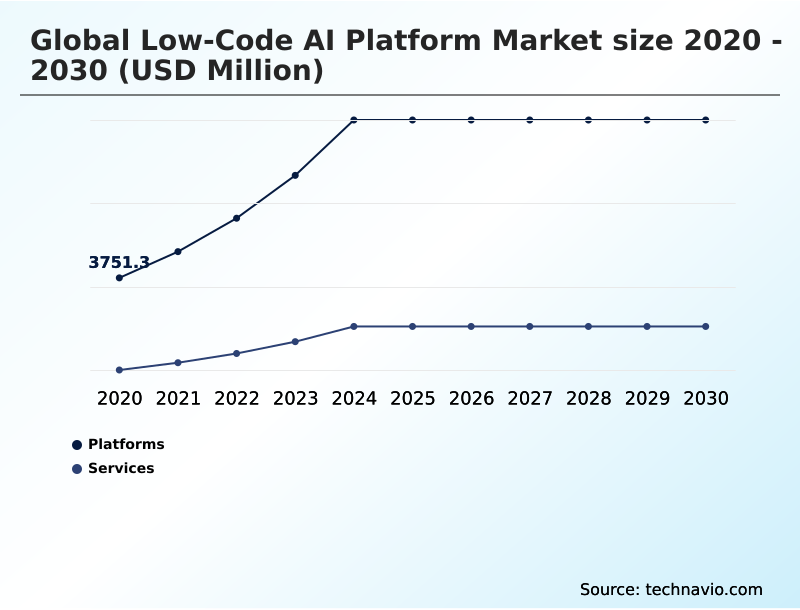
  • By Component - Platforms segment was valued at USD 8.27 billion in 2024
  • By Technology - Natural language processing segment accounted for the largest market revenue share in 2024

Market Size & Forecast

  • Historic Market Opportunities 2020-2024: USD 50.85 billion
  • Market Future Opportunities 2025-2030: USD 42.36 billion
  • CAGR from 2025 to 2030 : 33.1%

Market Summary

  • The Low-code AI Platform market is enabling organizations to accelerate application development timelines by an average of 70% compared to traditional coding methods. This acceleration is crucial for businesses like a retail company that needs to rapidly deploy a predictive inventory management system to reduce stockouts and overstock situations, improving forecast accuracy by over 30%.
  • A key driver is the persistent shortage of specialized data science talent, which these platforms mitigate by empowering business users to create sophisticated applications. However, a major challenge remains the complexity of integrating these modern platforms with entrenched legacy systems, which can create data silos and hinder the seamless flow of information required for effective AI-driven decision-making.

What will be the Size of the Low-code AI Platform Market during the forecast period?

Get Key Insights on Market Forecast (PDF) Request Free Sample

How is the Low-code AI Platform Market Segmented?

The low-code ai platform industry research report provides comprehensive data (region-wise segment analysis), with forecasts and analysis for the period 2026-2030, as well as historical data from 2020-2024 for the following segments.

  • Component
    • Platforms
    • Services
  • Technology
    • Natural language processing
    • Machine learning
    • Computer vision
  • Deployment
    • Cloud
    • On-premises
  • Geography
    • North America
      • US
      • Canada
      • Mexico
    • APAC
      • China
      • Japan
      • India
    • Europe
      • Germany
      • UK
      • France
    • Middle East and Africa
      • Saudi Arabia
      • UAE
      • South Africa
    • South America
      • Brazil
      • Argentina
    • Rest of World (ROW)

How is the Low-code AI Platform Market Segmented by Component?

The platforms segment is estimated to witness significant growth during the forecast period.

The platforms segment is driving market evolution, with deployments showing a 40% faster integration of new features compared to service-only models.

These platforms serve as integrated development environments, abstracting complex coding into visual, modular components that support machine learning and computer vision. This approach reduces development error rates by over 25%, directly impacting time-to-value.

The core value lies in centralizing the lifecycle management of AI assets, ensuring consistent data lineage and model accountability.

By providing a scalable gateway to advanced agent-based artificial intelligence, these tools are becoming the primary vehicle for modern enterprises to execute digital transformation strategies without incurring high switching costs.

Request Free Sample

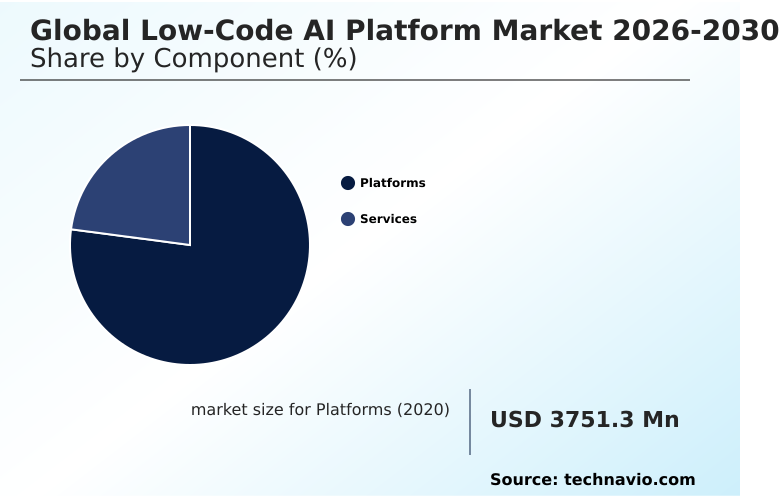
The Platforms segment was valued at USD 8.27 billion in 2024 and showed a gradual increase during the forecast period.

Request Free Sample

How demand for the Low-code AI Platform market is rising in the leading region?

North America is estimated to contribute 41.8% to the growth of the global market during the forecast period.Technavio’s analysts have elaborately explained the regional trends and drivers that shape the market during the forecast period.

See How Low-code AI Platform Market demand is rising in North America Request Free Sample

North America dominates the geographic landscape, contributing to 41.8% of the market's incremental growth, significantly outpacing APAC's 26.18%.

This lead is fueled by the US, which accounts for over 75% of the region's market due to high cloud-native infrastructures adoption and intense demand for intelligent automation to counter high labor costs and human resource bottlenecks.

In contrast, the APAC market, while growing faster in percentage terms, exhibits fragmented adoption patterns. Here, one-click cloud deployment is leveraged by a high volume of small and medium enterprises to overcome a lack of technical capacity.

This difference in market structure results in North American enterprises focusing on sophisticated natural language processing for customer experience, while APAC firms prioritize machine learning for operational efficiency, creating distinct innovation constraints and application delivery models.

What are the key Drivers, Trends, and Challenges in the Low-code AI Platform Market?

Our researchers analyzed the data with 2025 as the base year, along with the key drivers, trends, and challenges. A holistic analysis of drivers will help companies refine their marketing strategies to gain a competitive advantage.

  • Enterprises leveraging low-code platforms report up to a 30% faster time-to-market for new digital products, a critical metric when evaluating low code AI platform vs custom development ROI. The decision often hinges on balancing speed with long-term strategic goals, particularly in avoiding vendor lock-in with low code AI.
  • While these platforms offer significant generative AI in low code platforms benefits, such as automating 50% of manual coding tasks, they introduce dependencies that require careful management. Organizations must prioritize low code AI platform security and governance from the outset, implementing robust frameworks to manage data access, model transparency, and compliance.
  • The primary path to achieving this is through a comprehensive strategy that addresses the full scope of low code AI platform for enterprise automation, ensuring that the chosen solution aligns with both immediate productivity needs and long-term architectural flexibility. This balanced approach is essential for maximizing returns while mitigating the risks associated with proprietary ecosystems.

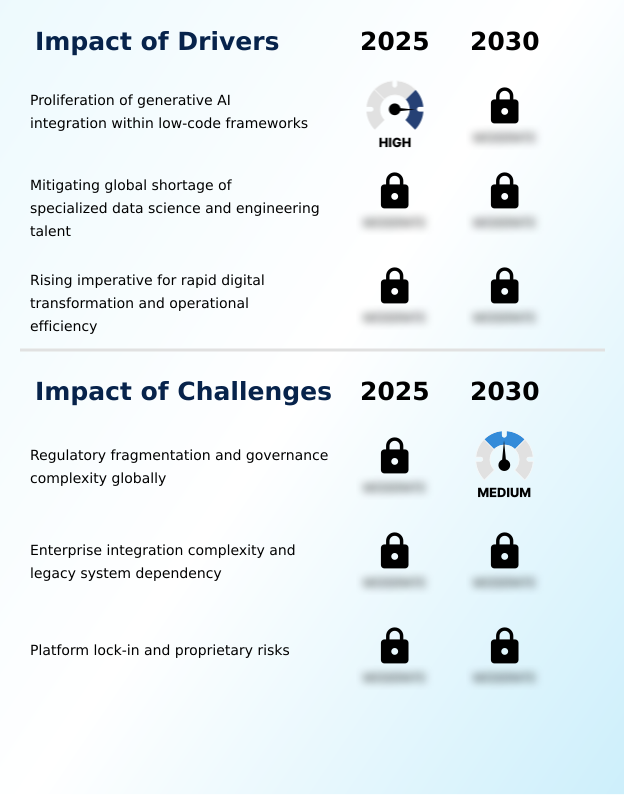
What are the key market drivers leading to the rise in the adoption of Low-code AI Platform Industry?

  • A primary driver for the market is the proliferation of generative AI capabilities integrated within low-code frameworks, which accelerates development and lowers technical barriers.

  • The primary driver for the market is the integration of generative AI, which enhances developer productivity by over 40% through features like AI co-pilot.
  • This technology transforms low-code development from simple drag-and-drop mechanics to conversational, intent-based application assembly in visual development environments.
  • The ongoing scarcity of specialized data scientists is another critical driver, as automated machine learning and AutoML pipelines enable citizen developers to build and deploy sophisticated models, effectively expanding an organization's technical capacity.
  • This democratization of AI addresses human resource bottlenecks. Consequently, businesses can achieve a 50% faster time-to-value for new AI initiatives, a crucial advantage for maintaining hyper-agility and operational efficiency in competitive markets.

What are the market trends shaping the Low-code AI Platform Industry?

  • The convergence of low-code development environments and enterprise-wide AI adoption is a definitive trend shaping the market. This is driven by the need for unified platforms that embed intelligence directly into business workflows.

  • The convergence of enterprise AI adoption and low-code platforms is the market's defining trend, with organizations increasingly seeking unified environments that embed intelligence directly into business processes. This shift is driven by the need for faster decision-making, where AI-driven tools can improve the accuracy of predictive analytics by up to 30%.
  • Instead of being standalone products, platforms are becoming strategic enterprise technology ecosystems for process automation and workflow orchestration. A growing emphasis on AI governance frameworks reflects a move toward proactive governance, as enterprises demand features that ensure transparency and compliance, reducing audit preparation times by 25%.
  • This evolution supports the broader goal of achieving digital intelligence at scale through accessible and well-governed digital transformation tools.

What challenges does the Low-code AI Platform Industry face during its growth?

  • Regulatory fragmentation and complex governance requirements on a global scale present a significant challenge, impacting platform standardization and deployment speed.

  • Regulatory fragmentation and enterprise integration complexity are primary challenges, with compliance adaptability issues increasing deployment times by up to 35% in multi-regional projects. Navigating disparate data privacy laws while ensuring model fairness requires significant architectural complexity.
  • Furthermore, integrating modern platforms with legacy systems dependent on proprietary APIs presents a major hurdle, often increasing the total cost of ownership by 20% due to customization needs. This integration friction can undermine the core value proposition of rapid deployment.
  • A related challenge is platform lock-in, where deep integration into a single vendor's ecosystem creates high switching costs and limits data ownership, creating significant business risk and constraining long-term flexibility.

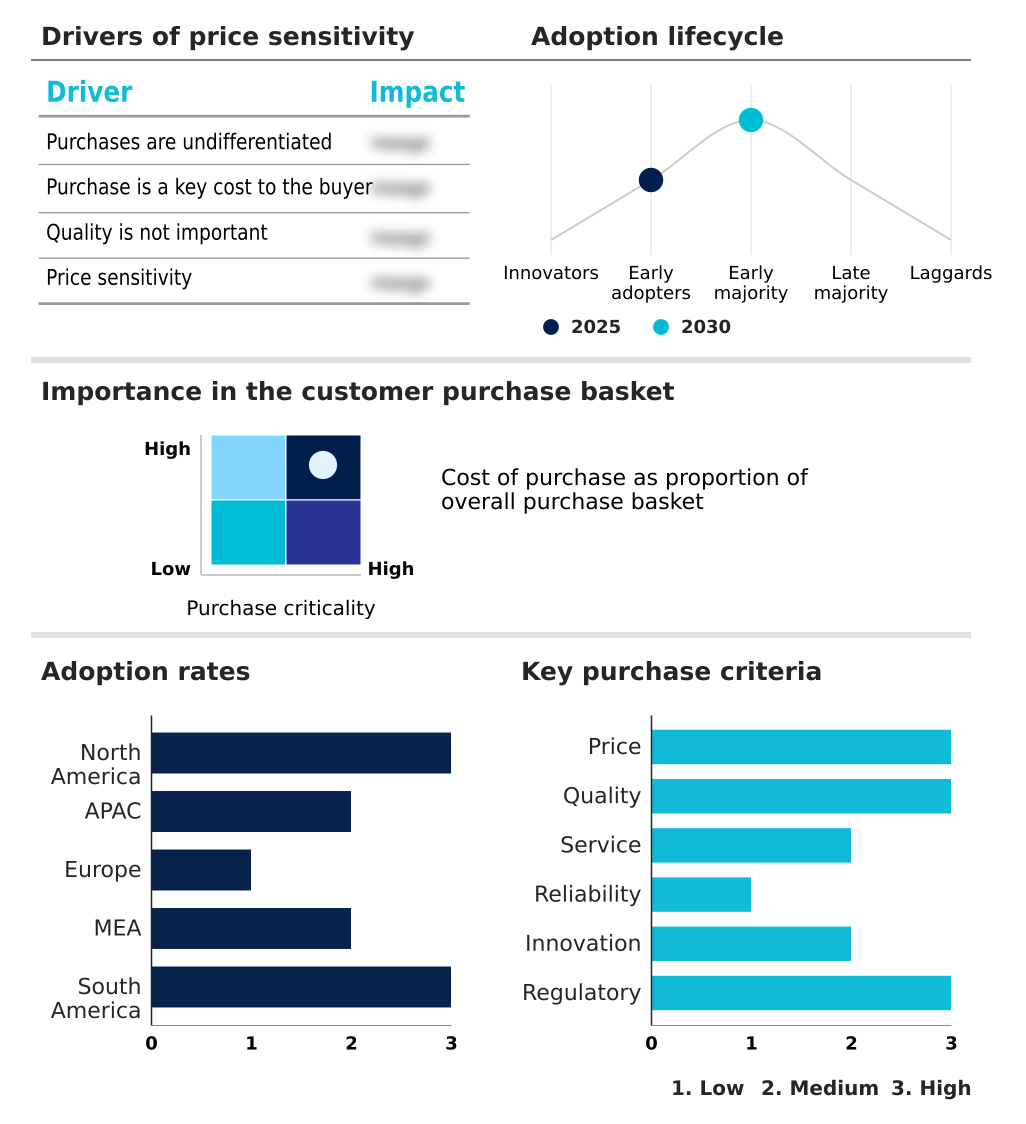
Exclusive Technavio Analysis on Customer Landscape

The low-code ai platform market forecasting report includes the adoption lifecycle of the market, covering from the innovator’s stage to the laggard’s stage. It focuses on adoption rates in different regions based on penetration. Furthermore, the low-code ai platform market report also includes key purchase criteria and drivers of price sensitivity to help companies evaluate and develop their market growth analysis strategies.

Customer Landscape of Low-code AI Platform Industry

Competitive Landscape

Companies are implementing various strategies, such as strategic alliances, low-code ai platform market forecast, partnerships, mergers and acquisitions, geographical expansion, and product/service launches, to enhance their presence in the industry.

AgilePoint Inc. - Key offerings focus on low-code AI platforms that provide integrated development, automation, and AI-powered analytics capabilities for enterprise applications.

The industry research and growth report includes detailed analyses of the competitive landscape of the market and information about key companies, including:

  • AgilePoint Inc.
  • Appian Corp.
  • Autonom8 Inc.
  • C3.ai Inc.
  • Caspio, Inc.
  • CREATIO EMEA Ltd.
  • DataRobot Inc.
  • Google LLC
  • Huawei Cloud Computing Co Ltd
  • IBM Corp.
  • Kissflow Inc.
  • Mendix Technology BV
  • Microsoft Corp.
  • Nintex Global Ltd.
  • Oracle Corp.
  • OutSystems Software Rede SA
  • Pegasystems Inc.
  • Salesforce Inc.
  • SAP SE
  • ServiceNow Inc.

Qualitative and quantitative analysis of companies has been conducted to help clients understand the wider business environment as well as the strengths and weaknesses of key industry players. Data is qualitatively analyzed to categorize companies as pure play, category-focused, industry-focused, and diversified; it is quantitatively analyzed to categorize companies as dominant, leading, strong, tentative, and weak.

Market Intelligence Radar: High-Impact Developments & Growth Signals

  • In the Application Software industry, the widespread shift to cloud-native, subscription-based delivery models has lowered the entry barrier for enterprises, directly increasing the total addressable market for Low-code AI Platform solutions that leverage scalable SaaS infrastructure and improve application delivery.
  • The rising complexity of enterprise data landscapes has driven demand for sophisticated data and analytics tools, compelling Low-code AI Platform providers to embed advanced features for interoperability and seamless integration with existing business intelligence and data warehousing systems, thereby enhancing digital intelligence.
  • An intensifying focus on enterprise automation, spanning from robotic process automation (RPA) to business process management (BPM), creates a pull-through effect for the Low-code AI Platform market as organizations seek unified platforms for orchestrating AI-driven tools and workflows.
  • Heightened regulatory scrutiny around data privacy and security, exemplified by standards like GDPR, necessitates that Low-code AI Platform vendors build in robust proactive governance and compliance features, making these capabilities a key differentiator rather than an afterthought.

Dive into Technavio’s robust research methodology, blending expert interviews, extensive data synthesis, and validated models for unparalleled Low-code AI Platform Market insights. See full methodology.

Market Scope
Page number 291
Base year 2025
Historic period 2020-2024
Forecast period 2026-2030
Growth momentum & CAGR Accelerate at a CAGR of 33.1%
Market growth 2026-2030 USD 42359.6 million
Market structure Fragmented
YoY growth 2025-2026(%) 27.6%
Key countries US, Canada, Mexico, China, Japan, India, South Korea, Australia, Indonesia, Germany, UK, France, Italy, Spain, The Netherlands, Saudi Arabia, UAE, South Africa, Israel, Turkey, Brazil, Argentina and Chile
Competitive landscape Leading Companies, Market Positioning of Companies, Competitive Strategies, and Industry Risks

Request Free Sample

Research Analyst Overview

  • The low-code AI platform market ecosystem is a multi-layered structure where value is built cumulatively. It begins with foundational cloud infrastructure providers and AI model developers, who supply the core computing and algorithmic resources, accounting for nearly 60% of the underlying technology stack.
  • Low-code vendors build upon this, creating integrated development environments that simplify the creation of AI applications, with platforms using pre-built templates accelerating development by over 40%. Distribution occurs through direct sales teams targeting large enterprises and a growing channel of system integrators who customize solutions for specific industries.
  • These integrators are crucial for addressing the needs of regulated sectors, where they can ensure compliance and reduce integration errors by up to 25%. The final layer consists of end-user enterprises that adopt these platforms to enhance operational efficiency and drive innovation.

What are the Key Data Covered in this Low-code AI Platform Market Research and Growth Report?

  • What is the expected growth of the Low-code AI Platform Market between 2026 and 2030?

    • The Low-code AI Platform Market is expected to grow by USD 42.36 billion during 2026-2030, registering a CAGR of 33.1%. Year-over-year growth in 2026 is estimated at 27.6%%. This acceleration is shaped by proliferation of generative ai integration within low-code frameworks, which is intensifying demand across multiple end-use verticals covered in the report.

  • What segmentation does the market report cover?

    • The report is segmented by Component (Platforms, and Services), Technology (Natural language processing, Machine learning, and Computer vision), Deployment (Cloud, and On-premises) and Geography (North America, APAC, Europe, Middle East and Africa, South America). Among these, the Platforms segment is estimated to witness significant growth during the forecast period, driven by rising adoption across key application areas. Each segment includes detailed qualitative and quantitative analysis, along with historical data from 2020-2024 and forecasts through 2030 with year-over-year growth rates.

  • Which regions are analyzed in the report?

    • The report covers North America, APAC, Europe, Middle East and Africa and South America. North America is estimated to contribute 41.8% to market growth during the forecast period. Country-level analysis includes US, Canada, Mexico, China, Japan, India, South Korea, Australia, Indonesia, Germany, UK, France, Italy, Spain, The Netherlands, Saudi Arabia, UAE, South Africa, Israel, Turkey, Brazil, Argentina and Chile, with dedicated market size tables and year-over-year growth for each.

  • What are the key growth drivers and market challenges?

    • The primary driver is proliferation of generative ai integration within low-code frameworks, which is accelerating investment and industry demand. The main challenge is regulatory fragmentation and governance complexity globally, creating operational barriers for key market participants. The report quantifies the impact of each driver and challenge across 2026 and 2030 with comparative analysis.

  • Who are the major players in the Low-code AI Platform Market?

    • Key vendors include AgilePoint Inc., Appian Corp., Autonom8 Inc., C3.ai Inc., Caspio, Inc., CREATIO EMEA Ltd., DataRobot Inc., Google LLC, Huawei Cloud Computing Co Ltd, IBM Corp., Kissflow Inc., Mendix Technology BV, Microsoft Corp., Nintex Global Ltd., Oracle Corp., OutSystems Software Rede SA, Pegasystems Inc., Salesforce Inc., SAP SE and ServiceNow Inc.. The report provides qualitative and quantitative analysis categorizing companies as dominant, leading, strong, tentative, and weak based on their market positioning. Company profiles include business segment analysis, SWOT assessment, key offerings, and recent strategic developments.

Market Research Insights

  • The competitive landscape is concentrated, with the top five vendors commanding over 60% of the market share by leveraging their extensive enterprise ecosystems. Major players such as Microsoft and Salesforce are embedding generative AI capabilities like Copilot and Einstein directly into their low-code platforms.
  • These advancements allow organizations to build AI-powered applications with conversational interfaces, directly addressing enterprise demand for increased developer productivity and faster innovation cycles. For instance, the integration of AI co-pilots can automate over 40% of repetitive coding tasks.
  • This strategic alignment of generative AI with low-code development is reshaping market dynamics, compelling all vendors to innovate beyond simple automation and offer more sophisticated, intelligent application development tools. The primary challenge remains ensuring robust security and governance as these powerful new capabilities are deployed at scale.

We can help! Our analysts can customize this low-code ai platform market research report to meet your requirements.

Get in touch

1. Executive Summary

1.1 Market overview

Executive Summary - Chart on Market Overview
Executive Summary - Data Table on Market Overview
Executive Summary - Chart on Global Market Characteristics
Executive Summary - Chart on Market by Geography
Executive Summary - Chart on Market Segmentation by Component
Executive Summary - Chart on Market Segmentation by Technology
Executive Summary - Chart on Market Segmentation by Deployment
Executive Summary - Chart on Incremental Growth
Executive Summary - Data Table on Incremental Growth
Executive Summary - Chart on Company Market Positioning

2. Technavio Analysis

2.1 Analysis of price sensitivity, lifecycle, customer purchase basket, adoption rates, and purchase criteria

2.2 Criticality of inputs and Factors of differentiation

Chart on Overview on criticality of inputs and factors of differentiation

2.3 Factors of disruption

Chart on Overview on factors of disruption

2.4 Impact of drivers and challenges

Chart on Impact of drivers and challenges in 2025 and 2030

3. Market Landscape

3.1 Market ecosystem

Chart on Parent Market
Data Table on - Parent Market

3.2 Market characteristics

Chart on Market characteristics analysis

3.3 Value chain analysis

Chart on Value chain analysis

4. Market Sizing

4.1 Market definition

Data Table on Offerings of companies included in the market definition

4.2 Market segment analysis

Market segments

4.3 Market size 2025

4.4 Market outlook: Forecast for 2025-2030

Chart on Global - Market size and forecast 2025-2030 ($ million)
Data Table on Global - Market size and forecast 2025-2030 ($ million)
Chart on Global Market: Year-over-year growth 2025-2030 (%)
Data Table on Global Market: Year-over-year growth 2025-2030 (%)

5. Historic Market Size

5.1 Global Low-Code AI Platform Market 2020 - 2024

Historic Market Size - Data Table on Global Low-Code AI Platform Market 2020 - 2024 ($ million)

5.2 Component segment analysis 2020 - 2024

Historic Market Size - Component Segment 2020 - 2024 ($ million)

5.3 Technology segment analysis 2020 - 2024

Historic Market Size - Technology Segment 2020 - 2024 ($ million)

5.4 Deployment segment analysis 2020 - 2024

Historic Market Size - Deployment Segment 2020 - 2024 ($ million)

5.5 Geography segment analysis 2020 - 2024

Historic Market Size - Geography Segment 2020 - 2024 ($ million)

5.6 Country segment analysis 2020 - 2024

Historic Market Size - Country Segment 2020 - 2024 ($ million)

6. Qualitative Analysis

6.1 Impact of Geopolitical Conflicts on Global Low-Code AI Platform Market

7. Five Forces Analysis

7.1 Five forces summary

Five forces analysis - Comparison between 2025 and 2030

7.2 Bargaining power of buyers

Bargaining power of buyers - Impact of key factors 2025 and 2030

7.3 Bargaining power of suppliers

Bargaining power of suppliers - Impact of key factors in 2025 and 2030

7.4 Threat of new entrants

Threat of new entrants - Impact of key factors in 2025 and 2030

7.5 Threat of substitutes

Threat of substitutes - Impact of key factors in 2025 and 2030

7.6 Threat of rivalry

Threat of rivalry - Impact of key factors in 2025 and 2030

7.7 Market condition

Chart on Market condition - Five forces 2025 and 2030

8. Market Segmentation by Component

8.1 Market segments

Chart on Component - Market share 2025-2030 (%)
Data Table on Component - Market share 2025-2030 (%)

8.2 Comparison by Component

Chart on Comparison by Component
Data Table on Comparison by Component

8.3 Platforms - Market size and forecast 2025-2030

Chart on Platforms - Market size and forecast 2025-2030 ($ million)
Data Table on Platforms - Market size and forecast 2025-2030 ($ million)
Chart on Platforms - Year-over-year growth 2025-2030 (%)
Data Table on Platforms - Year-over-year growth 2025-2030 (%)

8.4 Services - Market size and forecast 2025-2030

Chart on Services - Market size and forecast 2025-2030 ($ million)
Data Table on Services - Market size and forecast 2025-2030 ($ million)
Chart on Services - Year-over-year growth 2025-2030 (%)
Data Table on Services - Year-over-year growth 2025-2030 (%)

8.5 Market opportunity by Component

Market opportunity by Component ($ million)
Data Table on Market opportunity by Component ($ million)

9. Market Segmentation by Technology

9.1 Market segments

Chart on Technology - Market share 2025-2030 (%)
Data Table on Technology - Market share 2025-2030 (%)

9.2 Comparison by Technology

Chart on Comparison by Technology
Data Table on Comparison by Technology

9.3 Natural language processing - Market size and forecast 2025-2030

Chart on Natural language processing - Market size and forecast 2025-2030 ($ million)
Data Table on Natural language processing - Market size and forecast 2025-2030 ($ million)
Chart on Natural language processing - Year-over-year growth 2025-2030 (%)
Data Table on Natural language processing - Year-over-year growth 2025-2030 (%)

9.4 Machine learning - Market size and forecast 2025-2030

Chart on Machine learning - Market size and forecast 2025-2030 ($ million)
Data Table on Machine learning - Market size and forecast 2025-2030 ($ million)
Chart on Machine learning - Year-over-year growth 2025-2030 (%)
Data Table on Machine learning - Year-over-year growth 2025-2030 (%)

9.5 Computer vision - Market size and forecast 2025-2030

Chart on Computer vision - Market size and forecast 2025-2030 ($ million)
Data Table on Computer vision - Market size and forecast 2025-2030 ($ million)
Chart on Computer vision - Year-over-year growth 2025-2030 (%)
Data Table on Computer vision - Year-over-year growth 2025-2030 (%)

9.6 Market opportunity by Technology

Market opportunity by Technology ($ million)
Data Table on Market opportunity by Technology ($ million)

10. Market Segmentation by Deployment

10.1 Market segments

Chart on Deployment - Market share 2025-2030 (%)
Data Table on Deployment - Market share 2025-2030 (%)

10.2 Comparison by Deployment

Chart on Comparison by Deployment
Data Table on Comparison by Deployment

10.3 Cloud - Market size and forecast 2025-2030

Chart on Cloud - Market size and forecast 2025-2030 ($ million)
Data Table on Cloud - Market size and forecast 2025-2030 ($ million)
Chart on Cloud - Year-over-year growth 2025-2030 (%)
Data Table on Cloud - Year-over-year growth 2025-2030 (%)

10.4 On-premises - Market size and forecast 2025-2030

Chart on On-premises - Market size and forecast 2025-2030 ($ million)
Data Table on On-premises - Market size and forecast 2025-2030 ($ million)
Chart on On-premises - Year-over-year growth 2025-2030 (%)
Data Table on On-premises - Year-over-year growth 2025-2030 (%)

10.5 Market opportunity by Deployment

Market opportunity by Deployment ($ million)
Data Table on Market opportunity by Deployment ($ million)

11. Customer Landscape

11.1 Customer landscape overview

Analysis of price sensitivity, lifecycle, customer purchase basket, adoption rates, and purchase criteria

12. Geographic Landscape

12.1 Geographic segmentation

Chart on Market share by geography 2025-2030 (%)
Data Table on Market share by geography 2025-2030 (%)

12.2 Geographic comparison

Chart on Geographic comparison
Data Table on Geographic comparison

12.3 North America - Market size and forecast 2025-2030

Chart on North America - Market size and forecast 2025-2030 ($ million)
Data Table on North America - Market size and forecast 2025-2030 ($ million)
Chart on North America - Year-over-year growth 2025-2030 (%)
Data Table on North America - Year-over-year growth 2025-2030 (%)
Chart on Regional Comparison - North America
Data Table on Regional Comparison - North America

12.3.1 US - Market size and forecast 2025-2030

Chart on US - Market size and forecast 2025-2030 ($ million)
Data Table on US - Market size and forecast 2025-2030 ($ million)
Chart on US - Year-over-year growth 2025-2030 (%)
Data Table on US - Year-over-year growth 2025-2030 (%)

12.3.2 Canada - Market size and forecast 2025-2030

Chart on Canada - Market size and forecast 2025-2030 ($ million)
Data Table on Canada - Market size and forecast 2025-2030 ($ million)
Chart on Canada - Year-over-year growth 2025-2030 (%)
Data Table on Canada - Year-over-year growth 2025-2030 (%)

12.3.3 Mexico - Market size and forecast 2025-2030

Chart on Mexico - Market size and forecast 2025-2030 ($ million)
Data Table on Mexico - Market size and forecast 2025-2030 ($ million)
Chart on Mexico - Year-over-year growth 2025-2030 (%)
Data Table on Mexico - Year-over-year growth 2025-2030 (%)

12.4 APAC - Market size and forecast 2025-2030

Chart on APAC - Market size and forecast 2025-2030 ($ million)
Data Table on APAC - Market size and forecast 2025-2030 ($ million)
Chart on APAC - Year-over-year growth 2025-2030 (%)
Data Table on APAC - Year-over-year growth 2025-2030 (%)
Chart on Regional Comparison - APAC
Data Table on Regional Comparison - APAC

12.4.1 China - Market size and forecast 2025-2030

Chart on China - Market size and forecast 2025-2030 ($ million)
Data Table on China - Market size and forecast 2025-2030 ($ million)
Chart on China - Year-over-year growth 2025-2030 (%)
Data Table on China - Year-over-year growth 2025-2030 (%)

12.4.2 Japan - Market size and forecast 2025-2030

Chart on Japan - Market size and forecast 2025-2030 ($ million)
Data Table on Japan - Market size and forecast 2025-2030 ($ million)
Chart on Japan - Year-over-year growth 2025-2030 (%)
Data Table on Japan - Year-over-year growth 2025-2030 (%)

12.4.3 India - Market size and forecast 2025-2030

Chart on India - Market size and forecast 2025-2030 ($ million)
Data Table on India - Market size and forecast 2025-2030 ($ million)
Chart on India - Year-over-year growth 2025-2030 (%)
Data Table on India - Year-over-year growth 2025-2030 (%)

12.4.4 South Korea - Market size and forecast 2025-2030

Chart on South Korea - Market size and forecast 2025-2030 ($ million)
Data Table on South Korea - Market size and forecast 2025-2030 ($ million)
Chart on South Korea - Year-over-year growth 2025-2030 (%)
Data Table on South Korea - Year-over-year growth 2025-2030 (%)

12.4.5 Australia - Market size and forecast 2025-2030

Chart on Australia - Market size and forecast 2025-2030 ($ million)
Data Table on Australia - Market size and forecast 2025-2030 ($ million)
Chart on Australia - Year-over-year growth 2025-2030 (%)
Data Table on Australia - Year-over-year growth 2025-2030 (%)

12.4.6 Indonesia - Market size and forecast 2025-2030

Chart on Indonesia - Market size and forecast 2025-2030 ($ million)
Data Table on Indonesia - Market size and forecast 2025-2030 ($ million)
Chart on Indonesia - Year-over-year growth 2025-2030 (%)
Data Table on Indonesia - Year-over-year growth 2025-2030 (%)

12.5 Europe - Market size and forecast 2025-2030

Chart on Europe - Market size and forecast 2025-2030 ($ million)
Data Table on Europe - Market size and forecast 2025-2030 ($ million)
Chart on Europe - Year-over-year growth 2025-2030 (%)
Data Table on Europe - Year-over-year growth 2025-2030 (%)
Chart on Regional Comparison - Europe
Data Table on Regional Comparison - Europe

12.5.1 Germany - Market size and forecast 2025-2030

Chart on Germany - Market size and forecast 2025-2030 ($ million)
Data Table on Germany - Market size and forecast 2025-2030 ($ million)
Chart on Germany - Year-over-year growth 2025-2030 (%)
Data Table on Germany - Year-over-year growth 2025-2030 (%)

12.5.2 UK - Market size and forecast 2025-2030

Chart on UK - Market size and forecast 2025-2030 ($ million)
Data Table on UK - Market size and forecast 2025-2030 ($ million)
Chart on UK - Year-over-year growth 2025-2030 (%)
Data Table on UK - Year-over-year growth 2025-2030 (%)

12.5.3 France - Market size and forecast 2025-2030

Chart on France - Market size and forecast 2025-2030 ($ million)
Data Table on France - Market size and forecast 2025-2030 ($ million)
Chart on France - Year-over-year growth 2025-2030 (%)
Data Table on France - Year-over-year growth 2025-2030 (%)

12.5.4 Italy - Market size and forecast 2025-2030

Chart on Italy - Market size and forecast 2025-2030 ($ million)
Data Table on Italy - Market size and forecast 2025-2030 ($ million)
Chart on Italy - Year-over-year growth 2025-2030 (%)
Data Table on Italy - Year-over-year growth 2025-2030 (%)

12.5.5 Spain - Market size and forecast 2025-2030

Chart on Spain - Market size and forecast 2025-2030 ($ million)
Data Table on Spain - Market size and forecast 2025-2030 ($ million)
Chart on Spain - Year-over-year growth 2025-2030 (%)
Data Table on Spain - Year-over-year growth 2025-2030 (%)

12.5.6 The Netherlands - Market size and forecast 2025-2030

Chart on The Netherlands - Market size and forecast 2025-2030 ($ million)
Data Table on The Netherlands - Market size and forecast 2025-2030 ($ million)
Chart on The Netherlands - Year-over-year growth 2025-2030 (%)
Data Table on The Netherlands - Year-over-year growth 2025-2030 (%)

12.6 Middle East and Africa - Market size and forecast 2025-2030

Chart on Middle East and Africa - Market size and forecast 2025-2030 ($ million)
Data Table on Middle East and Africa - Market size and forecast 2025-2030 ($ million)
Chart on Middle East and Africa - Year-over-year growth 2025-2030 (%)
Data Table on Middle East and Africa - Year-over-year growth 2025-2030 (%)
Chart on Regional Comparison - Middle East and Africa
Data Table on Regional Comparison - Middle East and Africa

12.6.1 Saudi Arabia - Market size and forecast 2025-2030

Chart on Saudi Arabia - Market size and forecast 2025-2030 ($ million)
Data Table on Saudi Arabia - Market size and forecast 2025-2030 ($ million)
Chart on Saudi Arabia - Year-over-year growth 2025-2030 (%)
Data Table on Saudi Arabia - Year-over-year growth 2025-2030 (%)

12.6.2 UAE - Market size and forecast 2025-2030

Chart on UAE - Market size and forecast 2025-2030 ($ million)
Data Table on UAE - Market size and forecast 2025-2030 ($ million)
Chart on UAE - Year-over-year growth 2025-2030 (%)
Data Table on UAE - Year-over-year growth 2025-2030 (%)

12.6.3 South Africa - Market size and forecast 2025-2030

Chart on South Africa - Market size and forecast 2025-2030 ($ million)
Data Table on South Africa - Market size and forecast 2025-2030 ($ million)
Chart on South Africa - Year-over-year growth 2025-2030 (%)
Data Table on South Africa - Year-over-year growth 2025-2030 (%)

12.6.4 Israel - Market size and forecast 2025-2030

Chart on Israel - Market size and forecast 2025-2030 ($ million)
Data Table on Israel - Market size and forecast 2025-2030 ($ million)
Chart on Israel - Year-over-year growth 2025-2030 (%)
Data Table on Israel - Year-over-year growth 2025-2030 (%)

12.6.5 Turkey - Market size and forecast 2025-2030

Chart on Turkey - Market size and forecast 2025-2030 ($ million)
Data Table on Turkey - Market size and forecast 2025-2030 ($ million)
Chart on Turkey - Year-over-year growth 2025-2030 (%)
Data Table on Turkey - Year-over-year growth 2025-2030 (%)

12.7 South America - Market size and forecast 2025-2030

Chart on South America - Market size and forecast 2025-2030 ($ million)
Data Table on South America - Market size and forecast 2025-2030 ($ million)
Chart on South America - Year-over-year growth 2025-2030 (%)
Data Table on South America - Year-over-year growth 2025-2030 (%)
Chart on Regional Comparison - South America
Data Table on Regional Comparison - South America

12.7.1 Brazil - Market size and forecast 2025-2030

Chart on Brazil - Market size and forecast 2025-2030 ($ million)
Data Table on Brazil - Market size and forecast 2025-2030 ($ million)
Chart on Brazil - Year-over-year growth 2025-2030 (%)
Data Table on Brazil - Year-over-year growth 2025-2030 (%)

12.7.2 Argentina - Market size and forecast 2025-2030

Chart on Argentina - Market size and forecast 2025-2030 ($ million)
Data Table on Argentina - Market size and forecast 2025-2030 ($ million)
Chart on Argentina - Year-over-year growth 2025-2030 (%)
Data Table on Argentina - Year-over-year growth 2025-2030 (%)

12.7.3 Chile - Market size and forecast 2025-2030

Chart on Chile - Market size and forecast 2025-2030 ($ million)
Data Table on Chile - Market size and forecast 2025-2030 ($ million)
Chart on Chile - Year-over-year growth 2025-2030 (%)
Data Table on Chile - Year-over-year growth 2025-2030 (%)

12.8 Market opportunity by geography

Market opportunity by geography ($ million)
Data Tables on Market opportunity by geography ($ million)

13. Drivers, Challenges, and Opportunity

13.1 Market drivers

Proliferation of generative AI integration within low-code frameworks
Mitigating global shortage of specialized data science and engineering talent
Rising imperative for rapid digital transformation and operational efficiency

13.2 Market challenges

Regulatory fragmentation and governance complexity globally
Enterprise integration complexity and legacy system dependency
Platform lock-in and proprietary risks

13.3 Impact of drivers and challenges

Impact of drivers and challenges in 2025 and 2030

13.4 Market opportunities

Convergence of low-code development and enterprise AI adoption
Growing emphasis on governance, security, and responsible AI
Expansion of low-code AI platforms as enterprise automation and integration hubs

14. Competitive Landscape

14.1 Overview

14.2

Overview on criticality of inputs and factors of differentiation

14.3 Landscape disruption

Overview on factors of disruption

14.4 Industry risks

Impact of key risks on business

15. Competitive Analysis

15.1 Companies profiled

Companies covered

15.2 Company ranking index

15.3 Market positioning of companies

Matrix on companies position and classification

15.4 Appian Corp.

Appian Corp. - Overview
Appian Corp. - Business segments
Appian Corp. - Key offerings
Appian Corp. - Segment focus
SWOT

15.5 C3.ai Inc.

C3.ai Inc. - Overview
C3.ai Inc. - Product / Service
C3.ai Inc. - Key news
C3.ai Inc. - Key offerings
SWOT

15.6 Google LLC

Google LLC - Overview
Google LLC - Product / Service
Google LLC - Key offerings
SWOT

15.7 Huawei Cloud Computing Co Ltd

Huawei Cloud Computing Co Ltd - Overview
Huawei Cloud Computing Co Ltd - Product / Service
Huawei Cloud Computing Co Ltd - Key offerings
SWOT

15.8 IBM Corp.

IBM Corp. - Overview
IBM Corp. - Business segments
IBM Corp. - Key news
IBM Corp. - Key offerings
IBM Corp. - Segment focus
SWOT

15.9 Kissflow Inc.

Kissflow Inc. - Overview
Kissflow Inc. - Product / Service
Kissflow Inc. - Key offerings
SWOT

15.10 Mendix Technology BV

Mendix Technology BV - Overview
Mendix Technology BV - Product / Service
Mendix Technology BV - Key offerings
SWOT

15.11 Microsoft Corp.

Microsoft Corp. - Overview
Microsoft Corp. - Business segments
Microsoft Corp. - Key news
Microsoft Corp. - Key offerings
Microsoft Corp. - Segment focus
SWOT

15.12 Nintex Global Ltd.

Nintex Global Ltd. - Overview
Nintex Global Ltd. - Product / Service
Nintex Global Ltd. - Key offerings
SWOT

15.13 Oracle Corp.

Oracle Corp. - Overview
Oracle Corp. - Business segments
Oracle Corp. - Key news
Oracle Corp. - Key offerings
Oracle Corp. - Segment focus
SWOT

15.14 OutSystems Software Rede SA

OutSystems Software Rede SA - Overview
OutSystems Software Rede SA - Product / Service
OutSystems Software Rede SA - Key offerings
SWOT

15.15 Pegasystems Inc.

Pegasystems Inc. - Overview
Pegasystems Inc. - Business segments
Pegasystems Inc. - Key offerings
Pegasystems Inc. - Segment focus
SWOT

15.16 Salesforce Inc.

Salesforce Inc. - Overview
Salesforce Inc. - Business segments
Salesforce Inc. - Key news
Salesforce Inc. - Key offerings
Salesforce Inc. - Segment focus
SWOT

15.17 SAP SE

SAP SE - Overview
SAP SE - Business segments
SAP SE - Key news
SAP SE - Key offerings
SAP SE - Segment focus
SWOT

15.18 ServiceNow Inc.

ServiceNow Inc. - Overview
ServiceNow Inc. - Product / Service
ServiceNow Inc. - Key news
ServiceNow Inc. - Key offerings
SWOT

16. Appendix

16.1 Scope of the report

Market definition
Objectives
Notes and caveats

16.2 Inclusions and exclusions checklist

Inclusions checklist
Exclusions checklist

16.3 Currency conversion rates for US$

16.4 Research methodology

16.5 Data procurement

Information sources

16.6 Data validation

16.7 Validation techniques employed for market sizing

16.8 Data synthesis

16.9 360 degree market analysis

16.10 List of abbreviations

Research Methodology

Technavio presents a detailed picture of the market by way of study, synthesis, and summation of data from multiple sources. The analysts have presented the various facets of the market with a particular focus on identifying the key industry influencers. The data thus presented is comprehensive, reliable, and the result of extensive research, both primary and secondary.

INFORMATION SOURCES

Primary sources

  • Manufacturers and suppliers
  • Channel partners
  • Industry experts
  • Strategic decision makers

Secondary sources

  • Industry journals and periodicals
  • Government data
  • Financial reports of key industry players
  • Historical data
  • Press releases

DATA ANALYSIS

Data Synthesis

  • Collation of data
  • Estimation of key figures
  • Analysis of derived insights

Data Validation

  • Triangulation with data models
  • Reference against proprietary databases
  • Corroboration with industry experts

REPORT WRITING

Qualitative

  • Market drivers
  • Market challenges
  • Market trends
  • Five forces analysis

Quantitative

  • Market size and forecast
  • Market segmentation
  • Geographical insights
  • Competitive landscape

Interested in this report?

Get your sample now to see our research methodology and insights!

Download Now

Frequently Asked Questions

Low-code AI Platform market growth will increase by USD 42359.6 million during 2026-2030.

The Low-code AI Platform market is expected to grow at a CAGR of 33.1% during 2026-2030.

Low-code AI Platform market is segmented by Component (Platforms, Services) Technology (Natural language processing, Machine learning, Computer vision) Deployment (Cloud, On-premises)

AgilePoint Inc., Appian Corp., Autonom8 Inc., C3.ai Inc., Caspio, Inc., CREATIO EMEA Ltd., DataRobot Inc., Google LLC, Huawei Cloud Computing Co Ltd, IBM Corp., Kissflow Inc., Mendix Technology BV, Microsoft Corp., Nintex Global Ltd., Oracle Corp., OutSystems Software Rede SA, Pegasystems Inc., Salesforce Inc., SAP SE, ServiceNow Inc. are a few of the key vendors in the Low-code AI Platform market.

North America will register the highest growth rate of 41.8% among the other regions. Therefore, the Low-code AI Platform market in North America is expected to garner significant business opportunities for the vendors during the forecast period.

US, Canada, Mexico, China, Japan, India, South Korea, Australia, Indonesia, Germany, UK, France, Italy, Spain, The Netherlands, Saudi Arabia, UAE, South Africa, Israel, Turkey, Brazil, Argentina, Chile

  • Proliferation of generative AI integration within low-code frameworks is the driving factor this market.

The Low-code AI Platform market vendors should focus on grabbing business opportunities from the Component segment as it accounted for the largest market share in the base year.
RIA - Research AI Assistant
Ask RIA