Loyalty Management Market Analysis, Size, and Forecast 2026-2030: North America (US, Canada, and Mexico), Europe (Germany, UK, and France), APAC (China, Japan, and India), South America (Brazil and Argentina), Middle East and Africa (Saudi Arabia, UAE, and Turkey), and Rest of World (ROW)

Loyalty Management Market Analysis, Size, and Forecast 2026-2030:
North America (US, Canada, and Mexico), Europe (Germany, UK, and France), APAC (China, Japan, and India), South America (Brazil and Argentina), Middle East and Africa (Saudi Arabia, UAE, and Turkey), and Rest of World (ROW)

Published: Mar 2026 277 Pages SKU: IRTNTR74503

Market Overview at a Glance

$6.27 B
Market Opportunity
15.8%
CAGR 2025 - 2030
50.7%
North America Growth
$4.26 B
Cloud-based segment 2024

Loyalty Management Market Size 2026-2030

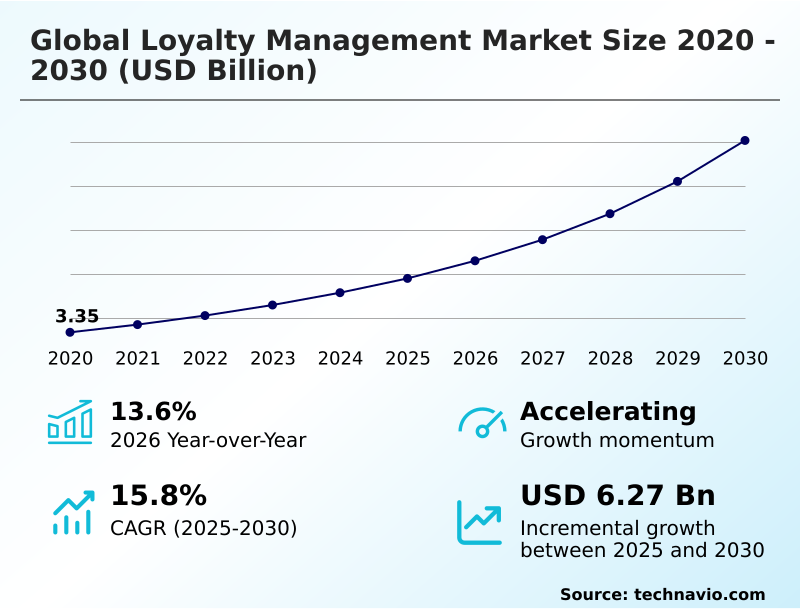
The loyalty management market size is valued to increase by USD 6.27 billion, at a CAGR of 15.8% from 2025 to 2030. Growing customer preference for personalized solutions will drive the loyalty management market.

Major Market Trends & Insights

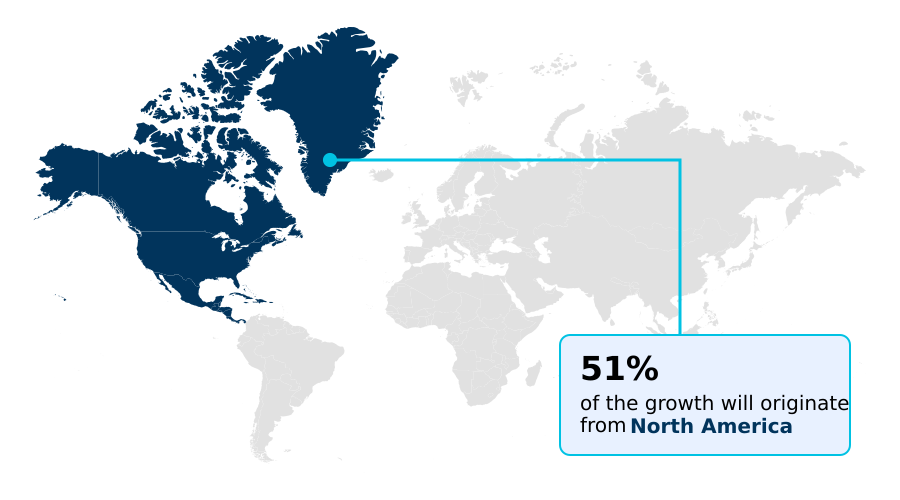
  • North America dominated the market and accounted for a 50.7% growth during the forecast period.
  • By Deployment - Cloud-based segment was valued at USD 4.26 billion in 2024
  • By End-user - Large enterprises segment accounted for the largest market revenue share in 2024

Market Size & Forecast

  • Market Opportunities: USD 8.72 billion
  • Market Future Opportunities: USD 6.27 billion
  • CAGR from 2025 to 2030 : 15.8%

Market Summary

  • The Loyalty Management Market is undergoing a significant transformation, moving beyond the simple points-based loyalty system to create sophisticated ecosystems focused on maximizing customer lifetime value (CLV). This evolution is driven by the demand for hyper-personalization, which requires deep behavioral data analytics and robust customer segmentation rules.
  • A core trend is the integration of artificial intelligence, powering everything from AI-powered recommendations to predictive churn analytics. For instance, a retail enterprise can deploy churn prediction models to identify at-risk customers and proactively engage them with tailored incentives through a hyper-personalization engine, significantly improving its customer retention rate.
  • The adoption of a customer data platform (CDP) has become instrumental in achieving a single customer view, enabling seamless omnichannel rewards program experiences. However, the industry faces challenges related to reward liability management and navigating complex data privacy regulations, pushing firms toward privacy-preserving data sharing techniques.
  • The future lies in creating genuine emotional loyalty metrics through experiential rewards design and gamification mechanics, fostering brand advocacy that transcends transactions. This strategic shift requires an API-first loyalty architecture to ensure agility and integration.

What will be the Size of the Loyalty Management Market during the forecast period?

Get Key Insights on Market Forecast (PDF) Request Free Sample

How is the Loyalty Management Market Segmented?

The loyalty management industry research report provides comprehensive data (region-wise segment analysis), with forecasts and estimates in "USD million" for the period 2026-2030, as well as historical data from 2020-2024 for the following segments.

  • Deployment
    • Cloud-based
    • On-premises
  • End-user
    • Large enterprises
    • Small and medium enterprises
  • Component
    • Solution
    • Service
  • Geography
    • North America
      • US
      • Canada
      • Mexico
    • Europe
      • Germany
      • UK
      • France
    • APAC
      • China
      • Japan
      • India
    • South America
      • Brazil
      • Argentina
    • Middle East and Africa
      • Saudi Arabia
      • UAE
      • Turkey
    • Rest of World (ROW)

By Deployment Insights

The cloud-based segment is estimated to witness significant growth during the forecast period.

The shift to cloud-based deployment models is driven by the need for agility and scalability. These platforms are essential for executing a modern omnichannel rewards program, which demands a single customer view across all touchpoints.

Businesses are leveraging an API-first loyalty architecture for seamless headless commerce integration, enabling capabilities like real-time point redemption and immediate responsiveness. The rise of subscription-based loyalty models and enhanced mobile wallet integration is supported by this infrastructure.

This allows for real-time event triggering and effective closed-loop marketing attribution, which has improved offer take-up rates by over 15% in some deployments.

The architecture also facilitates complex partner ecosystem management, enhancing overall program value and member engagement across various brands.

Request Free Sample

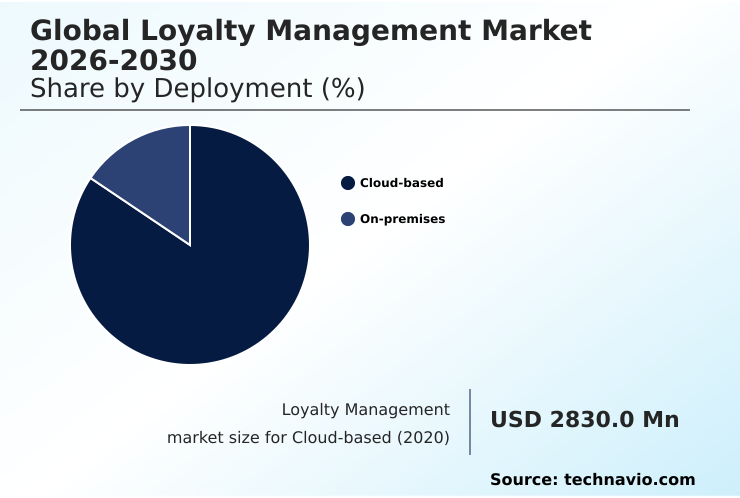
The Cloud-based segment was valued at USD 4.26 billion in 2024 and showed a gradual increase during the forecast period.

Request Free Sample

Regional Analysis

North America is estimated to contribute 50.7% to the growth of the global market during the forecast period.Technavio’s analysts have elaborately explained the regional trends and drivers that shape the market during the forecast period.

See How Loyalty Management Market Demand is Rising in North America Request Free Sample

North America remains the dominant region, contributing over 50% of the incremental growth, driven by a mature retail environment. Here, the focus has shifted to sophisticated customer journey mapping and enhancing the customer engagement score.

European markets, accounting for approximately 25% of opportunity, emphasize zero-party data collection in compliance with strict privacy laws. In both regions, the use of a card-linked offer platform and the rise of the coalition loyalty program are key strategies.

APAC is a high-growth area, where social loyalty features and a personalized communication cadence are critical for engagement.

Globally, customer identity resolution is a core technical priority for enabling seamless omnichannel experiences, while program ROI calculation and its impact on employee engagement programs are boardroom-level concerns.

Market Dynamics

Our researchers analyzed the data with 2025 as the base year, along with the key drivers, trends, and challenges. A holistic analysis of drivers will help companies refine their marketing strategies to gain a competitive advantage.

  • Strategically, organizations are now focused on measuring the impact of tiered rewards to ensure profitability, moving beyond simple engagement metrics. The technical necessity of integrating loyalty with CRM systems has become a baseline requirement for achieving a unified customer view. As part of this, creating best practices for mobile loyalty apps is critical for driving adoption and continuous interaction.
  • A major operational concern is using AI to prevent reward fraud, a practice that has proven to be three times more effective than manual reviews. This ties into strategies for reducing program liability, which are essential for financial stability. For growth, companies are exploring building a successful coalition program to expand value for members.
  • Many are also planning the transitioning from points to experiential rewards to foster deeper emotional connections. This is especially relevant for a loyalty program for subscription businesses, where retention is paramount. Firms are refining omnichannel customer recognition strategies to ensure seamless experiences across digital and physical worlds.
  • This is fueled by leveraging zero-party data for personalization, which builds trust and delivers relevance. The use of gamification in retail loyalty programs is proving effective in boosting engagement frequency. For B2B contexts, calculating customer lifetime value in B2B provides a clear metric for investment. Forward-thinking firms are assessing the impact of blockchain on customer loyalty for security and transparency.
  • Furthermore, improving customer engagement with geofencing offers location-based relevance, while analyzing churn with predictive models provides actionable insights for retention teams. Architecturally, implementing a headless loyalty platform offers the flexibility needed for modern commerce. This allows for optimizing card-linked offer campaigns and personalizing rewards based on purchase history.
  • Ultimately, the role of CDP in loyalty management is to unify data, while ensuring compliance with data privacy regulations remains a non-negotiable priority throughout.

What are the key market drivers leading to the rise in the adoption of Loyalty Management Industry?

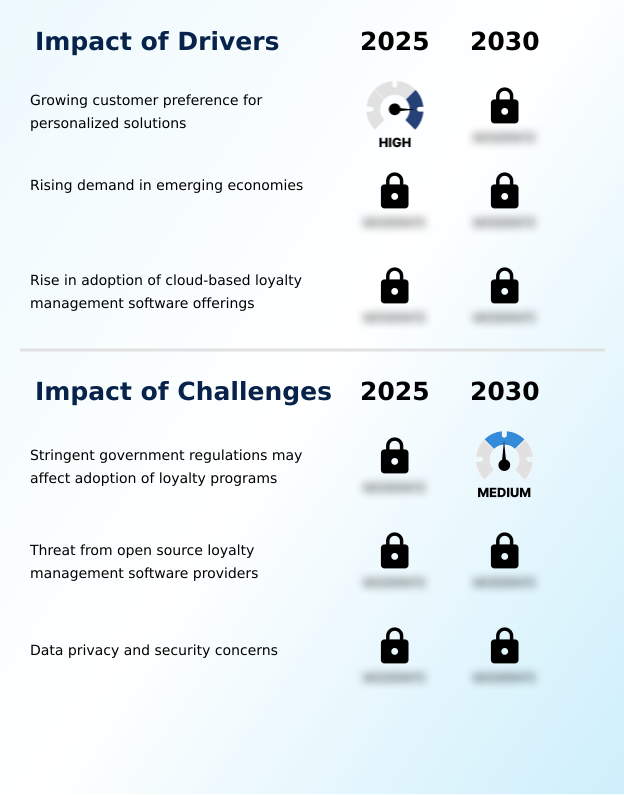
  • The increasing customer preference for personalized solutions that align with individual needs and behaviors is a key driver for the market.

  • The primary driver is the strategic imperative to maximize customer lifetime value (CLV) and boost the overall customer retention rate. Organizations are using behavioral data analytics to inform sophisticated customer segmentation rules, moving beyond basic demographics.
  • A robust customer data platform (CDP) is crucial for this, enabling a granular understanding that fuels a well-defined tiered rewards structure.
  • This data-centric approach results in a measurable average order value (AOV) uplift, with personalized campaigns showing more than double the engagement of generic ones. In addition to transactional gains, companies are now prioritizing emotional loyalty metrics and customer advocacy measurement.
  • This focus extends to B2B channel loyalty programs, where engagement directly impacts sales performance.

What are the market trends shaping the Loyalty Management Industry?

  • The growing application of artificial intelligence is creating a market trend for innovative solutions. This shift is redefining customer engagement through predictive and adaptive technologies.

  • A significant trend is the application of AI, with a hyper-personalization engine becoming standard for delivering AI-powered recommendations. Organizations are using machine learning for propensity modeling to achieve dynamic incentive optimization, improving conversion rates by over 20% compared to static offers.
  • The focus is shifting from transactional value to experiential rewards design, incorporating gamification mechanics and user-generated content (UGC) integration to foster community. Forward-looking companies are exploring blockchain-based rewards and non-fungible token (NFT) rewards to create unique digital assets. Continuous A/B testing for offers allows for data-backed refinement, ensuring programs remain relevant and engaging for customers.

What challenges does the Loyalty Management Industry face during its growth?

  • Stringent government regulations concerning data privacy and usage present a key challenge, potentially affecting the widespread adoption of loyalty programs.

  • A key challenge is managing the complexities of a traditional points-based loyalty system, which includes effective reward liability management and mitigating fraud. Sophisticated fraud detection algorithms are essential to protect program integrity. While churn prediction models and predictive churn analytics are powerful, their effectiveness is constrained by data governance.
  • Implementing privacy-preserving data sharing and federated learning models is becoming critical to navigate stringent regulations, adding layers of technical complexity. Furthermore, initiatives like geofenced offer delivery require explicit user consent, and negative customer feedback analysis shows that privacy concerns can reduce program participation by up to 30%.
  • Accurate redemption velocity tracking is also vital for financial forecasting and preventing system abuse.

Exclusive Technavio Analysis on Customer Landscape

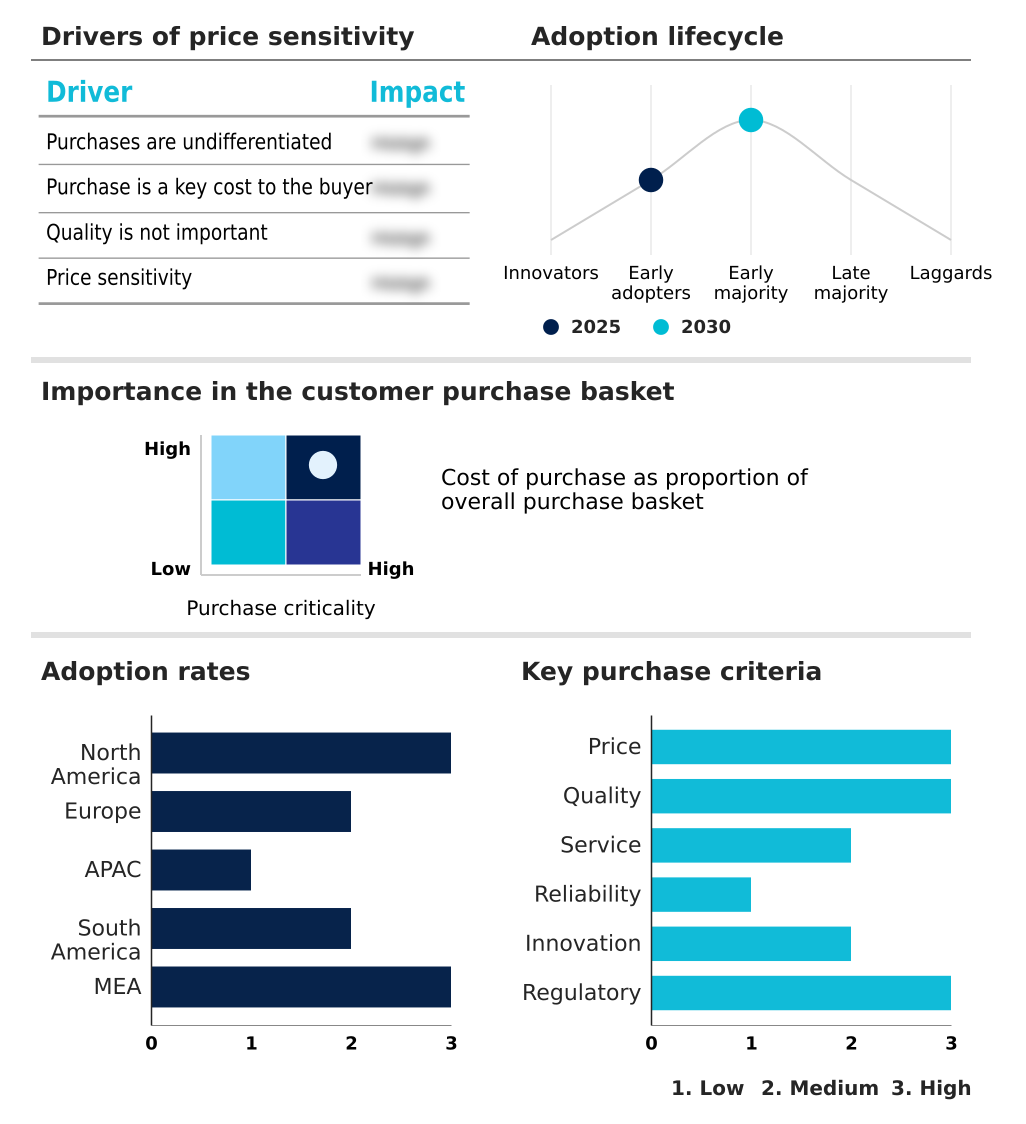
The loyalty management market forecasting report includes the adoption lifecycle of the market, covering from the innovator’s stage to the laggard’s stage. It focuses on adoption rates in different regions based on penetration. Furthermore, the loyalty management market report also includes key purchase criteria and drivers of price sensitivity to help companies evaluate and develop their market growth analysis strategies.

Customer Landscape of Loyalty Management Industry

Competitive Landscape

Companies are implementing various strategies, such as strategic alliances, loyalty management market forecast, partnerships, mergers and acquisitions, geographical expansion, and product/service launches, to enhance their presence in the industry.

Antavo Ltd. - Delivers enterprise loyalty platforms, tiered rewards programs, and omnichannel engagement solutions designed to enhance customer retention and brand affinity.

The industry research and growth report includes detailed analyses of the competitive landscape of the market and information about key companies, including:

  • Antavo Ltd.
  • Bond Brand Loyalty Inc.
  • Braze Inc.
  • Epsilon Data Management LLC
  • HR.COM Ltd.
  • IBM Corp.
  • ITA Group
  • Kobie Marketing Inc.
  • LeadIQ Inc.
  • Loyalty Source
  • LoyaltyLion Ltd.
  • Maritz Motivation Inc.
  • Paytronix Systems Inc.
  • Qualtrics LLC
  • Salesforce Inc.
  • SAP SE
  • SCAYLE GmbH
  • Smile Inc.
  • Social Annex Inc.
  • Women in Cloud LLC

Qualitative and quantitative analysis of companies has been conducted to help clients understand the wider business environment as well as the strengths and weaknesses of key industry players. Data is qualitatively analyzed to categorize companies as pure play, category-focused, industry-focused, and diversified; it is quantitatively analyzed to categorize companies as dominant, leading, strong, tentative, and weak.

Recent Development and News in Loyalty management market

  • In January 2025, SAP introduced an artificial intelligence-powered shopping assistant within its CX AI Toolkit, designed to enhance online shopping through natural language conversations and improve customer retention capabilities.
  • In February 2025, Salesforce expanded its Loyalty Management module with new industry-specific templates for the travel, healthcare, and telecommunications sectors, enabling more agile and scalable program deployment.
  • In April 2025, Kobie Marketing Inc. announced the establishment of a new technology hub in Bengaluru, India, to accelerate the development of its AI-driven loyalty cloud platform and expand its engineering talent.
  • In May 2025, Riyadh Air formed a strategic alliance with Loyalty Juggernaut Inc. to launch its digital loyalty program, utilizing a cloud-native platform to deliver a personalized and digitally integrated travel experience.

Dive into Technavio’s robust research methodology, blending expert interviews, extensive data synthesis, and validated models for unparalleled Loyalty Management Market insights. See full methodology.

Market Scope
Page number 277
Base year 2025
Historic period 2020-2024
Forecast period 2026-2030
Growth momentum & CAGR Accelerate at a CAGR of 15.8%
Market growth 2026-2030 USD 6265.5 million
Market structure Fragmented
YoY growth 2025-2026(%) 13.6%
Key countries US, Canada, Mexico, Germany, UK, France, Italy, Spain, The Netherlands, China, Japan, India, South Korea, Australia, Indonesia, Brazil, Argentina, Chile, Saudi Arabia, UAE, Turkey, South Africa and Israel
Competitive landscape Leading Companies, Market Positioning of Companies, Competitive Strategies, and Industry Risks

Request Free Sample

Research Analyst Overview

  • From an analytical standpoint, the market is pivoting from transactional rewards to strategic, data-driven engagement ecosystems. Central to this shift is the pursuit of higher customer lifetime value (CLV) through a sophisticated hyper-personalization engine. Organizations are implementing a tiered rewards structure and omnichannel rewards program built on a foundation of granular behavioral data analytics.
  • The integration of AI-powered recommendations and predictive churn analytics is no longer a niche capability but a core requirement, with some platforms using churn prediction models to reduce customer attrition by over 20%. The operational backbone for these initiatives is an API-first loyalty architecture that allows for headless commerce integration and real-time point redemption.
  • As the market matures, the focus is broadening to include emotional loyalty metrics, gamification mechanics, blockchain-based rewards, and even non-fungible token (NFT) rewards. Managing reward liability management while enabling features like geofenced offer delivery and subscription-based loyalty within a card-linked offer platform remains a key strategic balancing act, guided by customer segmentation rules and zero-party data collection.
  • This evolution is captured through diligent customer journey mapping and tracking the overall customer engagement score within both B2C and coalition loyalty program frameworks.

What are the Key Data Covered in this Loyalty Management Market Research and Growth Report?

  • What is the expected growth of the Loyalty Management Market between 2026 and 2030?

    • USD 6.27 billion, at a CAGR of 15.8%

  • What segmentation does the market report cover?

    • The report is segmented by Deployment (Cloud-based, and On-premises), End-user (Large enterprises, and Small and medium enterprises), Component (Solution, and Service) and Geography (North America, Europe, APAC, South America, Middle East and Africa)

  • Which regions are analyzed in the report?

    • North America, Europe, APAC, South America and Middle East and Africa

  • What are the key growth drivers and market challenges?

    • Growing customer preference for personalized solutions, Stringent government regulations may affect adoption of loyalty programs

  • Who are the major players in the Loyalty Management Market?

    • Antavo Ltd., Bond Brand Loyalty Inc., Braze Inc., Epsilon Data Management LLC, HR.COM Ltd., IBM Corp., ITA Group, Kobie Marketing Inc., LeadIQ Inc., Loyalty Source, LoyaltyLion Ltd., Maritz Motivation Inc., Paytronix Systems Inc., Qualtrics LLC, Salesforce Inc., SAP SE, SCAYLE GmbH, Smile Inc., Social Annex Inc. and Women in Cloud LLC

Market Research Insights

  • The market's dynamism is fueled by the strategic integration of advanced technologies to enhance customer engagement and measure returns. The adoption of a customer data platform (CDP) is central, enabling a single customer view that has been shown to improve average order value (AOV) uplift by over 15% in targeted campaigns.
  • Effective program ROI calculation is driving investment in platforms that offer superior closed-loop marketing attribution, connecting spend directly to revenue. This focus on measurement is coupled with a push for deeper engagement through experiential rewards design and social loyalty features.
  • Moreover, firms leveraging machine learning for propensity modeling report a customer retention rate that is up to two times higher than those relying on manual segmentation, demonstrating the clear performance advantage of data-driven strategies and robust customer identity resolution.

We can help! Our analysts can customize this loyalty management market research report to meet your requirements.

Get in touch

1. Executive Summary

1.1 Market overview

Executive Summary - Chart on Market Overview
Executive Summary - Data Table on Market Overview
Executive Summary - Chart on Global Market Characteristics
Executive Summary - Chart on Market by Geography
Executive Summary - Chart on Market Segmentation by Deployment
Executive Summary - Chart on Market Segmentation by End-user
Executive Summary - Chart on Market Segmentation by Component
Executive Summary - Chart on Incremental Growth
Executive Summary - Data Table on Incremental Growth
Executive Summary - Chart on Company Market Positioning

2. Technavio Analysis

2.1 Analysis of price sensitivity, lifecycle, customer purchase basket, adoption rates, and purchase criteria

2.2 Criticality of inputs and Factors of differentiation

Chart on Overview on criticality of inputs and factors of differentiation

2.3 Factors of disruption

Chart on Overview on factors of disruption

2.4 Impact of drivers and challenges

Chart on Impact of drivers and challenges in 2025 and 2030

3. Market Landscape

3.1 Market ecosystem

Chart on Parent Market
Data Table on - Parent Market

3.2 Market characteristics

Chart on Market characteristics analysis

3.3 Value chain analysis

Chart on Value chain analysis

4. Market Sizing

4.1 Market definition

Data Table on Offerings of companies included in the market definition

4.2 Market segment analysis

Market segments

4.3 Market size 2025

4.4 Market outlook: Forecast for 2025-2030

Chart on Global - Market size and forecast 2025-2030 ($ million)
Data Table on Global - Market size and forecast 2025-2030 ($ million)
Chart on Global Market: Year-over-year growth 2025-2030 (%)
Data Table on Global Market: Year-over-year growth 2025-2030 (%)

5. Historic Market Size

5.1 Global Loyalty Management Market 2020 - 2024

Historic Market Size - Data Table on Global Loyalty Management Market 2020 - 2024 ($ million)

5.2 Deployment segment analysis 2020 - 2024

Historic Market Size - Deployment Segment 2020 - 2024 ($ million)

5.3 End-user segment analysis 2020 - 2024

Historic Market Size - End-user Segment 2020 - 2024 ($ million)

5.4 Component segment analysis 2020 - 2024

Historic Market Size - Component Segment 2020 - 2024 ($ million)

5.5 Geography segment analysis 2020 - 2024

Historic Market Size - Geography Segment 2020 - 2024 ($ million)

5.6 Country segment analysis 2020 - 2024

Historic Market Size - Country Segment 2020 - 2024 ($ million)

6. Qualitative Analysis

6.1 Impact of AI in the Global Loyalty Management Market

6.2 Impact of Geopolitical Conflicts on Global Loyalty Management Market

7. Five Forces Analysis

7.1 Five forces summary

Five forces analysis - Comparison between 2025 and 2030

7.2 Bargaining power of buyers

Bargaining power of buyers - Impact of key factors 2025 and 2030

7.3 Bargaining power of suppliers

Bargaining power of suppliers - Impact of key factors in 2025 and 2030

7.4 Threat of new entrants

Threat of new entrants - Impact of key factors in 2025 and 2030

7.5 Threat of substitutes

Threat of substitutes - Impact of key factors in 2025 and 2030

7.6 Threat of rivalry

Threat of rivalry - Impact of key factors in 2025 and 2030

7.7 Market condition

Chart on Market condition - Five forces 2025 and 2030

8. Market Segmentation by Deployment

8.1 Market segments

Chart on Deployment - Market share 2025-2030 (%)
Data Table on Deployment - Market share 2025-2030 (%)

8.2 Comparison by Deployment

Chart on Comparison by Deployment
Data Table on Comparison by Deployment

8.3 Cloud-based - Market size and forecast 2025-2030

Chart on Cloud-based - Market size and forecast 2025-2030 ($ million)
Data Table on Cloud-based - Market size and forecast 2025-2030 ($ million)
Chart on Cloud-based - Year-over-year growth 2025-2030 (%)
Data Table on Cloud-based - Year-over-year growth 2025-2030 (%)

8.4 On-premises - Market size and forecast 2025-2030

Chart on On-premises - Market size and forecast 2025-2030 ($ million)
Data Table on On-premises - Market size and forecast 2025-2030 ($ million)
Chart on On-premises - Year-over-year growth 2025-2030 (%)
Data Table on On-premises - Year-over-year growth 2025-2030 (%)

8.5 Market opportunity by Deployment

Market opportunity by Deployment ($ million)
Data Table on Market opportunity by Deployment ($ million)

9. Market Segmentation by End-user

9.1 Market segments

Chart on End-user - Market share 2025-2030 (%)
Data Table on End-user - Market share 2025-2030 (%)

9.2 Comparison by End-user

Chart on Comparison by End-user
Data Table on Comparison by End-user

9.3 Large enterprises - Market size and forecast 2025-2030

Chart on Large enterprises - Market size and forecast 2025-2030 ($ million)
Data Table on Large enterprises - Market size and forecast 2025-2030 ($ million)
Chart on Large enterprises - Year-over-year growth 2025-2030 (%)
Data Table on Large enterprises - Year-over-year growth 2025-2030 (%)

9.4 Small and medium enterprises - Market size and forecast 2025-2030

Chart on Small and medium enterprises - Market size and forecast 2025-2030 ($ million)
Data Table on Small and medium enterprises - Market size and forecast 2025-2030 ($ million)
Chart on Small and medium enterprises - Year-over-year growth 2025-2030 (%)
Data Table on Small and medium enterprises - Year-over-year growth 2025-2030 (%)

9.5 Market opportunity by End-user

Market opportunity by End-user ($ million)
Data Table on Market opportunity by End-user ($ million)

10. Market Segmentation by Component

10.1 Market segments

Chart on Component - Market share 2025-2030 (%)
Data Table on Component - Market share 2025-2030 (%)

10.2 Comparison by Component

Chart on Comparison by Component
Data Table on Comparison by Component

10.3 Solution - Market size and forecast 2025-2030

Chart on Solution - Market size and forecast 2025-2030 ($ million)
Data Table on Solution - Market size and forecast 2025-2030 ($ million)
Chart on Solution - Year-over-year growth 2025-2030 (%)
Data Table on Solution - Year-over-year growth 2025-2030 (%)

10.4 Service - Market size and forecast 2025-2030

Chart on Service - Market size and forecast 2025-2030 ($ million)
Data Table on Service - Market size and forecast 2025-2030 ($ million)
Chart on Service - Year-over-year growth 2025-2030 (%)
Data Table on Service - Year-over-year growth 2025-2030 (%)

10.5 Market opportunity by Component

Market opportunity by Component ($ million)
Data Table on Market opportunity by Component ($ million)

11. Customer Landscape

11.1 Customer landscape overview

Analysis of price sensitivity, lifecycle, customer purchase basket, adoption rates, and purchase criteria

12. Geographic Landscape

12.1 Geographic segmentation

Chart on Market share by geography 2025-2030 (%)
Data Table on Market share by geography 2025-2030 (%)

12.2 Geographic comparison

Chart on Geographic comparison
Data Table on Geographic comparison

12.3 North America - Market size and forecast 2025-2030

Chart on North America - Market size and forecast 2025-2030 ($ million)
Data Table on North America - Market size and forecast 2025-2030 ($ million)
Chart on North America - Year-over-year growth 2025-2030 (%)
Data Table on North America - Year-over-year growth 2025-2030 (%)
Chart on Regional Comparison - North America
Data Table on Regional Comparison - North America

12.3.1 US - Market size and forecast 2025-2030

Chart on US - Market size and forecast 2025-2030 ($ million)
Data Table on US - Market size and forecast 2025-2030 ($ million)
Chart on US - Year-over-year growth 2025-2030 (%)
Data Table on US - Year-over-year growth 2025-2030 (%)

12.3.2 Canada - Market size and forecast 2025-2030

Chart on Canada - Market size and forecast 2025-2030 ($ million)
Data Table on Canada - Market size and forecast 2025-2030 ($ million)
Chart on Canada - Year-over-year growth 2025-2030 (%)
Data Table on Canada - Year-over-year growth 2025-2030 (%)

12.3.3 Mexico - Market size and forecast 2025-2030

Chart on Mexico - Market size and forecast 2025-2030 ($ million)
Data Table on Mexico - Market size and forecast 2025-2030 ($ million)
Chart on Mexico - Year-over-year growth 2025-2030 (%)
Data Table on Mexico - Year-over-year growth 2025-2030 (%)

12.4 Europe - Market size and forecast 2025-2030

Chart on Europe - Market size and forecast 2025-2030 ($ million)
Data Table on Europe - Market size and forecast 2025-2030 ($ million)
Chart on Europe - Year-over-year growth 2025-2030 (%)
Data Table on Europe - Year-over-year growth 2025-2030 (%)
Chart on Regional Comparison - Europe
Data Table on Regional Comparison - Europe

12.4.1 Germany - Market size and forecast 2025-2030

Chart on Germany - Market size and forecast 2025-2030 ($ million)
Data Table on Germany - Market size and forecast 2025-2030 ($ million)
Chart on Germany - Year-over-year growth 2025-2030 (%)
Data Table on Germany - Year-over-year growth 2025-2030 (%)

12.4.2 UK - Market size and forecast 2025-2030

Chart on UK - Market size and forecast 2025-2030 ($ million)
Data Table on UK - Market size and forecast 2025-2030 ($ million)
Chart on UK - Year-over-year growth 2025-2030 (%)
Data Table on UK - Year-over-year growth 2025-2030 (%)

12.4.3 France - Market size and forecast 2025-2030

Chart on France - Market size and forecast 2025-2030 ($ million)
Data Table on France - Market size and forecast 2025-2030 ($ million)
Chart on France - Year-over-year growth 2025-2030 (%)
Data Table on France - Year-over-year growth 2025-2030 (%)

12.4.4 Italy - Market size and forecast 2025-2030

Chart on Italy - Market size and forecast 2025-2030 ($ million)
Data Table on Italy - Market size and forecast 2025-2030 ($ million)
Chart on Italy - Year-over-year growth 2025-2030 (%)
Data Table on Italy - Year-over-year growth 2025-2030 (%)

12.4.5 Spain - Market size and forecast 2025-2030

Chart on Spain - Market size and forecast 2025-2030 ($ million)
Data Table on Spain - Market size and forecast 2025-2030 ($ million)
Chart on Spain - Year-over-year growth 2025-2030 (%)
Data Table on Spain - Year-over-year growth 2025-2030 (%)

12.4.6 The Netherlands - Market size and forecast 2025-2030

Chart on The Netherlands - Market size and forecast 2025-2030 ($ million)
Data Table on The Netherlands - Market size and forecast 2025-2030 ($ million)
Chart on The Netherlands - Year-over-year growth 2025-2030 (%)
Data Table on The Netherlands - Year-over-year growth 2025-2030 (%)

12.5 APAC - Market size and forecast 2025-2030

Chart on APAC - Market size and forecast 2025-2030 ($ million)
Data Table on APAC - Market size and forecast 2025-2030 ($ million)
Chart on APAC - Year-over-year growth 2025-2030 (%)
Data Table on APAC - Year-over-year growth 2025-2030 (%)
Chart on Regional Comparison - APAC
Data Table on Regional Comparison - APAC

12.5.1 China - Market size and forecast 2025-2030

Chart on China - Market size and forecast 2025-2030 ($ million)
Data Table on China - Market size and forecast 2025-2030 ($ million)
Chart on China - Year-over-year growth 2025-2030 (%)
Data Table on China - Year-over-year growth 2025-2030 (%)

12.5.2 Japan - Market size and forecast 2025-2030

Chart on Japan - Market size and forecast 2025-2030 ($ million)
Data Table on Japan - Market size and forecast 2025-2030 ($ million)
Chart on Japan - Year-over-year growth 2025-2030 (%)
Data Table on Japan - Year-over-year growth 2025-2030 (%)

12.5.3 India - Market size and forecast 2025-2030

Chart on India - Market size and forecast 2025-2030 ($ million)
Data Table on India - Market size and forecast 2025-2030 ($ million)
Chart on India - Year-over-year growth 2025-2030 (%)
Data Table on India - Year-over-year growth 2025-2030 (%)

12.5.4 South Korea - Market size and forecast 2025-2030

Chart on South Korea - Market size and forecast 2025-2030 ($ million)
Data Table on South Korea - Market size and forecast 2025-2030 ($ million)
Chart on South Korea - Year-over-year growth 2025-2030 (%)
Data Table on South Korea - Year-over-year growth 2025-2030 (%)

12.5.5 Australia - Market size and forecast 2025-2030

Chart on Australia - Market size and forecast 2025-2030 ($ million)
Data Table on Australia - Market size and forecast 2025-2030 ($ million)
Chart on Australia - Year-over-year growth 2025-2030 (%)
Data Table on Australia - Year-over-year growth 2025-2030 (%)

12.5.6 Indonesia - Market size and forecast 2025-2030

Chart on Indonesia - Market size and forecast 2025-2030 ($ million)
Data Table on Indonesia - Market size and forecast 2025-2030 ($ million)
Chart on Indonesia - Year-over-year growth 2025-2030 (%)
Data Table on Indonesia - Year-over-year growth 2025-2030 (%)

12.6 South America - Market size and forecast 2025-2030

Chart on South America - Market size and forecast 2025-2030 ($ million)
Data Table on South America - Market size and forecast 2025-2030 ($ million)
Chart on South America - Year-over-year growth 2025-2030 (%)
Data Table on South America - Year-over-year growth 2025-2030 (%)
Chart on Regional Comparison - South America
Data Table on Regional Comparison - South America

12.6.1 Brazil - Market size and forecast 2025-2030

Chart on Brazil - Market size and forecast 2025-2030 ($ million)
Data Table on Brazil - Market size and forecast 2025-2030 ($ million)
Chart on Brazil - Year-over-year growth 2025-2030 (%)
Data Table on Brazil - Year-over-year growth 2025-2030 (%)

12.6.2 Argentina - Market size and forecast 2025-2030

Chart on Argentina - Market size and forecast 2025-2030 ($ million)
Data Table on Argentina - Market size and forecast 2025-2030 ($ million)
Chart on Argentina - Year-over-year growth 2025-2030 (%)
Data Table on Argentina - Year-over-year growth 2025-2030 (%)

12.6.3 Chile - Market size and forecast 2025-2030

Chart on Chile - Market size and forecast 2025-2030 ($ million)
Data Table on Chile - Market size and forecast 2025-2030 ($ million)
Chart on Chile - Year-over-year growth 2025-2030 (%)
Data Table on Chile - Year-over-year growth 2025-2030 (%)

12.7 Middle East and Africa - Market size and forecast 2025-2030

Chart on Middle East and Africa - Market size and forecast 2025-2030 ($ million)
Data Table on Middle East and Africa - Market size and forecast 2025-2030 ($ million)
Chart on Middle East and Africa - Year-over-year growth 2025-2030 (%)
Data Table on Middle East and Africa - Year-over-year growth 2025-2030 (%)
Chart on Regional Comparison - Middle East and Africa
Data Table on Regional Comparison - Middle East and Africa

12.7.1 Saudi Arabia - Market size and forecast 2025-2030

Chart on Saudi Arabia - Market size and forecast 2025-2030 ($ million)
Data Table on Saudi Arabia - Market size and forecast 2025-2030 ($ million)
Chart on Saudi Arabia - Year-over-year growth 2025-2030 (%)
Data Table on Saudi Arabia - Year-over-year growth 2025-2030 (%)

12.7.2 UAE - Market size and forecast 2025-2030

Chart on UAE - Market size and forecast 2025-2030 ($ million)
Data Table on UAE - Market size and forecast 2025-2030 ($ million)
Chart on UAE - Year-over-year growth 2025-2030 (%)
Data Table on UAE - Year-over-year growth 2025-2030 (%)

12.7.3 Turkey - Market size and forecast 2025-2030

Chart on Turkey - Market size and forecast 2025-2030 ($ million)
Data Table on Turkey - Market size and forecast 2025-2030 ($ million)
Chart on Turkey - Year-over-year growth 2025-2030 (%)
Data Table on Turkey - Year-over-year growth 2025-2030 (%)

12.7.4 South Africa - Market size and forecast 2025-2030

Chart on South Africa - Market size and forecast 2025-2030 ($ million)
Data Table on South Africa - Market size and forecast 2025-2030 ($ million)
Chart on South Africa - Year-over-year growth 2025-2030 (%)
Data Table on South Africa - Year-over-year growth 2025-2030 (%)

12.7.5 Israel - Market size and forecast 2025-2030

Chart on Israel - Market size and forecast 2025-2030 ($ million)
Data Table on Israel - Market size and forecast 2025-2030 ($ million)
Chart on Israel - Year-over-year growth 2025-2030 (%)
Data Table on Israel - Year-over-year growth 2025-2030 (%)

12.8 Market opportunity by geography

Market opportunity by geography ($ million)
Data Tables on Market opportunity by geography ($ million)

13. Drivers, Challenges, and Opportunity

13.1 Market drivers

Growing customer preference for personalized solutions
Rising demand in emerging economies
Rise in adoption of cloud-based loyalty management software offerings

13.2 Market challenges

Stringent government regulations may affect adoption of loyalty programs
Threat from open source loyalty management software providers
Data privacy and security concerns

13.3 Impact of drivers and challenges

Impact of drivers and challenges in 2025 and 2030

13.4 Market opportunities

Growing application of artificial intelligence for innovative solutions
Growing number of collaborations and acquisitions
Increasing adoption of loyalty management software across various industry verticals

14. Competitive Landscape

14.1 Overview

14.2

Overview on criticality of inputs and factors of differentiation

14.3 Landscape disruption

Overview on factors of disruption

14.4 Industry risks

Impact of key risks on business

15. Competitive Analysis

15.1 Companies profiled

Companies covered

15.2 Company ranking index

15.3 Market positioning of companies

Matrix on companies position and classification

15.4 Antavo Ltd.

Antavo Ltd. - Overview
Antavo Ltd. - Product / Service
Antavo Ltd. - Key offerings
SWOT

15.5 Braze Inc.

Braze Inc. - Overview
Braze Inc. - Product / Service
Braze Inc. - Key offerings
SWOT

15.6 HR.COM Ltd.

HR.COM Ltd. - Overview
HR.COM Ltd. - Product / Service
HR.COM Ltd. - Key offerings
SWOT

15.7 IBM Corp.

IBM Corp. - Overview
IBM Corp. - Business segments
IBM Corp. - Key news
IBM Corp. - Key offerings
IBM Corp. - Segment focus
SWOT

15.8 ITA Group

ITA Group - Overview
ITA Group - Product / Service
ITA Group - Key offerings
SWOT

15.9 Kobie Marketing Inc.

Kobie Marketing Inc. - Overview
Kobie Marketing Inc. - Product / Service
Kobie Marketing Inc. - Key offerings
SWOT

15.10 LeadIQ Inc.

LeadIQ Inc. - Overview
LeadIQ Inc. - Product / Service
LeadIQ Inc. - Key offerings
SWOT

15.11 LoyaltyLion Ltd.

LoyaltyLion Ltd. - Overview
LoyaltyLion Ltd. - Product / Service
LoyaltyLion Ltd. - Key offerings
SWOT

15.12 Maritz Motivation Inc.

Maritz Motivation Inc. - Overview
Maritz Motivation Inc. - Product / Service
Maritz Motivation Inc. - Key offerings
SWOT

15.13 Paytronix Systems Inc.

Paytronix Systems Inc. - Overview
Paytronix Systems Inc. - Product / Service
Paytronix Systems Inc. - Key offerings
SWOT

15.14 Salesforce Inc.

Salesforce Inc. - Overview
Salesforce Inc. - Product / Service
Salesforce Inc. - Key news
Salesforce Inc. - Key offerings
SWOT

15.15 SAP SE

SAP SE - Overview
SAP SE - Business segments
SAP SE - Key news
SAP SE - Key offerings
SAP SE - Segment focus
SWOT

15.16 Smile Inc.

Smile Inc. - Overview
Smile Inc. - Product / Service
Smile Inc. - Key offerings
SWOT

15.17 Social Annex Inc.

Social Annex Inc. - Overview
Social Annex Inc. - Product / Service
Social Annex Inc. - Key offerings
SWOT

15.18 Women in Cloud LLC

Women in Cloud LLC - Overview
Women in Cloud LLC - Product / Service
Women in Cloud LLC - Key offerings
SWOT

16. Appendix

16.1 Scope of the report

Market definition
Objectives
Notes and caveats

16.2 Inclusions and exclusions checklist

Inclusions checklist
Exclusions checklist

16.3 Currency conversion rates for US$

16.4 Research methodology

16.5 Data procurement

Information sources

16.6 Data validation

16.7 Validation techniques employed for market sizing

16.8 Data synthesis

16.9 360 degree market analysis

16.10 List of abbreviations

Research Methodology

Technavio presents a detailed picture of the market by way of study, synthesis, and summation of data from multiple sources. The analysts have presented the various facets of the market with a particular focus on identifying the key industry influencers. The data thus presented is comprehensive, reliable, and the result of extensive research, both primary and secondary.

INFORMATION SOURCES

Primary sources

  • Manufacturers and suppliers
  • Channel partners
  • Industry experts
  • Strategic decision makers

Secondary sources

  • Industry journals and periodicals
  • Government data
  • Financial reports of key industry players
  • Historical data
  • Press releases

DATA ANALYSIS

Data Synthesis

  • Collation of data
  • Estimation of key figures
  • Analysis of derived insights

Data Validation

  • Triangulation with data models
  • Reference against proprietary databases
  • Corroboration with industry experts

REPORT WRITING

Qualitative

  • Market drivers
  • Market challenges
  • Market trends
  • Five forces analysis

Quantitative

  • Market size and forecast
  • Market segmentation
  • Geographical insights
  • Competitive landscape

Interested in this report?

Get your sample now to see our research methodology and insights!

Download Now

Frequently Asked Questions

Loyalty Management market growth will increase by USD 6265.5 million during 2026-2030.

The Loyalty Management market is expected to grow at a CAGR of 15.8% during 2026-2030.

Loyalty Management market is segmented by Deployment (Cloud-based, On-premises) End-user (Large enterprises, Small and medium enterprises) Component (Solution, Service)

Antavo Ltd., Bond Brand Loyalty Inc., Braze Inc., Epsilon Data Management LLC, HR.COM Ltd., IBM Corp., ITA Group, Kobie Marketing Inc., LeadIQ Inc., Loyalty Source, LoyaltyLion Ltd., Maritz Motivation Inc., Paytronix Systems Inc., Qualtrics LLC, Salesforce Inc., SAP SE, SCAYLE GmbH, Smile Inc., Social Annex Inc., Women in Cloud LLC are a few of the key vendors in the Loyalty Management market.

North America will register the highest growth rate of 50.7% among the other regions. Therefore, the Loyalty Management market in North America is expected to garner significant business opportunities for the vendors during the forecast period.

US, Canada, Mexico, Germany, UK, France, Italy, Spain, The Netherlands, China, Japan, India, South Korea, Australia, Indonesia, Brazil, Argentina, Chile, Saudi Arabia, UAE, Turkey, South Africa, Israel

  • Growing customer preference for personalized solutions is the driving factor this market.

The Loyalty Management market vendors should focus on grabbing business opportunities from the Deployment segment as it accounted for the largest market share in the base year.
RIA - Research AI Assistant
Ask RIA