
Managed Multiprotocol Label Switching (MPLS) Market Size 2025-2029
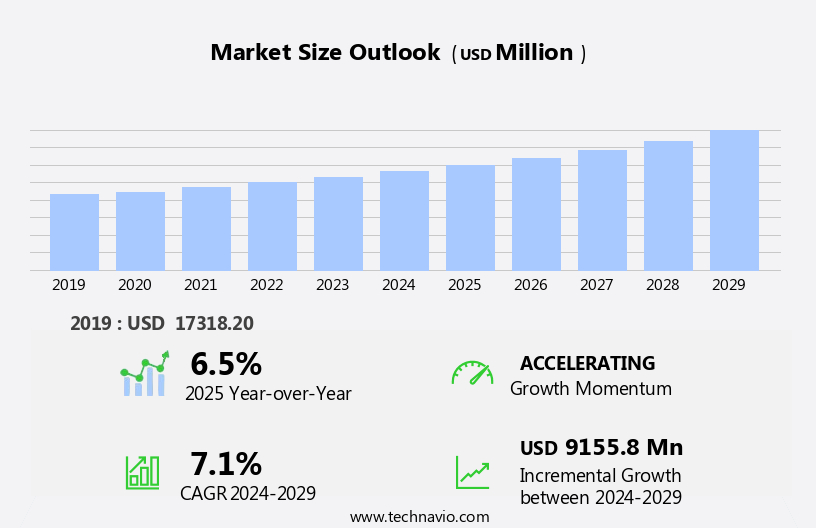
The managed multiprotocol label switching (mpls) market size is forecast to increase by USD 9.16 billion, at a CAGR of 7.1% between 2024 and 2029.
- The market is experiencing significant growth due to the increasing demand for secure and reliable connectivity. Businesses are seeking advanced networking solutions to support their digital transformation initiatives and ensure uninterrupted communication between their distributed workforces and applications. As a result, managed MPLS services have gained popularity for their ability to deliver high-performance, scalable, and secure network connectivity. Another key trend driving the market is the expansion of managed Software-Defined Wide Area Networking (SD-WAN) services. Managed SD-WAN services offer businesses the flexibility to use multiple network connections, including MPLS, to optimize application performance and reduce network costs.
- This hybrid approach to network connectivity is becoming increasingly popular as businesses look to improve their network agility and responsiveness. However, the market also faces challenges. Complex network management remains a significant obstacle for organizations, particularly as they adopt more advanced networking technologies. Ensuring network security and compliance, managing network traffic, and maintaining network performance are critical concerns for businesses seeking to maximize the value of their networking investments. Additionally, the rapid pace of technological change and increasing competition from alternative networking solutions, such as software and Network Function Virtualization (NFV), present significant challenges for market participants. To remain competitive, companies must continuously innovate and adapt to meet the evolving needs of their customers.
What will be the Size of the Managed Multiprotocol Label Switching (MPLS) Market during the forecast period?
Explore in-depth regional segment analysis with market size data - historical 2019-2023 and forecasts 2025-2029 - in the full report.
Request Free Sample
The market continues to evolve, driven by the ever-changing dynamics of network optimization and the increasing adoption of technologies such as hybrid cloud and network management. Network flexibility and monitoring play crucial roles in ensuring seamless integration of these solutions. Carrier Ethernet and OSPF routing enable network efficiency and agility, while DDOS protection and network security services safeguard against potential threats. Network optimization is a continuous process, with businesses seeking to reduce costs, improve performance, and enhance network reliability. Network virtualization, traffic engineering, and data center optimization are essential components of this process. Network segmentation and scalability are also vital for maintaining network security and ensuring business continuity.
Cloud connectivity and disaster recovery are becoming increasingly important, with organizations relying on MPLS to provide reliable and secure access to their cloud environments. BGP routing and network availability are critical for ensuring business continuity, while bandwidth allocation and network cost reduction are essential for optimizing network performance. Next-generation firewalls (NGFW) and software-defined networking (SDN) are emerging technologies that offer enhanced network security and agility. Packet loss and network resilience are critical concerns for businesses, with MPLS VPNs and layer 2 VPNs providing effective solutions. The MPLS market is a dynamic and evolving landscape, with ongoing innovation and development shaping its future. Network agility, network reliability, and network availability are key priorities for businesses, and MPLS continues to play a vital role in meeting these needs.
How is this Managed Multiprotocol Label Switching (MPLS) Industry segmented?
The managed multiprotocol label switching (mpls) industry research report provides comprehensive data (region-wise segment analysis), with forecasts and estimates in "USD million" for the period 2025-2029, as well as historical data from 2019-2023 for the following segments.
- End-user
- IT and telecommunication
- Healthcare
- BFSI
- Retail
- Others
- Service
- Level 2 VPN
- Level 3 VPN
- Geography
- North America
- US
- Canada
- Europe
- France
- Germany
- Italy
- UK
- APAC
- China
- India
- Japan
- South Korea
- Rest of World (ROW)
- North America
. By End-user Insights
The it and telecommunication segment is estimated to witness significant growth during the forecast period.
The market is witnessing significant growth in the IT and telecommunication sector due to the demand for secure, dependable, and efficient data transfer solutions. Managed MPLS networks offer several advantages, including improved network performance, increased scalability, and efficient traffic prioritization. These networks are essential for businesses seeking network optimization, hybrid cloud integration, and disaster recovery solutions. Carrier Ethernet, OSPF routing, and BGP routing are key technologies driving the market's evolution. Network security services, including DDoS protection and next-generation firewalls (NGFW), are also crucial components of managed MPLS offerings. Traffic engineering, packet loss mitigation, and network virtualization are other essential features.
Cisco and Juniper are leading players in the managed MPLS market. Cisco offers a comprehensive range of managed MPLS solutions, including routers and switches, to cater to the diverse needs of IT and telecommunication enterprises. Juniper specializes in high-performance networking solutions, providing managed MPLS services for seamless connectivity and optimized network performance. Network agility, network flexibility, and network switches segmentation are essential for businesses in today's dynamic environment. Managed MPLS networks offer the flexibility to allocate bandwidth and prioritize traffic, ensuring network efficiency and availability. Additionally, MPLS VPNs and Layer 2 VPNs provide secure connectivity for cloud-based applications and data center optimization.
Software-defined networking (SDN) and network function virtualization (NFV) are transforming the networking landscape. Managed MPLS service providers are integrating these technologies to offer more agile, scalable, and cost-effective solutions. The market's future trends include the integration of 5G, edge computing, and the Internet of Things (IoT) to enhance network performance and reliability.
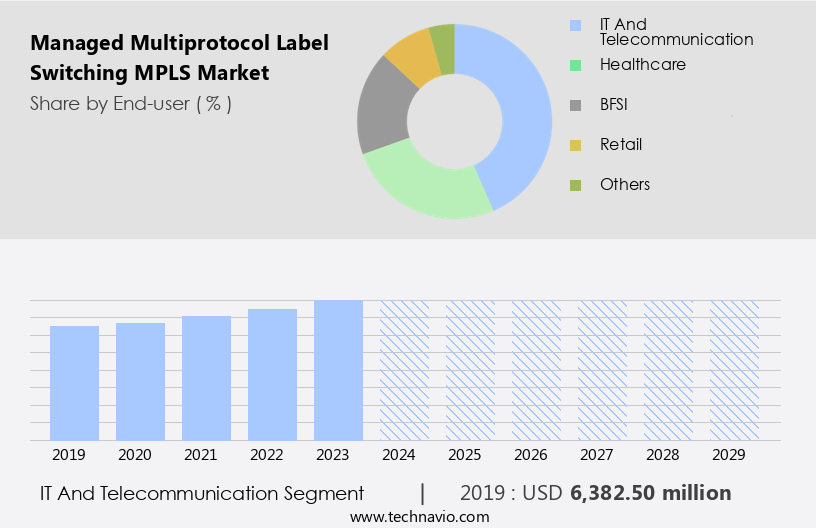
The IT and telecommunication segment was valued at USD 6.38 billion in 2019 and showed a gradual increase during the forecast period.
Regional Analysis
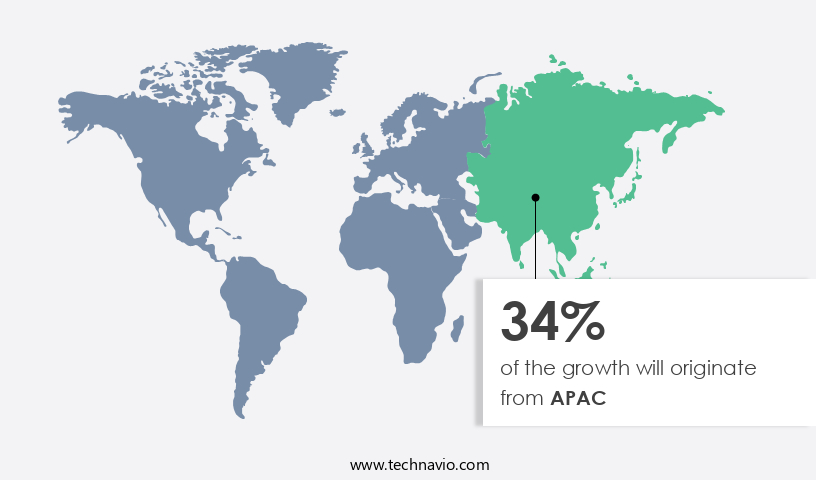
APAC is estimated to contribute 34% to the growth of the global market during the forecast period.Technavio's analysts have elaborately explained the regional trends and drivers that shape the market during the forecast period.
The market in North America is experiencing significant growth due to the increasing demand for secure and dependable network connectivity and the rising adoption of cloud services. Leading companies in the region, such as AT&T and Verizon, offer comprehensive managed MPLS solutions to businesses in various industries, including finance and healthcare. These solutions ensure seamless connectivity, improved network performance, and increased security by leveraging their extensive network infrastructure and expertise. To cater to the evolving needs of businesses, these companies provide additional value-added services, including network maintenance, customer support, and monitoring. Network optimization is a key focus area, with traffic engineering and bandwidth allocation playing essential roles in enhancing network efficiency and scalability.
Carrier Ethernet, OSPF routing, and BGP routing are integral components of these solutions, ensuring network agility and reliability. Network security services, including DDOS protection and next-generation firewalls (NGFW), are also crucial for safeguarding against cyber threats. Data center optimization and disaster recovery are other critical services offered, ensuring business continuity and network availability. Network virtualization, MPLS VPN, and layer 2 VPN are additional offerings that enable network segmentation and cost reduction. Overall, the managed MPLS market in North America is witnessing continuous growth, driven by the need for network flexibility, network monitoring, and network resilience.
Market Dynamics
Our researchers analyzed the data with 2024 as the base year, along with the key drivers, trends, and challenges. A holistic analysis of drivers will help companies refine their marketing strategies to gain a competitive advantage.
What are the key market drivers leading to the rise in the adoption of Managed Multiprotocol Label Switching (MPLS) Industry?
- The escalating need for secure and dependable connectivity serves as the primary market catalyst. The market is experiencing significant growth due to the increasing demand for network reliability and security from businesses. MPLS services provide a dependable and efficient solution for linking different organizational locations, ensuring seamless data transfer and communication. With the global expansion of businesses and the reliance on critical applications, a robust network infrastructure is essential. Managed MPLS services cater to this need by offering prioritization capabilities, Quality of Service (QoS) assurance, and adequate bandwidth. Moreover, these services enhance network segmentation and scalability, making them an ideal choice for businesses seeking secure connection solutions.
- Network availability is another critical factor, and managed MPLS services guarantee uptime, minimizing potential downtime and reducing business disruption. Software-defined networking (SDN) integration further enhances network flexibility and agility, enabling businesses to adapt to changing requirements. Overall, the managed MPLS market is poised for continued growth as businesses prioritize network reliability, security, and scalability.
What are the market trends shaping the Managed Multiprotocol Label Switching (MPLS) Industry?
- Managed Software-Defined Wide Area Network (SD-WAN) services are experiencing significant expansion in today's market. This trend reflects the increasing demand for advanced network management solutions that optimize connectivity and improve application performance.
- To enhance the efficiency, cost-effectiveness, and application prioritization of their wide-area networks (WANs), businesses are increasingly adopting integrated SD-WAN solutions in the market. Service providers of managed MPLS are responding to this demand by offering full SD-WAN solutions that combine the benefits of MPLS with the agility of software-defined networking. These integrated offerings enable businesses to reduce expenses, boost network performance, and manage applications across multiple sites effectively. By employing SD-WAN technologies, businesses can dynamically allocate bandwidth, prioritize critical applications, and seamlessly integrate various network connections.
- Furthermore, these solutions offer network monitoring capabilities, carrier Ethernet support, DDOS protection, and OSPF routing for enhanced network management and flexibility. Network optimization is a key focus for organizations, and the integration of MPLS and SD-WAN is proving to be a powerful solution for achieving this goal.
What challenges does the Managed Multiprotocol Label Switching (MPLS) Industry face during its growth?
- Complex network management poses a significant challenge to the industry's growth, as effective management of intricate systems is essential for businesses to thrive in today's interconnected world.
- Managing a global Managed Multiprotocol Label Switching (MPLS) network presents complex challenges due to its extensive size and geographic dispersion. Network configuration becomes intricate, requiring expertise and careful planning to coordinate settings across multiple sites and ensure seamless connectivity. Troubleshooting becomes a significant undertaking when issues arise throughout the network, necessitating experienced network engineers and substantial resources to isolate problems, identify their origins, and implement effective solutions. Moreover, continuous monitoring, performance optimization, and security enforcement across the entire MPLS infrastructure are essential. Network agility is crucial in today's business environment, with cloud connectivity, disaster recovery, and business continuity becoming increasingly important.
- MPLS networks offer layer 3 VPN capabilities, enabling secure and efficient connectivity between sites. However, network security remains a top priority, requiring advanced security protocols and BGP routing to protect against potential threats. Bandwidth allocation and network performance are also critical factors in the MPLS market. Network administrators must ensure adequate bandwidth for mission-critical applications and prioritize traffic to maintain optimal network performance. Overall, managing a global MPLS network requires a robust and harmonious approach, emphasizing network flexibility, security, and efficiency. In conclusion, recent research indicates that the MPLS market will continue to grow, driven by the increasing demand for network agility, cloud connectivity, and business continuity solutions.
Exclusive Customer Landscape
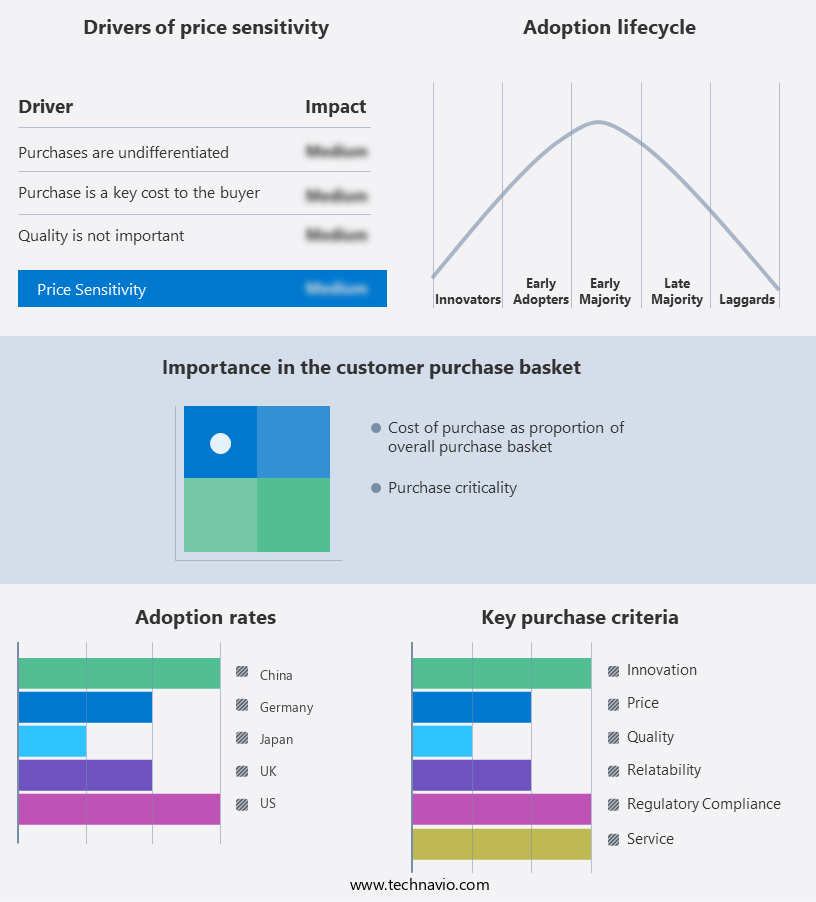
The managed multiprotocol label switching (mpls) market forecasting report includes the adoption lifecycle of the market, covering from the innovator's stage to the laggard's stage. It focuses on adoption rates in different regions based on penetration. Furthermore, the managed multiprotocol label switching (mpls) market report also includes key purchase criteria and drivers of price sensitivity to help companies evaluate and develop their market growth analysis strategies.
Customer Landscape
Key Companies & Market Insights
Companies are implementing various strategies, such as strategic alliances, managed multiprotocol label switching (mpls) market forecast, partnerships, mergers and acquisitions, geographical expansion, and product/service launches, to enhance their presence in the industry.
AT and T Inc. - This company specializes in providing a range of advanced networking solutions. Our offerings encompass Managed MPLS services, such as ONE unified, Virtual Private Network (VPN) Business solutions, Networking services, Wireless services, and Voice collaboration.
The industry research and growth report includes detailed analyses of the competitive landscape of the market and information about key companies, including:
- AT and T Inc.
- Bharat Sanchar Nigam Ltd.
- Bharti Airtel Ltd.
- BT Group Plc
- Cisco Systems Inc.
- ERNET India
- Forcepoint LLC
- International Business Machines Corp.
- Juniper Networks Inc.
- Lumen Technologies Inc.
- NTT Communications Corp.
- Orange SA
- Palo Alto Networks Inc.
- Reliance Industries Ltd.
- Syringa Networks LLC
- T Mobile US Inc.
- Telefonaktiebolaget LM Ericsson
- Verizon Communications Inc.
- Versa Networks Inc.
- Vodafone Group Plc
Qualitative and quantitative analysis of companies has been conducted to help clients understand the wider business environment as well as the strengths and weaknesses of key industry players. Data is qualitatively analyzed to categorize companies as pure play, category-focused, industry-focused, and diversified; it is quantitatively analyzed to categorize companies as dominant, leading, strong, tentative, and weak.
Recent Development and News in Managed Multiprotocol Label Switching (MPLS) Market
- In February 2024, Cisco Systems, a leading network technology company, introduced its innovative MPLS solution, Cisco SD-WAN with Intelligent Site Connect, designed to optimize network performance and simplify management for enterprises. This new offering combines MPLS with software-defined wide area networking (SD-WAN) technology to provide superior application performance and improved network agility (Cisco Press Release, 2024).
- In June 2024, Juniper Networks and Microsoft announced a strategic partnership to integrate Juniper's MPLS VPN services with Microsoft Azure to enhance the connectivity options for Azure customers. This collaboration aims to provide seamless, secure, and high-performance connectivity between enterprise networks and the cloud (Juniper Networks Press Release, 2024).
- In October 2024, Nokia completed the acquisition of Alcatel Submarine Networks, a leading provider of subsea fiber-optic cable networks. This acquisition strengthened Nokia's position in the global telecommunications market and expanded its MPLS offerings, particularly in the undersea cable segment (Nokia Press Release, 2024).
- In March 2025, Verizon Communications and Google Cloud announced a significant collaboration to offer managed MPLS services integrated with Google Cloud Platform. This partnership aims to provide enterprises with a unified solution for their network and cloud infrastructure needs, enabling improved application performance and enhanced security (Verizon Press Release, 2025).
Research Analyst Overview
- The market is experiencing significant evolution, driven by the integration of advanced technologies such as network automation, MPLS Edge, and MPLS over IP and Ethernet. Bandwidth on demand and network assurance are becoming essential components, enabling businesses to adapt to fluctuating network requirements and ensure service level agreements. MPLS for compliance is another trend, as organizations seek to meet regulatory mandates and industry standards. Network virtualization platforms, MPLS over SONET and DWDM, and MPLS core enhance network efficiency and scalability.
- Network analytics and orchestration enable real-time monitoring and automation, while cloud-based MPLS solutions offer flexibility and cost savings. Traffic shaping is another crucial aspect, ensuring optimal network performance and enabling prioritization of mission-critical applications. These trends reflect the ongoing transformation of the MPLS market, catering to the evolving needs of US businesses.
Dive into Technavio's robust research methodology, blending expert interviews, extensive data synthesis, and validated models for unparalleled Managed Multiprotocol Label Switching (MPLS) Market insights. See full methodology.
|
Market Scope |
|
|
Report Coverage |
Details |
|
Page number |
197 |
|
Base year |
2024 |
|
Historic period |
2019-2023 |
|
Forecast period |
2025-2029 |
|
Growth momentum & CAGR |
Accelerate at a CAGR of 7.1% |
|
Market growth 2025-2029 |
USD 9155.8 million |
|
Market structure |
Fragmented |
|
YoY growth 2024-2025(%) |
6.5 |
|
Key countries |
US, Canada, China, UK, Germany, Japan, India, France, Italy, and South Korea |
|
Competitive landscape |
Leading Companies, Market Positioning of Companies, Competitive Strategies, and Industry Risks |
What are the Key Data Covered in this Managed Multiprotocol Label Switching (MPLS) Market Research and Growth Report?
- CAGR of the Managed Multiprotocol Label Switching (MPLS) industry during the forecast period
- Detailed information on factors that will drive the growth and forecasting between 2025 and 2029
- Precise estimation of the size of the market and its contribution of the industry in focus to the parent market
- Accurate predictions about upcoming growth and trends and changes in consumer behaviour
- Growth of the market across North America, Europe, APAC, Middle East and Africa, and South America
- Thorough analysis of the market's competitive landscape and detailed information about companies
- Comprehensive analysis of factors that will challenge the managed multiprotocol label switching (mpls) market growth of industry companies
We can help! Our analysts can customize this managed multiprotocol label switching (mpls) market research report to meet your requirements.
 RIA -
RIA - 
