Material Handling Equipment In Biomass Power Plant Market Analysis Europe, APAC, North America, South America, Middle East and Africa - US, Germany, China, France, India - Size and Forecast 2024-2028

Material Handling Equipment In Biomass Power Plant Market Analysis Europe, APAC, North America, South America, Middle East and Africa - US, Germany, China, France, India - Size and Forecast 2024-2028

Published: Aug 2024 156 Pages SKU: IRTNTR73501

Market Overview at a Glance

$589 Mn
Market Opportunity
4.5%
CAGR
4.23
YoY growth 2023-2024(%)

Material Handling Equipment In Biomass Power Plant Market Size 2024-2028

The material handling equipment in biomass power plant market size is forecast to increase by USD 589 million at a CAGR of 4.5% between 2023 and 2028.

  • The market witnessed an upward trend In the adoption of equipment due to their ability to enhance the efficiency of the combustion process. With the increasing focus on managing municipal solid waste, the demand is expected to grow. Logistics infrastructure, including cranes and lifting equipment, are integral to the positioning and handling of large biomass cargo.  Moreover, the underdeveloped supply chain and market for biomass in several countries create opportunities for market growth. Effective material handling is crucial for the smooth functioning of biomass power plants, as it ensures the timely and efficient transfer of biomass from the storage area to the boiler. This not only improves the overall performance of the power plant but also reduces operational costs. In summary, the market is driven by the need for increased efficiency, waste management, and supply chain development.

What will be the Size of the Material Handling Equipment In Biomass Power Plant Market During the Forecast Period?

Material Handling Equipment In Biomass Power Plant Market Size

 Request Free Sample

  • The market relies heavily on equipment to regulate the flow of cargo and ensure efficient energy production. Mechanical equipment, including transportation, positioning, and cargo shaping systems, are essential for the movement and manipulation of biomass materials. Storage equipment and warehouse management systems play a critical role in regulating biomass consumption and disposal. Fully automated facilities are increasingly popular In the biomass power industry to enhance productivity and worker safety. The growing trend towards e-commerce and online shopping platforms has also increased the demand for advanced solutions In the biomass power sector.
  • Industries such as pharmaceutical, industrial equipment, machinery, wholesaling, consumer goods, semiconductor, and mining also rely on equipment for the transportation and storage of their products. Continuous handling equipment, such as conveyor belts and industrial trucks, are commonly used to streamline the process and optimize production. Overall, the market is dynamic and evolving, driven by the need for increased efficiency, productivity, and safety.

How is this Industry segmented and which is the largest segment?

The research report provides comprehensive data (region-wise segment analysis), with forecasts and estimates in "USD million" for the period 2024-2028, as well as historical data from 2018-2022 for the following segments.

  • Product
    • Digestors
    • Feeder systems
    • Silos and storage tanks
    • Chippers
    • Grinders
  • Geography
    • Europe
      • Germany
      • France
    • APAC
      • China
      • India
    • North America
      • US
    • South America
    • Middle East and Africa

By Product Insights

  • The digestors segment is estimated to witness significant growth during the forecast period.

Biomass power plants convert organic matter into biogas, such as methane, to increase the calorific value and generate more power. Due to the high moisture content in most biomass sources, their energy content is often insufficient for self-sustained combustion. To address this, biomass is decomposed through digester processes to produce methane, which has a higher calorific value and can sustain combustion. This approach prevents heat loss due to biomass moisture, thereby enhancing power generation from a given biomass quantity. Key equipment In these processes includes transport, positioning, and lifting equipment, such as cranes and industrial trucks, as well as cargo shaping and storage equipment.

The logistics infrastructure, including warehouse management and last-mile delivery systems, is also crucial. The market is significant, with applications spanning various industries, including consumer goods, semiconductor, mining, robotics, pharmaceutical, food retail, and industrial equipment manufacturing. The growth of e-commerce and online shopping platforms further increases the demand for efficient material handling solutions.

Material Handling Equipment In Biomass Power Plant Market Size

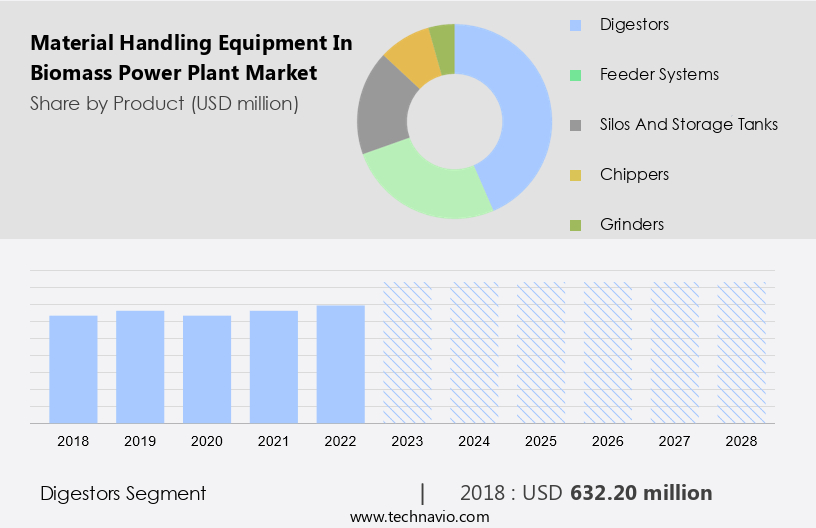
Get a glance at the  Material Handling Equipment In Biomass Power Plant Industry report of share of various segments Request Free Sample

The digestors segment was valued at USD 632.20 million in 2018 and showed a gradual increase during the forecast period.

Regional Analysis

  • APAC is estimated to contribute 33% to the growth of the global market during the forecast period.

Technavio's analysts have elaborately explained the regional trends and drivers that shape the market during the forecast period.

Material Handling Equipment In Biomass Power Plant Market Share by Geography

For more insights on the market share of various regions, Request Free Sample

The European biomass power generation industry is led by Germany, the UK, Sweden, and Italy. Biomass power plants In these countries primarily use wood-based biomass or biogas derived from organic matter for electricity production. The growth of the market is driven by the increasing use of solid biomass, such as wood pellets and biogas. This trend is influenced by the Renewable Energy Directive of Europe, which was issued in 2009. Equipment types, including transport, positioning, cargo shaping, and storage equipment, are essential for the efficient handling of biomass in power plants. Additionally, the rise of e-commerce and online shopping platforms necessitates advanced logistics infrastructure, last-mile delivery, and automated mobile robots for the seamless movement of consumer goods. The biomass power sector also encompasses industries such as semiconductor, mining, robotics, pharmaceutical, food retail, and wholesaling, all requiring specialization. Worker safety and fully automated facilities are paramount considerations In the industry.

Market Dynamics

Our  researchers analyzed the data with 2023 as the base year, along with the key drivers, trends, and challenges. A holistic analysis of drivers will help companies refine their marketing strategies to gain a competitive advantage.

What are the key market drivers leading to the rise In the adoption of Material Industry?

Material handling equipment increases efficiency of combustion process in a biomass power plant is the key driver of the market.

  • Biomass power plants utilize mechanical equipment for transporting, regulating, protecting, and disposing of biomass material. Transportation equipment, such as conveyor belts and automated mobile robots, move biomass from storage areas to processing units. Positioning equipment, including cranes and lifting equipment, are essential for accurately placing biomass into power generation systems. Cargo shaping equipment, like grinders and shredders, prepare biomass for efficient consumption. Storage equipment, including silos and warehouses, maintain biomass until it is ready for processing. Warehouse management and logistics infrastructure are crucial for ensuring a consistent supply of biomass to power plants. E-commerce growth and last-mile delivery require advanced equipment, such as industrial trucks and continuous handling equipment, to efficiently transport biomass from the power plant to distribution centers.
  • In various industries, including consumer goods, semiconductor, mining, robotics, pharmaceutical, food retail, and wholesaling, biomass power plants provide industrial equipment and machinery with a sustainable energy source. Baggage handling systems in airports and baggage handling in warehouses also benefit from the use. The market is continually evolving, with a focus on fully automated facilities and worker safety. Automated mobile robots and continuous handling equipment are increasingly being adopted to reduce labor costs and improve efficiency. The integration of robotics and automation in plants enhances productivity and lowers operational costs. In summary, biomass power plants play a vital role In the energy sector by providing a sustainable and renewable energy source. Mechanical handling equipment, including transportation, positioning, cargo shaping, storage, and warehouse management equipment, are essential components of biomass power plants. The market is growing, driven by the increasing demand for sustainable energy sources and the adoption of advanced handling equipment.

What are the market trends shaping the Material Handling Equipment In Biomass Power Plant Industry?

The increasing requirement of managing municipal solid waste is the upcoming market trend.

  • Material handling equipment plays a crucial role In the market, facilitating the transport, regulation, protection, and disposal of cargo. Mechanical equipment, such as cranes and lifting equipment, are essential for positioning and moving heavy components within the power plant. Transportation equipment, including conveyor belts and automated mobile robots, streamline the transportation of biomass materials. Cargo shaping equipment ensures the uniform shape and size of biomass before it enters the power plant. Storage equipment, including silos and warehouses, are integral to the plant's logistics infrastructure. Warehouse management systems and e-commerce growth require efficient last-mile delivery solutions, making industrial trucks and baggage handling systems valuable additions to the material handling equipment landscape.
  • The mining, semiconductor, pharmaceutical, food retail, and industrial sectors heavily rely on material handling equipment to maintain their operations. Robotics and worker safety are critical considerations in fully automated facilities. E-commerce and online shopping platforms have accelerated the demand for efficient material handling equipment, particularly In the last-mile delivery sector. The relationship between waste generation and income level is significant, with developing countries producing the majority of the world's waste due to increasing consumption. Income level changes influence waste generation differently at various income levels, with low-income countries initially experiencing a reduction in waste generation before a faster increase. Material handling equipment is indispensable in various industries, including plants, where it ensures the efficient and safe transport, regulation, protection, and disposal of biomass materials. The growing demand for e-commerce and last-mile delivery solutions further focuses on the importance of material handling equipment In the logistics sector.

What challenges does the Material Handling Equipment In Biomass Power Plant Industry face during its growth?

Underdeveloped supply chain and markets for biomass in various countries are key challenges affecting the industry's growth.

  • These plants utilize various types of mechanical equipment for transporting, regulating, protecting, and disposing of biomass material. Transportation equipment, such as conveyor belts and trucks, move the biomass from the point of delivery to the power plant. Positioning equipment, including cranes and lifting equipment, are used to lift and maneuver heavy biomass into place. Cargo shaping equipment, like grinders and shredders, prepare the biomass for consumption by converting it into a consistent size and shape. Storage equipment, such as silos and bunkers, hold the biomass until it's ready to be burned. Warehouse management and logistics infrastructure are crucial for efficiently handling and organizing the biomass.
  • E-commerce growth and last-mile delivery have led to an increased demand for automated mobile robots and other handling equipment In the industry. Consumer goods, semiconductor, mining, robotics, pharmaceutical, food retail, and other industries rely on industrial equipment and machinery for their operations. Continuous handling equipment, including conveyor belts and industrial trucks, streamline the production process. Baggage handling systems are essential in transportation hubs to move large volumes of luggage efficiently. Worker safety is a top priority, leading to the adoption of fully automated facilities and advanced safety features in handling equipment. The industry is constantly evolving to meet the demands of various sectors, from e-commerce to industrial production.

Exclusive Customer Landscape

The material handling equipment in plant market forecasting report includes the adoption lifecycle of the market, market growth and forecasting, covering from the innovator's stage to the laggard's stage. It focuses on adoption rates in different regions based on penetration. Furthermore, the market report also includes key purchase criteria and drivers of price sensitivity to help companies evaluate and develop their market growth analysis strategies.

Material Handling Equipment In Biomass Power Plant Market Share by Geography

 Customer Landscape

Key Companies & Market Insights

Companies are implementing various strategies, such as strategic alliances, material handling equipment in biomass power plant market forecast, partnerships, mergers and acquisitions, geographical expansion, and product/service launches, to enhance their presence In the industry.

The industry research and growth report includes detailed analyses of the competitive landscape of the market and information about key companies, including:

  • Amandus Kahl GmbH and Co. KG
  • Andritz AG
  • Astec Industries Inc
  • Babcock and Wilcox Enterprises Inc.
  • Dust Solutions Inc.
  • Evoqua Water Technologies LLC
  • General Kinematics Corp.
  • MAX Automation SE
  • RUD Ketten Rieger and Dietz GmbH u Co. KG
  • Schenck Process Holding GmbH
  • Terex Corp.
  • ZE ENERGY Inc.

Qualitative and quantitative analysis of companies has been conducted to help clients understand the wider business environment as well as the strengths and weaknesses of key industry players. Data is qualitatively analyzed to categorize companies as pure play, category-focused, industry-focused, and diversified; it is quantitatively analyzed to categorize companies as dominant, leading, strong, tentative, and weak.

Research Analyst Overview

In the realm of biomass power generation, the role of material handling equipment is paramount in ensuring the efficient and effective conversion of biomass into electricity. This critical infrastructure facilitates the transport, regulation, protection, and disposal of biomass cargo, enabling the smooth operation of power plants. Material handling equipment encompasses a diverse range of machinery, including transportation equipment, positioning equipment, and cargo shaping equipment. These essential components facilitate the movement and manipulation of biomass within the power generation process. Transportation equipment plays a pivotal role In the logistics infrastructure of biomass power plants. It includes trucks, trains, and ships, which transport raw biomass from various sources to the power plant. This equipment must be strong and reliable, capable of handling the unique challenges posed by biomass cargo. Positioning equipment, such as cranes and lifting equipment, are utilized to accurately place biomass into the power generation process. Continuous handling equipment, including conveyor belts and pneumatic systems, ensure a steady flow of biomass throughout the facility. Storage equipment is another crucial aspect of material handling in biomass power generation.

Proper storage solutions are necessary to maintain the quality and integrity of the biomass until it is ready for processing. Warehouse management systems and automated mobile robots optimize the storage and retrieval process, maximizing efficiency and minimizing labor costs. The growth of e-commerce and online shopping platforms has led to increased demand for material handling equipment in various industries, including consumer goods, semiconductor manufacturing, mining, and pharmaceuticals. Robotics and automation have become increasingly prevalent In these sectors, enhancing worker safety and productivity. In fully automated facilities, material handling equipment operates in a seamless, integrated system. Industrial trucks, forklifts, and baggage handling systems work in harmony to transport and position cargo, ensuring the smooth flow of goods throughout the facility. The food retail sector also relies heavily on material handling equipment for the efficient movement and storage of perishable goods.

Proper handling and temperature control are essential to maintaining product quality and reducing waste. Machinery and industrial equipment manufacturers continue to innovate, developing new solutions to meet the evolving demands of various industries. Wholesaling and distribution channels have adapted to these advancements, ensuring that material handling equipment remains a vital component of the global supply chain. In summary, material handling equipment plays a vital role in the biomass power generation industry, enabling the efficient and effective conversion of biomass into electricity. The diverse range of equipment, including transportation, positioning, and storage solutions, ensures the smooth operation of power plants and the optimization of logistics infrastructure across various industries. As technology continues to evolve, material handling equipment will remain a critical component of the global supply chain, driving innovation and productivity In the biomass power generation sector and beyond.

Market Scope

Report Coverage

Details

Page number

156

Base year

2023

Historic period

2018-2022

Forecast period

2024-2028

Growth momentum & CAGR

Accelerate at a CAGR of 4.5%

Market growth 2024-2028

USD 589 million

Market structure

Fragmented

YoY growth 2023-2024(%)

4.23

Key countries

US, Germany, China, France, and India

Competitive landscape

Leading Companies, Market Positioning of Companies, Competitive Strategies, and Industry Risks

Request Free Sample

What are the Key Data Covered in this Material Handling Equipment In Biomass Power Plant Market Research and Growth Report?

  • CAGR of the Material Handling Equipment In Biomass Power Plant industry during the forecast period
  • Detailed information on factors that will drive the growth and forecasting between 2024 and 2028
  • Precise estimation of the size of the market and its contribution of the industry in focus to the parent market
  • Accurate predictions about upcoming growth and trends and changes in consumer behaviour
  • Growth of the market across Europe, APAC, North America, South America, and Middle East and Africa
  • Thorough analysis of the market's competitive landscape and detailed information about companies
  • Comprehensive analysis of factors that will challenge the material handling equipment in biomass power plant market growth of industry companies

We can help! Our analysts can customize this material handling equipment in biomass power plant market research report to meet your requirements.

Get in touch

1 Executive Summary

  • 1.1 Market overview
    • Executive Summary - Chart on Market Overview
    • Executive Summary - Data Table on Market Overview
    • Executive Summary - Chart on Global Market Characteristics
    • Executive Summary - Chart on Market by Geography
    • Executive Summary - Chart on Market Segmentation by Product
    • Executive Summary - Chart on Incremental Growth
    • Executive Summary - Data Table on Incremental Growth
    • Executive Summary - Chart on Company Market Positioning

2 Market Landscape

  • 2.1 Market ecosystem
    • Parent Market
    • Data Table on - Parent Market
  • 2.2 Market characteristics
    • Market characteristics analysis
  • 2.3 Value chain analysis
    • Value Chain Analysis

3 Market Sizing

  • 3.1 Market definition
    • Offerings of companies included in the market definition
  • 3.2 Market segment analysis
    • Market segments
  • 3.3 Market size 2023
    • 3.4 Market outlook: Forecast for 2023-2028
      • Chart on Global - Market size and forecast 2023-2028 ($ million)
      • Data Table on Global - Market size and forecast 2023-2028 ($ million)
      • Chart on Global Market: Year-over-year growth 2023-2028 (%)
      • Data Table on Global Market: Year-over-year growth 2023-2028 (%)

    4 Historic Market Size

    • 4.1 Global Material Handling Equipment Market In Biomass Power Plant 2018 - 2022
      • Historic Market Size - Data Table on Global Material Handling Equipment Market In Biomass Power Plant 2018 - 2022 ($ million)
    • 4.2 Product segment analysis 2018 - 2022
      • Historic Market Size - Product Segment 2018 - 2022 ($ million)
    • 4.3 Geography segment analysis 2018 - 2022
      • Historic Market Size - Geography Segment 2018 - 2022 ($ million)
    • 4.4 Country segment analysis 2018 - 2022
      • Historic Market Size - Country Segment 2018 - 2022 ($ million)

    5 Five Forces Analysis

    • 5.1 Five forces summary
      • Five forces analysis - Comparison between 2023 and 2028
    • 5.2 Bargaining power of buyers
      • Bargaining power of buyers - Impact of key factors 2023 and 2028
    • 5.3 Bargaining power of suppliers
      • Bargaining power of suppliers - Impact of key factors in 2023 and 2028
    • 5.4 Threat of new entrants
      • Threat of new entrants - Impact of key factors in 2023 and 2028
    • 5.5 Threat of substitutes
      • Threat of substitutes - Impact of key factors in 2023 and 2028
    • 5.6 Threat of rivalry
      • Threat of rivalry - Impact of key factors in 2023 and 2028
    • 5.7 Market condition
      • Chart on Market condition - Five forces 2023 and 2028

    6 Market Segmentation by Product

    • 6.1 Market segments
      • Chart on Product - Market share 2023-2028 (%)
      • Data Table on Product - Market share 2023-2028 (%)
    • 6.2 Comparison by Product
      • Chart on Comparison by Product
      • Data Table on Comparison by Product
    • 6.3 Digestors - Market size and forecast 2023-2028
      • Chart on Digestors - Market size and forecast 2023-2028 ($ million)
      • Data Table on Digestors - Market size and forecast 2023-2028 ($ million)
      • Chart on Digestors - Year-over-year growth 2023-2028 (%)
      • Data Table on Digestors - Year-over-year growth 2023-2028 (%)
    • 6.4 Feeder systems - Market size and forecast 2023-2028
      • Chart on Feeder systems - Market size and forecast 2023-2028 ($ million)
      • Data Table on Feeder systems - Market size and forecast 2023-2028 ($ million)
      • Chart on Feeder systems - Year-over-year growth 2023-2028 (%)
      • Data Table on Feeder systems - Year-over-year growth 2023-2028 (%)
    • 6.5 Silos and storage tanks - Market size and forecast 2023-2028
      • Chart on Silos and storage tanks - Market size and forecast 2023-2028 ($ million)
      • Data Table on Silos and storage tanks - Market size and forecast 2023-2028 ($ million)
      • Chart on Silos and storage tanks - Year-over-year growth 2023-2028 (%)
      • Data Table on Silos and storage tanks - Year-over-year growth 2023-2028 (%)
    • 6.6 Chippers - Market size and forecast 2023-2028
      • Chart on Chippers - Market size and forecast 2023-2028 ($ million)
      • Data Table on Chippers - Market size and forecast 2023-2028 ($ million)
      • Chart on Chippers - Year-over-year growth 2023-2028 (%)
      • Data Table on Chippers - Year-over-year growth 2023-2028 (%)
    • 6.7 Grinders - Market size and forecast 2023-2028
      • Chart on Grinders - Market size and forecast 2023-2028 ($ million)
      • Data Table on Grinders - Market size and forecast 2023-2028 ($ million)
      • Chart on Grinders - Year-over-year growth 2023-2028 (%)
      • Data Table on Grinders - Year-over-year growth 2023-2028 (%)
    • 6.8 Market opportunity by Product
      • Market opportunity by Product ($ million)
      • Data Table on Market opportunity by Product ($ million)

    7 Customer Landscape

    • 7.1 Customer landscape overview
      • Analysis of price sensitivity, lifecycle, customer purchase basket, adoption rates, and purchase criteria

    8 Geographic Landscape

    • 8.1 Geographic segmentation
      • Chart on Market share by geography 2023-2028 (%)
      • Data Table on Market share by geography 2023-2028 (%)
    • 8.2 Geographic comparison
      • Chart on Geographic comparison
      • Data Table on Geographic comparison
    • 8.3 Europe - Market size and forecast 2023-2028
      • Chart on Europe - Market size and forecast 2023-2028 ($ million)
      • Data Table on Europe - Market size and forecast 2023-2028 ($ million)
      • Chart on Europe - Year-over-year growth 2023-2028 (%)
      • Data Table on Europe - Year-over-year growth 2023-2028 (%)
    • 8.4 APAC - Market size and forecast 2023-2028
      • Chart on APAC - Market size and forecast 2023-2028 ($ million)
      • Data Table on APAC - Market size and forecast 2023-2028 ($ million)
      • Chart on APAC - Year-over-year growth 2023-2028 (%)
      • Data Table on APAC - Year-over-year growth 2023-2028 (%)
    • 8.5 North America - Market size and forecast 2023-2028
      • Chart on North America - Market size and forecast 2023-2028 ($ million)
      • Data Table on North America - Market size and forecast 2023-2028 ($ million)
      • Chart on North America - Year-over-year growth 2023-2028 (%)
      • Data Table on North America - Year-over-year growth 2023-2028 (%)
    • 8.6 South America - Market size and forecast 2023-2028
      • Chart on South America - Market size and forecast 2023-2028 ($ million)
      • Data Table on South America - Market size and forecast 2023-2028 ($ million)
      • Chart on South America - Year-over-year growth 2023-2028 (%)
      • Data Table on South America - Year-over-year growth 2023-2028 (%)
    • 8.7 Middle East and Africa - Market size and forecast 2023-2028
      • Chart on Middle East and Africa - Market size and forecast 2023-2028 ($ million)
      • Data Table on Middle East and Africa - Market size and forecast 2023-2028 ($ million)
      • Chart on Middle East and Africa - Year-over-year growth 2023-2028 (%)
      • Data Table on Middle East and Africa - Year-over-year growth 2023-2028 (%)
    • 8.8 US - Market size and forecast 2023-2028
      • Chart on US - Market size and forecast 2023-2028 ($ million)
      • Data Table on US - Market size and forecast 2023-2028 ($ million)
      • Chart on US - Year-over-year growth 2023-2028 (%)
      • Data Table on US - Year-over-year growth 2023-2028 (%)
    • 8.9 Germany - Market size and forecast 2023-2028
      • Chart on Germany - Market size and forecast 2023-2028 ($ million)
      • Data Table on Germany - Market size and forecast 2023-2028 ($ million)
      • Chart on Germany - Year-over-year growth 2023-2028 (%)
      • Data Table on Germany - Year-over-year growth 2023-2028 (%)
    • 8.10 China - Market size and forecast 2023-2028
      • Chart on China - Market size and forecast 2023-2028 ($ million)
      • Data Table on China - Market size and forecast 2023-2028 ($ million)
      • Chart on China - Year-over-year growth 2023-2028 (%)
      • Data Table on China - Year-over-year growth 2023-2028 (%)
    • 8.11 France - Market size and forecast 2023-2028
      • Chart on France - Market size and forecast 2023-2028 ($ million)
      • Data Table on France - Market size and forecast 2023-2028 ($ million)
      • Chart on France - Year-over-year growth 2023-2028 (%)
      • Data Table on France - Year-over-year growth 2023-2028 (%)
    • 8.12 India - Market size and forecast 2023-2028
      • Chart on India - Market size and forecast 2023-2028 ($ million)
      • Data Table on India - Market size and forecast 2023-2028 ($ million)
      • Chart on India - Year-over-year growth 2023-2028 (%)
      • Data Table on India - Year-over-year growth 2023-2028 (%)
    • 8.13 Market opportunity by geography
      • Market opportunity by geography ($ million)
      • Data Tables on Market opportunity by geography ($ million)

    9 Drivers, Challenges, and Opportunity/Restraints

    • 9.1 Market drivers
      • 9.2 Market challenges
        • 9.3 Impact of drivers and challenges
          • Impact of drivers and challenges in 2023 and 2028
        • 9.4 Market opportunities/restraints

          10 Competitive Landscape

          • 10.1 Overview
            • 10.2 Competitive Landscape
              • Overview on criticality of inputs and factors of differentiation
            • 10.3 Landscape disruption
              • Overview on factors of disruption
            • 10.4 Industry risks
              • Impact of key risks on business

            11 Competitive Analysis

            • 11.1 Companies profiled
              • Companies covered
            • 11.2 Market positioning of companies
              • Matrix on companies position and classification
            • 11.3 Amandus Kahl GmbH and Co. KG
              • Amandus Kahl GmbH and Co. KG - Overview
              • Amandus Kahl GmbH and Co. KG - Product / Service
              • Amandus Kahl GmbH and Co. KG - Key offerings
            • 11.4 Andritz AG
              • Andritz AG - Overview
              • Andritz AG - Business segments
              • Andritz AG - Key news
              • Andritz AG - Key offerings
              • Andritz AG - Segment focus
            • 11.5 Astec Industries Inc
              • Astec Industries Inc - Overview
              • Astec Industries Inc - Business segments
              • Astec Industries Inc - Key news
              • Astec Industries Inc - Key offerings
              • Astec Industries Inc - Segment focus
            • 11.6 Babcock and Wilcox Enterprises Inc.
              • Babcock and Wilcox Enterprises Inc. - Overview
              • Babcock and Wilcox Enterprises Inc. - Business segments
              • Babcock and Wilcox Enterprises Inc. - Key news
              • Babcock and Wilcox Enterprises Inc. - Key offerings
              • Babcock and Wilcox Enterprises Inc. - Segment focus
            • 11.7 Dust Solutions Inc.
              • Dust Solutions Inc. - Overview
              • Dust Solutions Inc. - Product / Service
              • Dust Solutions Inc. - Key offerings
            • 11.8 Evoqua Water Technologies LLC
              • Evoqua Water Technologies LLC - Overview
              • Evoqua Water Technologies LLC - Business segments
              • Evoqua Water Technologies LLC - Key news
              • Evoqua Water Technologies LLC - Key offerings
              • Evoqua Water Technologies LLC - Segment focus
            • 11.9 General Kinematics Corp.
              • General Kinematics Corp. - Overview
              • General Kinematics Corp. - Product / Service
              • General Kinematics Corp. - Key offerings
            • 11.10 MAX Automation SE
              • MAX Automation SE - Overview
              • MAX Automation SE - Business segments
              • MAX Automation SE - Key offerings
              • MAX Automation SE - Segment focus
            • 11.11 Schenck Process Holding GmbH
              • Schenck Process Holding GmbH - Overview
              • Schenck Process Holding GmbH - Product / Service
              • Schenck Process Holding GmbH - Key offerings
            • 11.12 ZE ENERGY Inc.
              • ZE ENERGY Inc. - Overview
              • ZE ENERGY Inc. - Product / Service
              • ZE ENERGY Inc. - Key offerings

            12 Appendix

            • 12.1 Scope of the report
              • 12.2 Inclusions and exclusions checklist
                • Inclusions checklist
                • Exclusions checklist
              • 12.3 Currency conversion rates for US$
                • Currency conversion rates for US$
              • 12.4 Research methodology
                • Research methodology
              • 12.5 Data procurement
                • Information sources
              • 12.6 Data validation
                • Data validation
              • 12.7 Validation techniques employed for market sizing
                • Validation techniques employed for market sizing
              • 12.8 Data synthesis
                • Data synthesis
              • 12.9 360 degree market analysis
                • 360 degree market analysis
              • 12.10 List of abbreviations
                • List of abbreviations

              Research Methodology

              Technavio presents a detailed picture of the market by way of study, synthesis, and summation of data from multiple sources. The analysts have presented the various facets of the market with a particular focus on identifying the key industry influencers. The data thus presented is comprehensive, reliable, and the result of extensive research, both primary and secondary.

              INFORMATION SOURCES

              Primary sources

              • Manufacturers and suppliers
              • Channel partners
              • Industry experts
              • Strategic decision makers

              Secondary sources

              • Industry journals and periodicals
              • Government data
              • Financial reports of key industry players
              • Historical data
              • Press releases

              DATA ANALYSIS

              Data Synthesis

              • Collation of data
              • Estimation of key figures
              • Analysis of derived insights

              Data Validation

              • Triangulation with data models
              • Reference against proprietary databases
              • Corroboration with industry experts

              REPORT WRITING

              Qualitative

              • Market drivers
              • Market challenges
              • Market trends
              • Five forces analysis

              Quantitative

              • Market size and forecast
              • Market segmentation
              • Geographical insights
              • Competitive landscape

              Interested in this report?

              Get your sample now to see our research methodology and insights!

              Download Now

              Frequently Asked Questions

              Material Handling Equipment In Biomass Power Plant market growth will increase by $ 589 mn during 2024-2028 .

              The Material Handling Equipment In Biomass Power Plant market is expected to grow at a CAGR of 4.5% during 2024-2028 .

              Material Handling Equipment In Biomass Power Plant market is segmented by Product( Digestors, Feeder systems, Silos and storage tanks, Chippers, Grinders)

              Amandus Kahl GmbH and Co. KG, Andritz AG, Astec Industries Inc, Babcock and Wilcox Enterprises Inc., Dust Solutions Inc., Evoqua Water Technologies LLC, General Kinematics Corp., MAX Automation SE, RUD Ketten Rieger and Dietz GmbH u Co. KG, Schenck Process Holding GmbH, Terex Corp., ZE ENERGY Inc. are a few of the key vendors in the Material Handling Equipment In Biomass Power Plant market.

              APAC will register the highest growth rate of 33% among the other regions. Therefore, the Material Handling Equipment In Biomass Power Plant market in APAC is expected to garner significant business opportunities for the vendors during the forecast period.

              US, Germany, China, France, India

              • Material handling equipment increases efficiency of combustion process in a biomass power plantBiomass is the oldest form of energy being used by humans. Wood is the driving factor this market.
              • wooden pallets and chips is the driving factor this market.
              • and agricultural waste and residue were among the primary fuel used by ancient humans in cooking and heating applications. Some of the least developed regions of the world continue to use biomass for their energy requirements. In such applications is the driving factor this market.
              • biomass is directly burnt to produce heat energy.Similarly is the driving factor this market.
              • biomass is burnt in thermal power plants to produce heat that is used to generate high-pressure steam in power boilers. This high-pressure steam is then used to rotate turbines is the driving factor this market.
              • which results in electricity generation. Some biomass power plants directly burn biomass to produce electricity. Such a power plant requires only a chipper and feeder system to feed wooden chips is the driving factor this market.
              • pallets is the driving factor this market.
              • and sawdust to the combustion furnace of a boiler. Such a system requires less capital investment but does not achieve the maximum possible fuel efficiency.  Thus is the driving factor this market.
              • several large-scale commercial biomass power plants use advanced material handling equipment such as grinders and digestors to produce renewable natural gas or methane by decomposing biomass in the absence of oxygen. The renewable natural gas is then combusted in the combustion furnace of the boiler. The renewable natural gas has a higher calorific value than untreated biomass and results in complete combustion during the combustion process. This increases efficiency as well as causes fewer emissions of harmful gases such as carbon monoxide as complete combustion of fuel is achieved in such a method. These factors are driving the demand for material handling equipment for biomass power plants during the forecast period.   is the driving factor this market.

              The Material Handling Equipment In Biomass Power Plant market vendors should focus on grabbing business opportunities from the Digestors segment as it accounted for the largest market share in the base year.