Mobile Application Testing Solution Market Analysis North America, APAC, Europe, South America, Middle East and Africa - US, China, UK, India, Germany - Size and Forecast 2024-2028

Mobile Application Testing Solution Market Analysis North America, APAC, Europe, South America, Middle East and Africa - US, China, UK, India, Germany - Size and Forecast 2024-2028

Published: Oct 2024 141 Pages SKU: IRTNTR71759

Market Overview at a Glance

$4.95 B
Market Opportunity
11.1%
CAGR
10.0
YoY growth 2023-2024(%)

Mobile Application Testing Solution Market Size and Trends

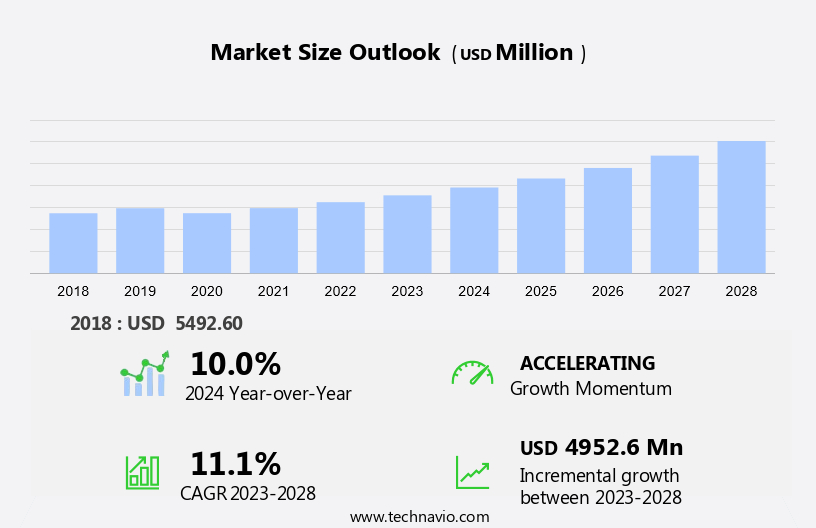
The mobile application testing solution market size is forecast to increase by USD 4.95 billion, at a CAGR of 11.1% between 2023 and 2028. The mobile application testing solution market is witnessing significant growth due to the increasing usage of mobile devices for various business and personal activities. With the expansion of m-commerce and the rise of IoT devices, the number of mobile applications is increasing, necessitating rigorous testing to ensure functionality, usability, and compliance with technical and business requirements. Android and iOS remain the dominant operating systems, necessitating testing across various screen resolutions and operating system versions. Additionally, network bandwidths and performance are crucial factors that require attention during testing. The market is also facing challenges from cyber threats, necessitating full security testing solutions. These trends and challenges highlight the importance of mobile application testing solutions in ensuring the success and security of mobile applications in the market.

Mobile Application Testing Solution Market Size

 Request Free Sample

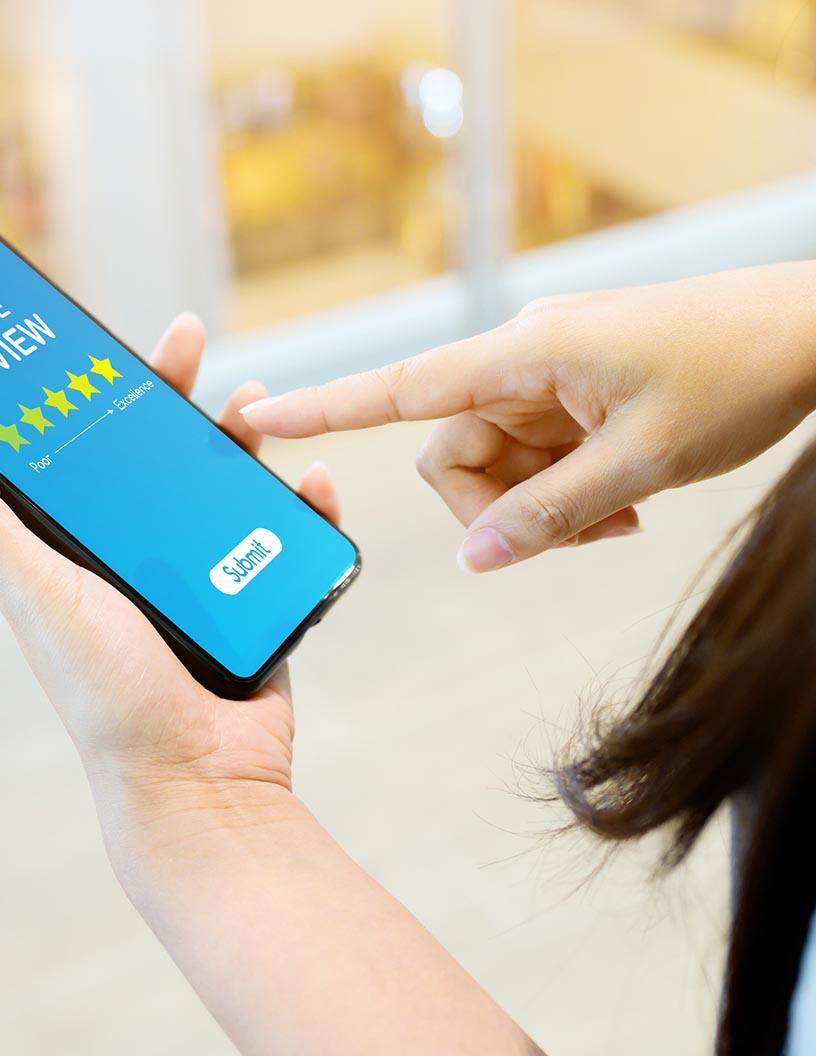
Mobile applications have become an integral part of modern business strategies, with an increasing number of organizations relying on them to engage with customers and streamline operations. To ensure the success of mobile applications, it is crucial to address validation, functionality, and usability concerns. In this context, mobile application testing solutions play a pivotal role in addressing technical and business requirements. Functionality testing is essential to ensure that the mobile application performs as intended across various Android and iOS devices. This includes testing features, user interfaces, and integrations with other applications and services. Functionality testing covers both front-end and back-end aspects of the mobile application, ensuring that all components work together seamlessly. Usability testing is another critical aspect of mobile application testing. It focuses on evaluating the user experience (UX) and user interface (UI) design, ensuring that the application is intuitive and easy to use for potential customers. Usability testing involves assessing various elements, such as menus, dropdowns, and navigation buttons, to ensure they function optimally and meet user expectations. Technical requirements for mobile application testing include addressing screen resolutions, operating system versions, and network bandwidths. Ensuring compatibility with various screen sizes and resolutions is essential to deliver an optimal user experience. Testing against different operating system versions guarantees that the application functions correctly and consistently across various devices and platforms.

Additionally, assessing network bandwidths helps ensure that the application performs well in various connectivity scenarios. Performance testing is crucial to evaluate the mobile application's ability to handle heavy usage and provide a responsive user experience. This includes assessing the application's compatibility with mobile sensors such as gyroscopes, accelerometers, and GPS. Performance testing also covers critical bugs and potential bottlenecks, ensuring that the application runs smoothly and efficiently. Mobile application testing solutions are essential for organizations looking to optimize their mobile presence and enhance user experience. By addressing validation, functionality, usability, and performance concerns, organizations can ensure that their mobile applications meet user expectations and deliver value. Furthermore, testing mobile web applications is equally important, as more businesses adopt web-based mobile strategies. In summary, mobile application testing solutions help organizations validate, optimize, and enhance their mobile applications' functionality, usability, and performance. By addressing technical requirements, such as screen resolutions, operating system versions, network bandwidths, and mobile sensors, organizations can ensure a consistent and optimal user experience across various mobile devices and platforms.

Market Segmentation

The market forecast report provides comprehensive data (region-wise segment analysis), with forecasts and estimates in "USD million" for the period 2024-2028, as well as historical data from 2018 - 2022 for the following segments.

  • End-user
    • Commercial
    • Individual
  • Geography
    • North America
      • US
    • APAC
      • China
      • India
    • Europe
      • Germany
      • UK
    • South America
    • Middle East and Africa

By End-user Insights

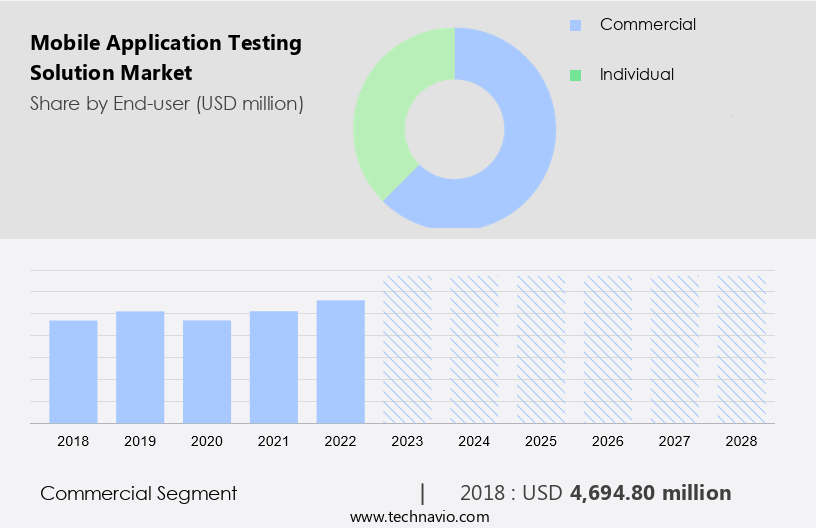
The commercial segment is estimated to witness significant growth during the forecast period. The mobile application testing solution market caters to the validation needs of businesses and enterprises in the market, focusing on functionality and usability for Android and iOS platforms. Technical and business requirements dictate testing across various screen resolutions, operating system versions, and network bandwidths.

Mobile Application Testing Solution Market Size

Get a glance at the market share of various segments Download the PDF Sample

The commercial segment accounted for USD 4.69 billion in 2018 and showed a gradual increase during the forecast period. Performance is a key concern, as mobile apps are increasingly utilized in sectors such as banking, finance, insurance (BFSI), retail, healthcare, and travel and tourism. Companies invest substantially in testing solutions to address bugs, enhance app performance, and adhere to industry standards. The growing importance of mobile applications in business processes and customer interaction necessitates the adoption of comprehensive testing solutions.

Regional Analysis

Mobile Application Testing Solution Market Share by Geography

For more insights on the market share of various regions Download PDF Sample now!

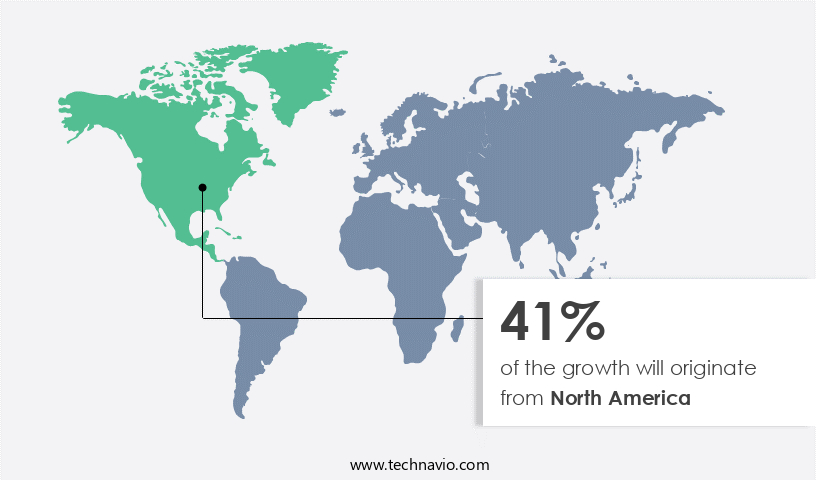
North America is estimated to contribute 41% to the growth of the global market during the forecast period. Technavio's analysts have elaborately explained the regional trends and drivers that shape the market during the forecast period.  In North America, the market for mobile application testing solutions is significant due to the expanding mobile subscriber base. The region accounted for over 30% of the global revenue generated from mobile games in 2023. The US dominates this market, given its high smartphone penetration rate. However, smartphone adoption has reached saturation as most residents own these devices.

Nonetheless, countries like the US and Canada are projected to attain substantial mobile and smartphone penetration rates during the forecast period. Mobile application testing solutions are essential in North America due to the widespread use of mobile devices and diverse mobile-OS combinations. These solutions optimize mobile applications for various smartphones and browsers, ensuring seamless user experiences for web apps, mobile web apps, and progressive web apps. Moreover, native apps are increasingly popular, necessitating rigorous testing to meet user expectations.

Our researchers analyzed the data with 2023 as the base year, along with the key drivers, trends, and challenges. A holistic analysis of drivers will help companies refine their marketing strategies to gain a competitive advantage.

Mobile Application Testing Solution Market Driver

The growing m-commerce industry is notably driving market growth. The market for mobile application testing solutions has gained significant traction due to the increasing prevalence of mobile apps on various devices and platforms. As mobile commerce continues to grow in the US, ensuring the quality and security of these applications becomes essential. Mobile apps offer consumers greater flexibility and convenience, enabling them to make purchases and access services from anywhere. Retailers are capitalizing on this trend by adopting mobile strategies, such as omnichannel marketing and mobile-first approaches. However, with the increasing number of mobile apps and devices comes an array of testing aspects and issues.

These include compatibility across multiple platforms and devices, adherence to quality standards, and addressing security vulnerabilities. Effective testing activities are crucial to identifying and resolving defects, ensuring a seamless user experience, and maintaining customer trust. Hybrid apps, which combine native and web technologies, present additional challenges for testing. Testing solutions must be able to address the unique complexities of these applications to ensure optimal performance and user experience. By investing in vital testing solutions, businesses can mitigate risks, enhance user satisfaction, and ultimately drive growth in the competitive mobile market.

Mobile Application Testing Solution Market Trends

Increasing number of mobile apps for IoT devices is the key trend in the market. The proliferation of Internet of Things (IoT) technology is driving the growth of mobile applications, as more devices become connected through software and sensors. The rising popularity of IoT devices, such as smartwatches and eyeglasses, is fueled by their convenience and mobility features. According to industry estimates, the number of annual smartphone shipments is projected to continue increasing, with smartphones anticipated to account for over 81% of all mobile phones in use worldwide by 2025. To ensure the functionality and compatibility of mobile applications with these IoT devices, various testing solutions have emerged. These include Automation Testing, Functional Testing, Regression Testing, Compatibility Testing, Beta Testing, Real Device Testing, Emulator Testing, and Simulator Testing.

Automation Testing automates repetitive tasks, saving time and resources. Functional Testing ensures the application functions as intended. Regression Testing identifies any new issues caused by updates or changes. Compatibility Testing ensures the application works seamlessly across various devices and operating systems. Beta Testing allows for user feedback before release. Real Device Testing uses actual devices for testing, while Emulator and Simulator Testing use virtual devices. In conclusion, the increasing adoption of IoT devices and the integration of mobile applications with these devices have led to the need for comprehensive mobile application testing solutions.

Mobile Application Testing Solution Market Challenge

The threat of cyber attacks is the major challenge that affects the growth of the market. In today's digital age, mobile applications have become an integral part of our daily lives, facilitating access to various personal and professional data. Native apps, web apps, and hybrid apps have diversified the mobile application landscape, catering to user expectations in a competitive industry. However, this proliferation of mobile applications also increases the risk of data breaches and privacy invasions. Outdated applications or those lacking the latest security patches leave users vulnerable to cyber-attacks.

Grayware poses a significant privacy risk by collecting and transmitting personal information without consent. Brands must prioritize mobile application testing solutions to safeguard their reputation and maintain user trust. Manual testing, exploratory testing, and ad hoc testing are essential testing methodologies to ensure application functionality, usability, and security. Testing in diverse environments is crucial to identify and address potential issues across various platforms and devices. By implementing rigorous mobile application testing, businesses can meet user expectations, mitigate risks, and stay ahead of industry competition.

Exclusive Customer Landscape

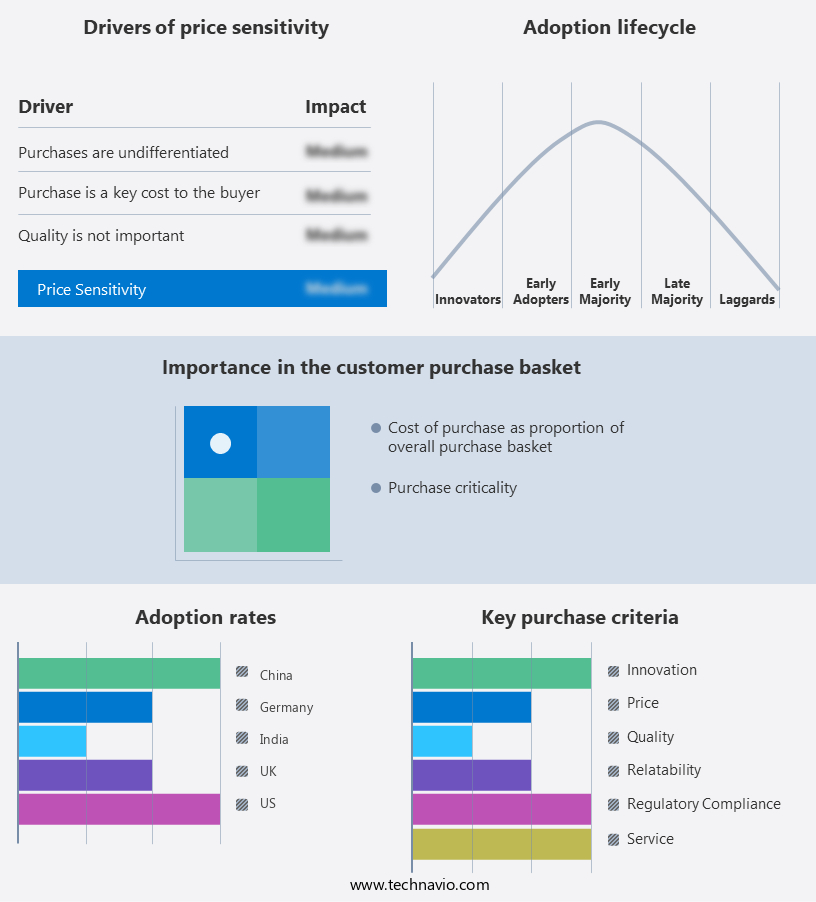
The market forecasting report includes the adoption lifecycle of the market, covering from the innovator's stage to the laggard's stage. It focuses on adoption rates in different regions based on penetration. Furthermore, the report also includes key purchase criteria and drivers of price sensitivity to help companies evaluate and develop their market growth analysis strategies.

Mobile Application Testing Solution Market Share by Geography

 Customer Landscape

Key Companies & Market Insights

Companies are implementing various strategies, such as strategic alliances, partnerships, mergers and acquisitions, geographical expansion, and product/service launches, to enhance their presence in the market.

  • Broadcom Inc.: The company offers solution for mobile application testing that uses open source based technologies to enhance the system and extend its productivity, under the brand name of Broadcom.

The market research and growth report also includes detailed analyses of the competitive landscape of the market and information about key companies, including:

  • Applause App Quality Inc.
  • Capgemini Services SAS
  • Digital.ai Software Inc.
  • iBeta
  • Infostretch Corp.
  • International Business Machines Corp.
  • Keysight Technologies Inc.
  • Microsoft Corp.
  • Norton Enterprises Inc
  • Oracle Corp.
  • Panasonic Holdings Corp.
  • pCloudy
  • QA InfoTech
  • SAP SE
  • Sauce Labs Inc.
  • ScienceSoft USA Corp.
  • Softcrylic LLC
  • TestingXperts
  • ZenQ

Qualitative and quantitative analysis of companies has been conducted to help clients understand the wider business environment as well as the strengths and weaknesses of key market players. Data is qualitatively analyzed to categorize companies as pure play, category-focused, industry-focused, and diversified; it is quantitatively analyzed to categorize companies as dominant, leading, strong, tentative, and weak.

Market Analyst Overview

Mobile application testing is a crucial aspect of software development, ensuring the functionality, usability, and compatibility of applications on various mobile devices and operating systems. Validation of business and technical requirements is essential on Android and iOS platforms, considering screen resolutions, operating system versions, network bandwidths, and performance. Mobile sensors, such as gyroscopes, accelerometers, and GPS, require specific testing. Menus, dropdowns, and navigation buttons need to function seamlessly. Critical bugs impact user experience, leading to potential customer dissatisfaction and brand reputation damage. Testing aspects include usability, uninstallation, and compatibility with diverse mobile devices, platforms, and mobile-OS combinations. Web app testing for web applications, browsers, mobile web apps, and progressive web apps is essential. Native apps, hybrid apps, and mobile apps require optimization for smartphone usage and various programming languages.

Further, quality standards prioritize security, addressing issues related to user experience, software development, testing activities, and defects. Industry competition necessitates addressing user expectations and ensuring compatibility across multiple native apps, web apps, and hybrid apps. Manual testing, exploratory testing, ad hoc testing, usability testing, automation testing, functional testing, regression testing, compatibility testing, beta testing, real device testing, emulator testing, and simulator testing are essential testing methods. Mobile web browsers also require testing for optimal performance.

Market Scope

Report Coverage

Details

Page number

141

Base year

2023

Historic period

2018 - 2022

Forecast period

2024-2028

Growth momentum & CAGR

Accelerate at a CAGR of 11.1%

Market growth 2024-2028

USD 4.95 billion

Market structure

Fragmented

YoY growth 2023-2024(%)

10.0

Regional analysis

North America, APAC, Europe, South America, and Middle East and Africa

Performing market contribution

North America at 41%

Key countries

US, China, UK, India, and Germany

Competitive landscape

Leading Companies, Market Positioning of Companies, Competitive Strategies, and Industry Risks

Key companies profiled

Applause App Quality Inc., Broadcom Inc., Capgemini Services SAS, Digital.ai Software Inc., iBeta, Infostretch Corp., International Business Machines Corp., Keysight Technologies Inc., Microsoft Corp., Norton Enterprises Inc, Oracle Corp., Panasonic Holdings Corp., pCloudy, QA InfoTech, SAP SE, Sauce Labs Inc., ScienceSoft USA Corp., Softcrylic LLC, TestingXperts, and ZenQ

Market dynamics

Parent market analysis, Market growth inducers and obstacles, Fast-growing and slow-growing segment analysis, COVID-19 impact and recovery analysis and future consumer dynamics, Market condition analysis for forecast period

Customization purview

If our report has not included the data that you are looking for, you can reach out to our analysts and get segments customized.

Download PDF Sample

What are the Key Data Covered in this Market Report?

  • CAGR of the market during the forecast period
  • Detailed information on factors that will drive the market growth and forecasting between 2024 and 2028
  • Precise estimation of the size of the market  and its contribution of the market in focus to the parent market
  • Accurate predictions about upcoming market growth and trends and changes in consumer behaviour
  • Growth of the market across North America, APAC, Europe, South America, and Middle East and Africa
  • Thorough analysis of the market's competitive landscape and detailed information about companies
  • Comprehensive analysis of factors that will challenge the growth of market companies

We can help! Our analysts can customize this market research report to meet your requirements. Get in touch

1 Executive Summary

  • 1.1 Market overview
    • Executive Summary - Chart on Market Overview
    • Executive Summary - Data Table on Market Overview
    • Executive Summary - Chart on Global Market Characteristics
    • Executive Summary - Chart on Market by Geography
    • Executive Summary - Chart on Market Segmentation by End-user
    • Executive Summary - Chart on Incremental Growth
    • Executive Summary - Data Table on Incremental Growth
    • Executive Summary - Chart on Company Market Positioning

2 Market Landscape

  • 2.1 Market ecosystem
    • Parent Market
    • Data Table on - Parent Market
  • 2.2 Market characteristics
    • Market characteristics analysis
  • 2.3 Value chain analysis
    • Value Chain Analysis

3 Market Sizing

  • 3.1 Market definition
    • Offerings of companies included in the market definition
  • 3.2 Market segment analysis
    • Market segments
  • 3.3 Market size 2023
    • 3.4 Market outlook: Forecast for 2023-2028
      • Chart on Global - Market size and forecast 2023-2028 ($ million)
      • Data Table on Global - Market size and forecast 2023-2028 ($ million)
      • Chart on Global Market: Year-over-year growth 2023-2028 (%)
      • Data Table on Global Market: Year-over-year growth 2023-2028 (%)

    4 Historic Market Size

    • 4.1 Global Mobile Application Testing Solution Market 2018 - 2022
      • Historic Market Size - Data Table on Global Mobile Application Testing Solution Market 2018 - 2022 ($ million)
    • 4.2 End-user segment analysis 2018 - 2022
      • Historic Market Size - End-user Segment 2018 - 2022 ($ million)
    • 4.3 Geography segment analysis 2018 - 2022
      • Historic Market Size - Geography Segment 2018 - 2022 ($ million)
    • 4.4 Country segment analysis 2018 - 2022
      • Historic Market Size - Country Segment 2018 - 2022 ($ million)

    5 Five Forces Analysis

    • 5.1 Five forces summary
      • Five forces analysis - Comparison between 2023 and 2028
    • 5.2 Bargaining power of buyers
      • Bargaining power of buyers - Impact of key factors 2023 and 2028
    • 5.3 Bargaining power of suppliers
      • Bargaining power of suppliers - Impact of key factors in 2023 and 2028
    • 5.4 Threat of new entrants
      • Threat of new entrants - Impact of key factors in 2023 and 2028
    • 5.5 Threat of substitutes
      • Threat of substitutes - Impact of key factors in 2023 and 2028
    • 5.6 Threat of rivalry
      • Threat of rivalry - Impact of key factors in 2023 and 2028
    • 5.7 Market condition
      • Chart on Market condition - Five forces 2023 and 2028

    6 Market Segmentation by End-user

    • 6.1 Market segments
      • Chart on End-user - Market share 2023-2028 (%)
      • Data Table on End-user - Market share 2023-2028 (%)
    • 6.2 Comparison by End-user
      • Chart on Comparison by End-user
      • Data Table on Comparison by End-user
    • 6.3 Commercial - Market size and forecast 2023-2028
      • Chart on Commercial - Market size and forecast 2023-2028 ($ million)
      • Data Table on Commercial - Market size and forecast 2023-2028 ($ million)
      • Chart on Commercial - Year-over-year growth 2023-2028 (%)
      • Data Table on Commercial - Year-over-year growth 2023-2028 (%)
    • 6.4 Individual - Market size and forecast 2023-2028
      • Chart on Individual - Market size and forecast 2023-2028 ($ million)
      • Data Table on Individual - Market size and forecast 2023-2028 ($ million)
      • Chart on Individual - Year-over-year growth 2023-2028 (%)
      • Data Table on Individual - Year-over-year growth 2023-2028 (%)
    • 6.5 Market opportunity by End-user
      • Market opportunity by End-user ($ million)
      • Data Table on Market opportunity by End-user ($ million)

    7 Customer Landscape

    • 7.1 Customer landscape overview
      • Analysis of price sensitivity, lifecycle, customer purchase basket, adoption rates, and purchase criteria

    8 Geographic Landscape

    • 8.1 Geographic segmentation
      • Chart on Market share by geography 2023-2028 (%)
      • Data Table on Market share by geography 2023-2028 (%)
    • 8.2 Geographic comparison
      • Chart on Geographic comparison
      • Data Table on Geographic comparison
    • 8.3 North America - Market size and forecast 2023-2028
      • Chart on North America - Market size and forecast 2023-2028 ($ million)
      • Data Table on North America - Market size and forecast 2023-2028 ($ million)
      • Chart on North America - Year-over-year growth 2023-2028 (%)
      • Data Table on North America - Year-over-year growth 2023-2028 (%)
    • 8.4 APAC - Market size and forecast 2023-2028
      • Chart on APAC - Market size and forecast 2023-2028 ($ million)
      • Data Table on APAC - Market size and forecast 2023-2028 ($ million)
      • Chart on APAC - Year-over-year growth 2023-2028 (%)
      • Data Table on APAC - Year-over-year growth 2023-2028 (%)
    • 8.5 Europe - Market size and forecast 2023-2028
      • Chart on Europe - Market size and forecast 2023-2028 ($ million)
      • Data Table on Europe - Market size and forecast 2023-2028 ($ million)
      • Chart on Europe - Year-over-year growth 2023-2028 (%)
      • Data Table on Europe - Year-over-year growth 2023-2028 (%)
    • 8.6 South America - Market size and forecast 2023-2028
      • Chart on South America - Market size and forecast 2023-2028 ($ million)
      • Data Table on South America - Market size and forecast 2023-2028 ($ million)
      • Chart on South America - Year-over-year growth 2023-2028 (%)
      • Data Table on South America - Year-over-year growth 2023-2028 (%)
    • 8.7 Middle East and Africa - Market size and forecast 2023-2028
      • Chart on Middle East and Africa - Market size and forecast 2023-2028 ($ million)
      • Data Table on Middle East and Africa - Market size and forecast 2023-2028 ($ million)
      • Chart on Middle East and Africa - Year-over-year growth 2023-2028 (%)
      • Data Table on Middle East and Africa - Year-over-year growth 2023-2028 (%)
    • 8.8 US - Market size and forecast 2023-2028
      • Chart on US - Market size and forecast 2023-2028 ($ million)
      • Data Table on US - Market size and forecast 2023-2028 ($ million)
      • Chart on US - Year-over-year growth 2023-2028 (%)
      • Data Table on US - Year-over-year growth 2023-2028 (%)
    • 8.9 China - Market size and forecast 2023-2028
      • Chart on China - Market size and forecast 2023-2028 ($ million)
      • Data Table on China - Market size and forecast 2023-2028 ($ million)
      • Chart on China - Year-over-year growth 2023-2028 (%)
      • Data Table on China - Year-over-year growth 2023-2028 (%)
    • 8.10 UK - Market size and forecast 2023-2028
      • Chart on UK - Market size and forecast 2023-2028 ($ million)
      • Data Table on UK - Market size and forecast 2023-2028 ($ million)
      • Chart on UK - Year-over-year growth 2023-2028 (%)
      • Data Table on UK - Year-over-year growth 2023-2028 (%)
    • 8.11 India - Market size and forecast 2023-2028
      • Chart on India - Market size and forecast 2023-2028 ($ million)
      • Data Table on India - Market size and forecast 2023-2028 ($ million)
      • Chart on India - Year-over-year growth 2023-2028 (%)
      • Data Table on India - Year-over-year growth 2023-2028 (%)
    • 8.12 Germany - Market size and forecast 2023-2028
      • Chart on Germany - Market size and forecast 2023-2028 ($ million)
      • Data Table on Germany - Market size and forecast 2023-2028 ($ million)
      • Chart on Germany - Year-over-year growth 2023-2028 (%)
      • Data Table on Germany - Year-over-year growth 2023-2028 (%)
    • 8.13 Market opportunity by geography
      • Market opportunity by geography ($ million)
      • Data Tables on Market opportunity by geography ($ million)

    9 Drivers, Challenges, and Opportunity/Restraints

    • 9.1 Market drivers
      • 9.2 Market challenges
        • 9.3 Impact of drivers and challenges
          • Impact of drivers and challenges in 2023 and 2028
        • 9.4 Market opportunities/restraints

          10 Competitive Landscape

          • 10.1 Overview
            • 10.2 Competitive Landscape
              • Overview on criticality of inputs and factors of differentiation
            • 10.3 Landscape disruption
              • Overview on factors of disruption
            • 10.4 Industry risks
              • Impact of key risks on business

            11 Competitive Analysis

            • 11.1 Companies profiled
              • Companies covered
            • 11.2 Market positioning of companies
              • Matrix on companies position and classification
            • 11.3 Broadcom Inc.
              • Broadcom Inc. - Overview
              • Broadcom Inc. - Business segments
              • Broadcom Inc. - Key news
              • Broadcom Inc. - Key offerings
              • Broadcom Inc. - Segment focus
            • 11.4 Capgemini Services SAS
              • Capgemini Services SAS - Overview
              • Capgemini Services SAS - Business segments
              • Capgemini Services SAS - Key news
              • Capgemini Services SAS - Key offerings
              • Capgemini Services SAS - Segment focus
            • 11.5 International Business Machines Corp.
              • International Business Machines Corp. - Overview
              • International Business Machines Corp. - Business segments
              • International Business Machines Corp. - Key news
              • International Business Machines Corp. - Key offerings
              • International Business Machines Corp. - Segment focus
            • 11.6 Keysight Technologies Inc.
              • Keysight Technologies Inc. - Overview
              • Keysight Technologies Inc. - Business segments
              • Keysight Technologies Inc. - Key news
              • Keysight Technologies Inc. - Key offerings
              • Keysight Technologies Inc. - Segment focus
            • 11.7 Microsoft Corp.
              • Microsoft Corp. - Overview
              • Microsoft Corp. - Business segments
              • Microsoft Corp. - Key news
              • Microsoft Corp. - Key offerings
              • Microsoft Corp. - Segment focus
            • 11.8 Norton Enterprises Inc
              • Norton Enterprises Inc - Overview
              • Norton Enterprises Inc - Product / Service
              • Norton Enterprises Inc - Key offerings
            • 11.9 Oracle Corp.
              • Oracle Corp. - Overview
              • Oracle Corp. - Business segments
              • Oracle Corp. - Key news
              • Oracle Corp. - Key offerings
              • Oracle Corp. - Segment focus
            • 11.10 Panasonic Holdings Corp.
              • Panasonic Holdings Corp. - Overview
              • Panasonic Holdings Corp. - Business segments
              • Panasonic Holdings Corp. - Key news
              • Panasonic Holdings Corp. - Key offerings
              • Panasonic Holdings Corp. - Segment focus
            • 11.11 SAP SE
              • SAP SE - Overview
              • SAP SE - Business segments
              • SAP SE - Key news
              • SAP SE - Key offerings
              • SAP SE - Segment focus
            • 11.12 Softcrylic LLC
              • Softcrylic LLC - Overview
              • Softcrylic LLC - Product / Service
              • Softcrylic LLC - Key offerings

            12 Appendix

            • 12.1 Scope of the report
              • 12.2 Inclusions and exclusions checklist
                • Inclusions checklist
                • Exclusions checklist
              • 12.3 Currency conversion rates for US$
                • Currency conversion rates for US$
              • 12.4 Research methodology
                • Research methodology
              • 12.5 Data procurement
                • Information sources
              • 12.6 Data validation
                • Data validation
              • 12.7 Validation techniques employed for market sizing
                • Validation techniques employed for market sizing
              • 12.8 Data synthesis
                • Data synthesis
              • 12.9 360 degree market analysis
                • 360 degree market analysis
              • 12.10 List of abbreviations
                • List of abbreviations

              Research Methodology

              Technavio presents a detailed picture of the market by way of study, synthesis, and summation of data from multiple sources. The analysts have presented the various facets of the market with a particular focus on identifying the key industry influencers. The data thus presented is comprehensive, reliable, and the result of extensive research, both primary and secondary.

              INFORMATION SOURCES

              Primary sources

              • Manufacturers and suppliers
              • Channel partners
              • Industry experts
              • Strategic decision makers

              Secondary sources

              • Industry journals and periodicals
              • Government data
              • Financial reports of key industry players
              • Historical data
              • Press releases

              DATA ANALYSIS

              Data Synthesis

              • Collation of data
              • Estimation of key figures
              • Analysis of derived insights

              Data Validation

              • Triangulation with data models
              • Reference against proprietary databases
              • Corroboration with industry experts

              REPORT WRITING

              Qualitative

              • Market drivers
              • Market challenges
              • Market trends
              • Five forces analysis

              Quantitative

              • Market size and forecast
              • Market segmentation
              • Geographical insights
              • Competitive landscape

              Interested in this report?

              Get your sample now to see our research methodology and insights!

              Download Now

              Frequently Asked Questions

              Mobile Application Testing Solution market growth will increase by $ 4952.6 mn during 2024-2028.

              The Mobile Application Testing Solution market is expected to grow at a CAGR of 11.1% during 2024-2028.

              Mobile Application Testing Solution market is segmented by End-user( Commercial, Individual)

              Applause App Quality Inc., Broadcom Inc., Capgemini Services SAS, Digital.ai Software Inc., iBeta, Infostretch Corp., International Business Machines Corp., Keysight Technologies Inc., Microsoft Corp., Norton Enterprises Inc, Oracle Corp., Panasonic Holdings Corp., pCloudy, QA InfoTech, SAP SE, Sauce Labs Inc., ScienceSoft USA Corp., Softcrylic LLC, TestingXperts, ZenQ are a few of the key vendors in the Mobile Application Testing Solution market.

              North America will register the highest growth rate of 41% among the other regions. Therefore, the Mobile Application Testing Solution market in North America is expected to garner significant business opportunities for the vendors during the forecast period.

              US, China, UK, India, Germany

              • Growing m-commerce industryThe m-commerce market has witnessed exponential growth in recent years is the driving factor this market.
              • owing to the increasing focus on mobile-aided shopping. Mobile phones provide enhanced flexibility for users as they enable product choice and browsing flexibility for customers. The growing adoption of m-commerce applications in mobile phones is allowing marketers to employ omnichannel marketing strategies. Thus is the driving factor this market.
              • numerous retailers are adopting a mobile-based approach to boost their sales. For example is the driving factor this market.
              • in March 2020 is the driving factor this market.
              • the Ministry of Tribal Affairs is the driving factor this market.
              • the Government of India is the driving factor this market.
              • announced the launch of an initiative for digital commerce based on e-commerce and m-commerce portals. The Ministry launched TRIFED is the driving factor this market.
              • an e-commerce portal is the driving factor this market.
              • and Tribes India m-commerce Android application is the driving factor this market.
              • which provides a platform for artisans from tribal communities to showcase their products and thus gain access to global markets. Thus is the driving factor this market.
              • the growing focus on providing a omnichannel market experience will increase the number of mobile-based m-commerce applications is the driving factor this market.
              • which is the driving factor this market.
              • in turn is the driving factor this market.
              • will drive the global mobile application testing solution market during the forecast period.  is the driving factor this market.

              The Mobile Application Testing Solution market vendors should focus on grabbing business opportunities from the Commercial segment as it accounted for the largest market share in the base year.
              RIA - Research AI Assistant
              Ask RIA