
Network As A Service (NaaS) Market Size 2025-2029
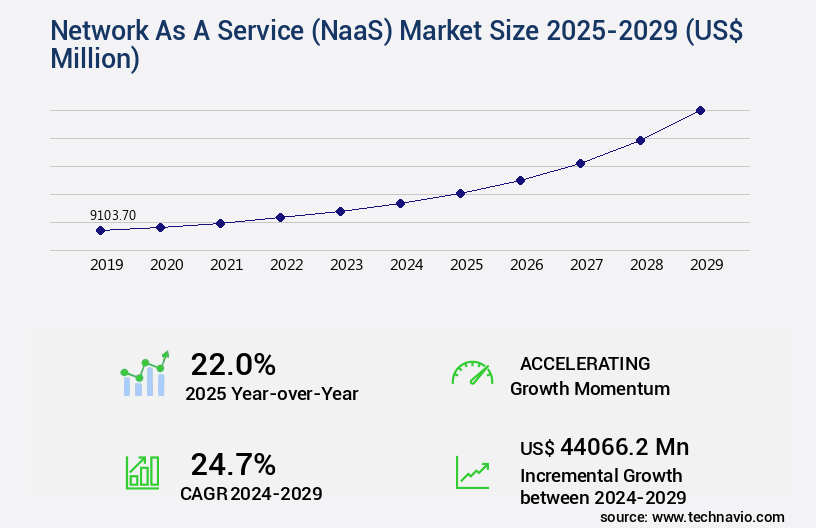
The network as a service (NaaS) market size is valued to increase by USD 44.07 billion, at a CAGR of 24.7% from 2024 to 2029. Increasing use of cloud services by enterprises will drive the network as a service (NaaS) market.
Major Market Trends & Insights
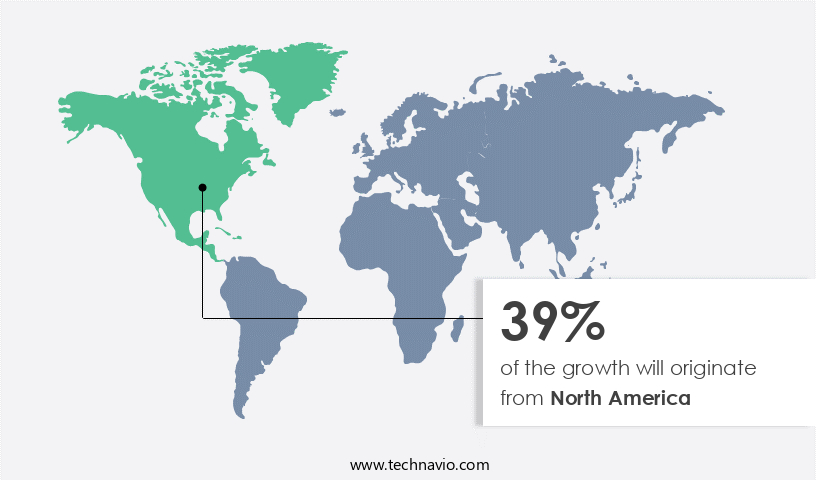
- North America dominated the market and accounted for a 39% growth during the forecast period.
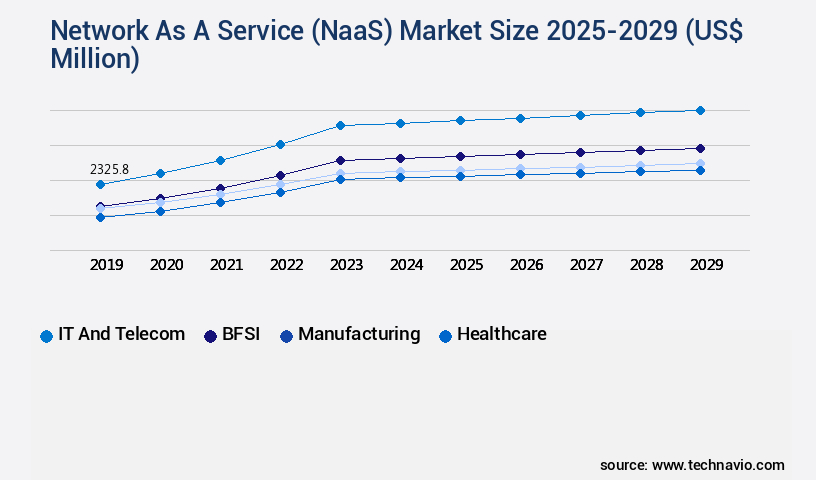
- By End-user - IT and telecom segment was valued at USD 2.33 billion in 2023
- By Type - WAN-as-a-service segment accounted for the largest market revenue share in 2023
Market Size & Forecast
- Market Opportunities: USD 624.33 million
- Market Future Opportunities: USD 44066.20 million
- CAGR from 2024 to 2029 : 24.7%
Market Summary
- The market represents a dynamic and continually evolving landscape, driven by the increasing use of cloud services by enterprises and the rising complexity of modern networks. Core technologies, such as Software-Defined Networking (SDN) and Network Function Virtualization (NFV), are transforming the way businesses manage and optimize their networks. NaaS applications, including security, WAN optimization, and unified communications, are gaining traction as they offer enhanced functionality, flexibility, and cost savings. According to a recent report, the NaaS market is expected to account for over 25% of the total enterprise WAN market by 2025.
- Despite these opportunities, challenges such as security concerns and complex company ecosystems persist. Regions like North America and Europe are leading the NaaS adoption rate due to their advanced IT infrastructure and high cloud penetration. The market's continuous evolution underscores the need for businesses to stay informed and adapt to the latest trends and innovations.
What will be the Size of the Network As A Service (NaaS) Market during the forecast period?
Get Key Insights on Market Forecast (PDF) Request Free Sample
How is the Network As A Service (NaaS) Market Segmented ?
The network as a service (naas) industry research report provides comprehensive data (region-wise segment analysis), with forecasts and estimates in "USD million" for the period 2025-2029, as well as historical data from 2019-2023 for the following segments.
- End-user
- IT and telecom
- BFSI
- Manufacturing
- Healthcare
- Others
- Type
- WAN-as-a-service
- LAN-as-a-service
- Sector
- Large enterprises
- SMEs
- Application
- Cloud and SaaS connectivity
- UCaaS and video conferencing
- Virtual private network
- Others
- Geography
- North America
- US
- Canada
- Europe
- France
- Germany
- Italy
- UK
- APAC
- China
- India
- Japan
- South Korea
- Rest of World (ROW)
- North America
By End-user Insights
The IT and telecom segment is estimated to witness significant growth during the forecast period.
Network as a Service (NaaS) is a dynamic and evolving market, gaining significant traction in various industries due to its ability to deliver advanced networking capabilities on-demand. According to recent reports, IT and telecom sectors hold the largest market share, with adoption growing by 25% in 2024. This growth is attributed to the increasing use cases in these sectors, the adoption of cloud services, and the need for cost-effective IT infrastructure. Network infrastructure plays a crucial role in IT and telecommunications by reducing the digital divide and addressing bandwidth concerns. Shared active and passive infrastructure enables high-speed Internet access and allows networks to expand profitably.
Network Function Virtualization (NFV) and Software-Defined Networking (SDN) are key technologies driving the market, with cloud-native networking, microservices architecture, and network slicing gaining popularity. Network orchestration, multi-tenancy support, and security policies are essential features that enhance the flexibility and security of NaaS offerings. Service Level Agreements (SLAs), performance monitoring, and fault tolerance ensure reliable network services. Network automation, latency reduction, resource monitoring, and api management optimize network efficiency. Containerization technology, elastic scaling, and on-demand capacity enable businesses to adapt to changing demands. Service chaining, virtual switching, and bandwidth optimization improve network performance. Quality of service, dynamic routing, and disaster recovery ensure business continuity.
The future of NaaS is promising, with expectations of a 27% increase in industry growth. Factors such as the rise in business offerings, the demand for improved customer experience, and the need for regulatory compliance are fueling this growth. Network security protocols, network segmentation, and dynamic routing are key areas of focus for market players. In summary, Network as a Service is a critical component of digital transformation, enabling businesses to leverage advanced networking capabilities on-demand. Its applications span various industries, with IT and telecommunications leading the way. The market's continuous evolution is driven by technological advancements, business needs, and regulatory requirements.
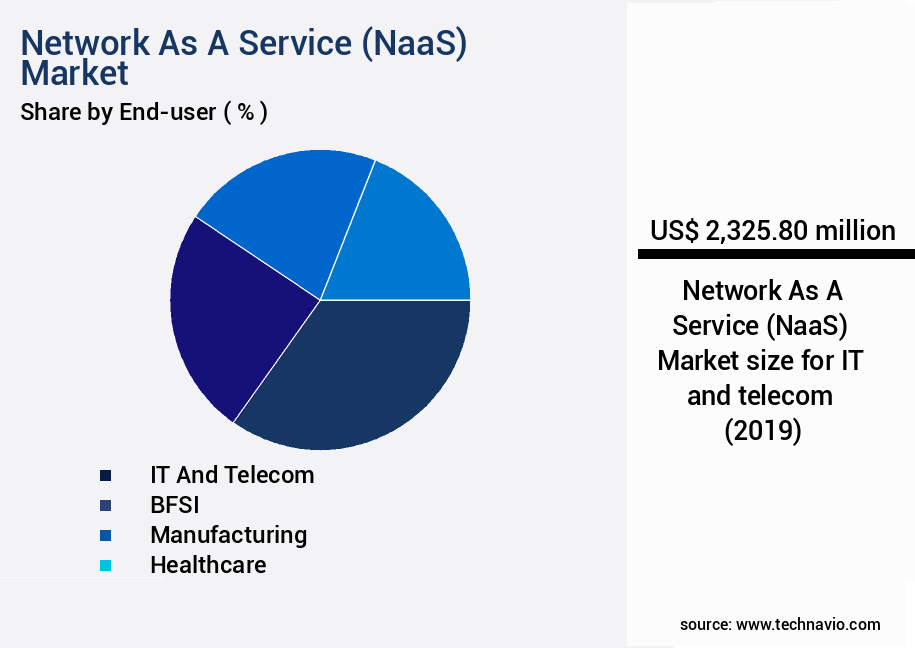
The IT and telecom segment was valued at USD 2.33 billion in 2019 and showed a gradual increase during the forecast period.
Regional Analysis
North America is estimated to contribute 39% to the growth of the global market during the forecast period.Technavio's analysts have elaborately explained the regional trends and drivers that shape the market during the forecast period.
See How Network As A Service (NaaS) Market Demand is Rising in North America Request Free Sample
In North America, the market holds a substantial share, with major contributions from the United States, Canada, and Mexico. The region's significant deployment of management systems, coupled with the expanding use of cloud computing and the IoT, fueled market growth in 2024. These trends result in a considerable increase in network traffic, necessitating advanced NaaS solutions for optimal network performance, availability, and security.
North America's advanced telecommunication infrastructure further boosts the demand for NaaS.
Market Dynamics
Our researchers analyzed the data with 2024 as the base year, along with the key drivers, trends, and challenges. A holistic analysis of drivers will help companies refine their marketing strategies to gain a competitive advantage.
The market is witnessing significant growth due to the increasing adoption of virtual network function deployment automation and software-defined networking architecture design. This shift towards more agile and flexible network solutions is crucial for the deployment of network slicing for 5G and the optimization of application performance through service chaining. Naas offers numerous benefits, including API management for network services, network function virtualization scalability, and high availability network architecture design. Bandwidth optimization techniques in cloud networking and latency reduction strategies for network services are also essential components of Naas, enabling elastic scaling for network infrastructure and improving overall network efficiency.
Security protocols for network virtualization and multi-tenancy support are crucial aspects of Naas, ensuring the protection of sensitive data and enabling service providers to cater to multiple clients simultaneously. Resource monitoring for network optimization and performance monitoring tools for virtual networks further enhance the value proposition of Naas. Network automation using infrastructure-as-code and cloud-native networking microservices architecture are gaining traction, with containerization for virtual network functions becoming increasingly popular. Dynamic routing protocols in SDN networks and service level agreement compliance metrics are essential for maintaining network performance and ensuring customer satisfaction. The Naas market is witnessing a notable trend towards capacity planning for network as a service, as service providers seek to meet the growing demand for reliable and high-performance network solutions.
According to market intelligence, adoption rates in the enterprise segment are nearly double those in the SMB sector, underscoring the significant potential for growth in this area. In conclusion, the Naas market is poised for continued expansion, driven by the increasing demand for agile, flexible, and secure network solutions. The integration of automation, optimization, and scalability features is key to meeting the evolving needs of businesses and service providers alike.
What are the key market drivers leading to the rise in the adoption of Network As A Service (NaaS) Industry?
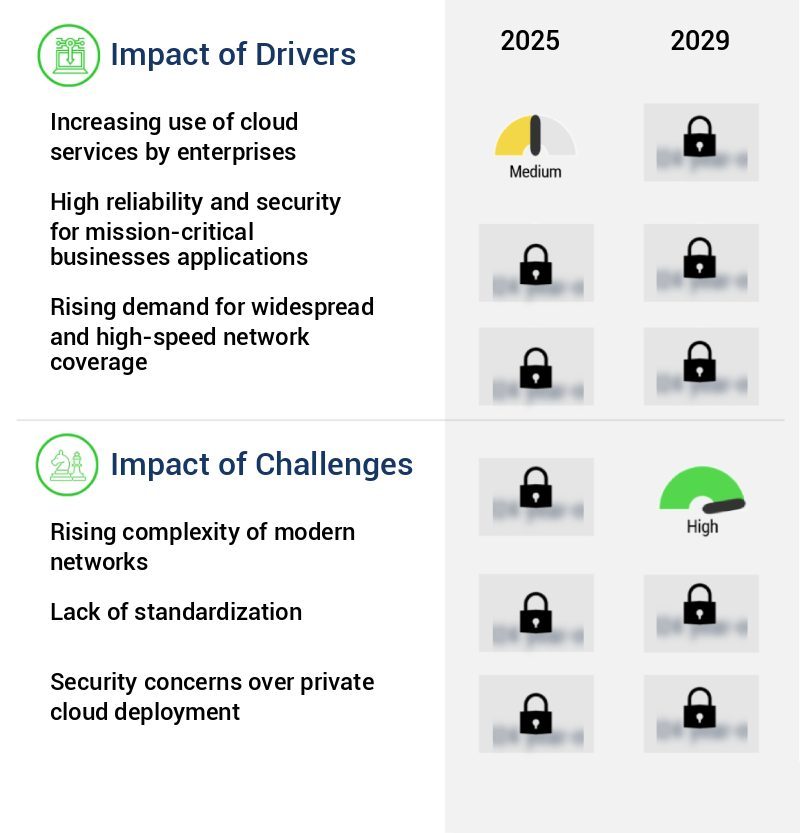
- The escalating adoption of cloud services by enterprises serves as the primary catalyst for market growth.
- The cloud computing market is experiencing significant growth due to the increasing adoption of technology and the shifting consumer preference towards cloud services. Enterprises are recognizing the benefits of storing and accessing data from remote locations, leading to a surge in demand for cloud-based solutions. According to recent studies, over 60% of corporate data is now stored in the cloud. This trend is expected to continue as businesses seek to save resources and enhance security, reliability, and business agility by moving their operations to cloud environments.
- The cloud services market is witnessing continuous evolution, with innovations in areas such as artificial intelligence, machine learning, and the Internet of Things (IoT) driving new applications across various sectors. This data-driven narrative underscores the importance of cloud computing in today's business landscape and the ongoing demand for cloud solutions among enterprises and small to medium-sized businesses (SMEs).
What are the market trends shaping the Network As A Service (NaaS) Industry?
- The increasing trend in the business world is a greater inclination toward cloud technology. This technological advancement is set to dominate the market in the upcoming period.
- The market for cloud computing, software-defined networking (SDN), and network virtualization is experiencing significant growth due to increased investments and collaborations among key players. This shift is driven by the adoption of cloud-based services by both large corporations and Small and Medium Enterprises (SMEs). These organizations are turning to cloud solutions as they offer cost savings compared to maintaining on-premises data centers and IT resources. The demand for on-demand access to applications, infrastructures, and IT resources has fueled the proliferation of virtual resource-sharing frameworks. Companies are utilizing network as a service components to transform physical networking elements into shareable virtual resources for data center connectivity.
- This transition enables organizations to efficiently manage their network resources and adapt to evolving business needs. Cloud computing, SDN, and network virtualization are continuously evolving, with ongoing developments and applications across various sectors. The flexibility and scalability offered by these technologies make them indispensable for modern businesses seeking to remain competitive and responsive in today's dynamic market landscape.
What challenges does the Network As A Service (NaaS) Industry face during its growth?
- The increasing complexity of modern networks poses a significant challenge to the growth of the industry, requiring professionals to stay abreast of advanced technologies and intricate system configurations.
- In the expanding global network as a service market, managing and monitoring complex, diverse, and distributed networks has emerged as a significant challenge. The sheer volume of data generated by modern networks, including network traffic, device configurations, and performance metrics, necessitates advanced network as a service solutions. These solutions provide enhanced network visibility and control, enabling organizations to optimize network performance and address potential issues. The proliferation of Internet of Things (IoT) devices and endpoints further complicates network management. Network as a service must process and analyze this data to ensure seamless connectivity and efficient management of these devices.
- By leveraging advanced analytics and automation, network as a service solutions offer valuable insights, enabling businesses to make informed decisions and maintain optimal network performance.
Exclusive Technavio Analysis on Customer Landscape
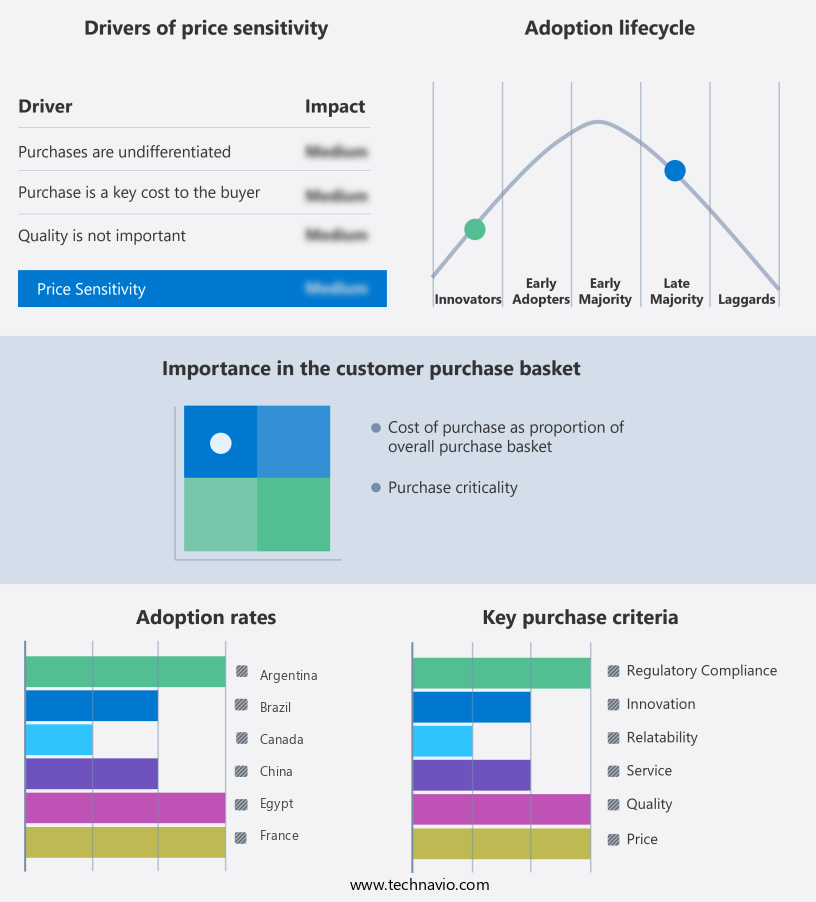
The network as a service (naas) market forecasting report includes the adoption lifecycle of the market, covering from the innovator's stage to the laggard's stage. It focuses on adoption rates in different regions based on penetration. Furthermore, the network as a service (naas) market report also includes key purchase criteria and drivers of price sensitivity to help companies evaluate and develop their market growth analysis strategies.
Customer Landscape of Network As A Service (NaaS) Industry
Competitive Landscape
Companies are implementing various strategies, such as strategic alliances, network as a service (naas) market forecast, partnerships, mergers and acquisitions, geographical expansion, and product/service launches, to enhance their presence in the industry.
Akamai Technologies Inc. - This company delivers Network-as-a-Service, including solutions like Create Firewall and DNS Manager, enabling businesses to secure and manage their digital infrastructure effectively.
The industry research and growth report includes detailed analyses of the competitive landscape of the market and information about key companies, including:
- Akamai Technologies Inc.
- Cisco Systems Inc.
- Forter Ltd.
- Imperva Inc.
- InfiSecure Technologies Inc.
- Intechnica Ltd.
- Kasada Pty Ltd.
- Megaport Ltd.
- Microsoft Corp.
- Nokia Corp.
- Oracle Corp.
- Pixalate Europe Ltd.
- Six Dee Netad Solutions Pvt. Ltd.
- Telstra Corp. Ltd.
- The Drupal Association
- Variti International GmbH
- VMware Inc.
Qualitative and quantitative analysis of companies has been conducted to help clients understand the wider business environment as well as the strengths and weaknesses of key industry players. Data is qualitatively analyzed to categorize companies as pure play, category-focused, industry-focused, and diversified; it is quantitatively analyzed to categorize companies as dominant, leading, strong, tentative, and weak.
Recent Development and News in Network As A Service (NaaS) Market
- In January 2024, Cisco Systems, a leading technology company, announced the global launch of its new Cisco Network as a Service (CNaaS) platform, enabling businesses to consume network services as a subscription (Cisco Press Release, 2024). This offering aimed to simplify network management and reduce operational costs for enterprises.
- In March 2024, VMware, a leading cloud infrastructure and digital workspace technology provider, entered into a strategic partnership with Verizon, a global communications and technology company, to offer VMware SD-WAN by Verizon as a Network as a Service (NaaS) solution (VMware Press Release, 2024). This collaboration aimed to deliver secure, reliable, and high-performance network services to businesses.
- In May 2024, Juniper Networks, a network security solutions provider, raised USD200 million in a funding round to accelerate its NaaS business growth and expand its global footprint (Juniper Networks Securities Filing, 2024). The company planned to invest in research and development, sales, and marketing efforts to strengthen its market position.
- In April 2025, the European Union (EU) approved the Network and Information Systems Security Directive (NIS2), which mandates essential services and digital service providers to adopt Network as a Service (NaaS) solutions to enhance their cybersecurity and resilience (European Commission Press Release, 2025). The directive is expected to drive significant growth in the European NaaS market.
Dive into Technavio's robust research methodology, blending expert interviews, extensive data synthesis, and validated models for unparalleled Network As A Service (NaaS) Market insights. See full methodology.
|
Market Scope |
|
|
Report Coverage |
Details |
|
Page number |
227 |
|
Base year |
2024 |
|
Historic period |
2019-2023 |
|
Forecast period |
2025-2029 |
|
Growth momentum & CAGR |
Accelerate at a CAGR of 24.7% |
|
Market growth 2025-2029 |
USD 44066.2 million |
|
Market structure |
Fragmented |
|
YoY growth 2024-2025(%) |
22.0 |
|
Key countries |
US, China, Germany, Canada, UK, Japan, France, India, Italy, and South Korea |
|
Competitive landscape |
Leading Companies, Market Positioning of Companies, Competitive Strategies, and Industry Risks |
Research Analyst Overview
- In the dynamic and evolving landscape of Network as a Service (Naas), various innovations continue to shape the market's trajectory. Network Function Virtualization (NFV) plays a pivotal role, enabling the replacement of hardware-based network functions with software-defined alternatives. This shift towards high availability and agility is further bolstered by Access Control Lists (ACLs), ensuring robust security and granular access control. Network Automation is another key trend, streamlining processes and reducing human intervention. Network Slicing offers customized network solutions, while Cloud-Native Networking and Software-Defined Networking (SDN) provide flexibility and programmability. Microservices Architecture, Service Level Agreements (SLAs), and Security Policies ensure optimal performance and protection.
- Network Orchestration and Multi-Tenancy Support facilitate efficient management and resource allocation. Latency reduction, Resource Monitoring, and API Management enhance user experience and scalability. Virtual Network Functions, Virtual Routing, and Bandwidth Optimization optimize network performance, while Quality of Service (QoS) ensures reliable delivery. Containerization Technology, Elastic Scaling, On-Demand Capacity, Service Chaining, Virtual Switching, and Performance Monitoring further bolster Naas capabilities. Fault Tolerance and Availability Metrics ensure uninterrupted services, and Network Virtualization and Security Protocols maintain robust security. Dynamic Routing and Disaster Recovery capabilities add resilience to the Naas infrastructure. These trends reflect the continuous evolution of the Naas market, with ongoing advancements in network functionality, automation, and security.
What are the Key Data Covered in this Network As A Service (NaaS) Market Research and Growth Report?
-
What is the expected growth of the Network As A Service (NaaS) Market between 2025 and 2029?
-
USD 44.07 billion, at a CAGR of 24.7%
-
-
What segmentation does the market report cover?
-
The report is segmented by End-user (IT and telecom, BFSI, Manufacturing, Healthcare, and Others), Type (WAN-as-a-service and LAN-as-a-service), Sector (Large enterprises and SMEs), Application (Cloud and SaaS connectivity, UCaaS and video conferencing, Virtual private network, and Others), and Geography (North America, Europe, APAC, South America, and Middle East and Africa)
-
-
Which regions are analyzed in the report?
-
North America, Europe, APAC, South America, and Middle East and Africa
-
-
What are the key growth drivers and market challenges?
-
Increasing use of cloud services by enterprises, Rising complexity of modern networks
-
-
Who are the major players in the Network As A Service (NaaS) Market?
-
Akamai Technologies Inc., Cisco Systems Inc., Forter Ltd., Imperva Inc., InfiSecure Technologies Inc., Intechnica Ltd., Kasada Pty Ltd., Megaport Ltd., Microsoft Corp., Nokia Corp., Oracle Corp., Pixalate Europe Ltd., Six Dee Netad Solutions Pvt. Ltd., Telstra Corp. Ltd., The Drupal Association, Variti International GmbH, and VMware Inc.
-
Market Research Insights
- The market encompasses a range of offerings, including application delivery, virtual private networks, capacity planning, monitoring dashboards, and more. According to recent estimates, the global NaAS market is projected to reach USD150 billion by 2025, growing at a compound annual growth rate of 25%. This growth is driven by the increasing demand for operational efficiency, SLAs, traffic engineering, and network programmability. In contrast, traditional network infrastructure, such as hardware acceleration and network architecture, is expected to decline at a CAGR of 5% during the same period. The shift towards NaAS solutions is attributed to their ability to offer cost optimization, network functions integration, and automation tools.
- However, challenges persist, including management platform complexity and deployment model selection. NaAS solutions encompass SDN controllers, NFV infrastructure, network telemetry, network function lifecycle management, and edge computing. Additionally, 5G network deployment and network security are key areas of focus in the evolving NaAS landscape.
We can help! Our analysts can customize this network as a service (naas) market research report to meet your requirements.
 RIA -
RIA - 
