Moto Taxi Service Market Analysis, Size, and Forecast 2026-2030: APAC (China, India, and Indonesia), Europe (Italy, Spain, and France), Middle East and Africa (South Africa), South America (Brazil and Colombia), North America (US, Mexico, and Canada), and Rest of World (ROW)

Moto Taxi Service Market Analysis, Size, and Forecast 2026-2030:
APAC (China, India, and Indonesia), Europe (Italy, Spain, and France), Middle East and Africa (South Africa), South America (Brazil and Colombia), North America (US, Mexico, and Canada), and Rest of World (ROW)

Published: Dec 2025 300 Pages SKU: IRTNTR73951

Market Overview at a Glance

$16.41 B
Market Opportunity
10.3%
CAGR 2025 - 2030
59.5%
APAC Growth
$22.65 B
E-hailing segment 2024

Moto Taxi Service Market Size 2026-2030

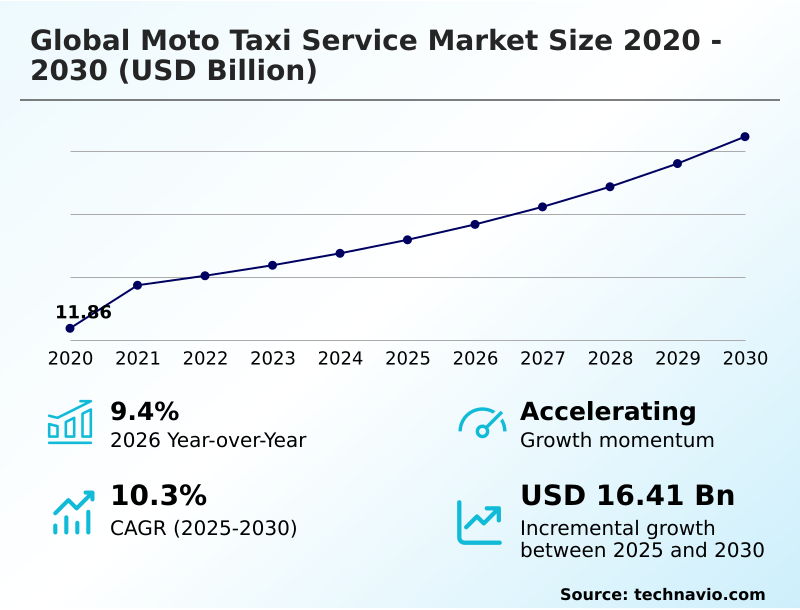
The moto taxi service market size is valued to increase by USD 16.41 billion, at a CAGR of 10.3% from 2025 to 2030. Increase in investments for moto taxi startups will drive the moto taxi service market.

Major Market Trends & Insights

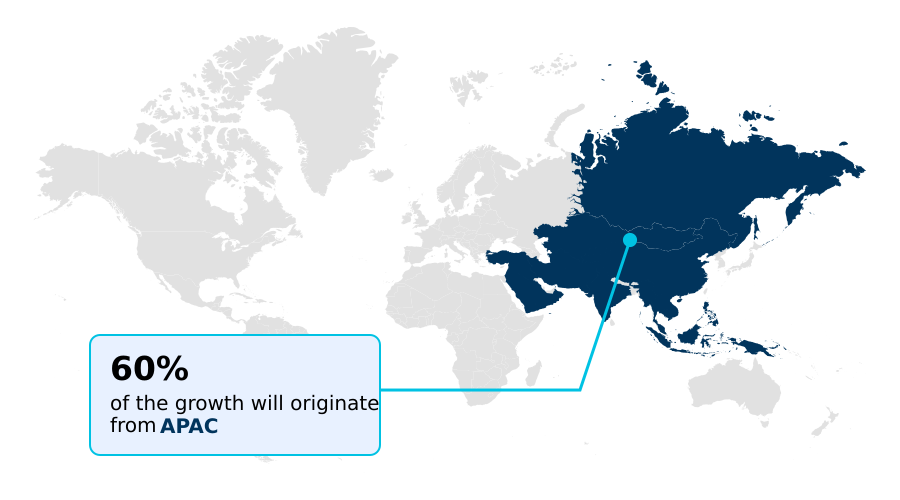
  • APAC dominated the market and accounted for a 59.5% growth during the forecast period.
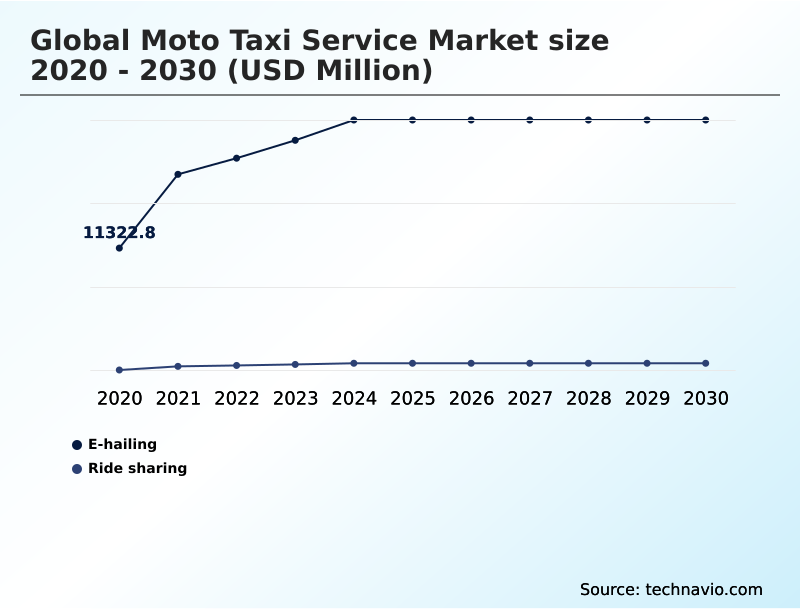
  • By Service - E-hailing segment was valued at USD 22.65 billion in 2024
  • By Application - Passenger segment accounted for the largest market revenue share in 2024

Market Size & Forecast

  • Market Opportunities: USD 30.49 billion
  • Market Future Opportunities: USD 16.41 billion
  • CAGR from 2025 to 2030 : 10.3%

Market Summary

  • The moto taxi service market is a dynamic sector centered on providing affordable and efficient two-wheeler mobility solutions. Driven by urbanization and persistent traffic congestion, these services fulfill a critical need for last-mile transportation and on-demand passenger transport.
  • The backbone of this market consists of digital ride-hailing platforms that leverage gps-based route navigation, real-time traffic analysis, and predictive demand modeling to optimize operations. For instance, a logistics company can integrate two-wheel load transport services to ensure rapid, last-mile delivery from urban fulfillment centers, bypassing traffic to meet tight consumer deadlines.
  • A key trend is the shift toward sustainability with the adoption of electric moto taxis, supported by advancements in swappable batteries and rapid-charging technology. However, the industry faces regulatory hurdles, including inconsistent rules on commercial two-wheeler transport and the need for mandatory insurance policies.
  • The development of comprehensive safety monitoring infrastructure and passenger safety protocols is crucial for building consumer trust and ensuring long-term viability in this evolving mobility landscape. This includes features like sos alerts and trip recording to enhance security.

What will be the Size of the Moto Taxi Service Market during the forecast period?

Get Key Insights on Market Forecast (PDF) Request Free Sample

How is the Moto Taxi Service Market Segmented?

The moto taxi service industry research report provides comprehensive data (region-wise segment analysis), with forecasts and estimates in "USD million" for the period 2026-2030, as well as historical data from 2020-2024 for the following segments.

  • Service
    • E-hailing
    • Ride sharing
  • Application
    • Passenger
    • Load
  • Vehicle type
    • Motorcycle
    • Scooters
  • Propulsion
    • ICE
    • Electric
  • Geography
    • APAC
      • China
      • India
      • Indonesia
    • Europe
      • Italy
      • Spain
      • France
    • Middle East and Africa
      • South Africa
    • South America
      • Brazil
      • Colombia
    • North America
      • US
      • Mexico
      • Canada
    • Rest of World (ROW)

By Service Insights

The e-hailing segment is estimated to witness significant growth during the forecast period.

The e-hailing segment is defined by its reliance on sophisticated digital frameworks to deliver on-demand transport access. Core to this model are ride-hailing platforms that utilize gps-based route navigation, automated dispatching, and ai-powered decision systems to connect passengers with riders.

This technology-centric approach, which includes rider verification systems and anti-fraud mechanisms, has driven significant operational improvements, with some platforms reporting that live-traffic adaptation tools have reduced estimated arrival times by 18%.

The integration of telematics-based behavior scoring and safety monitoring infrastructure addresses key concerns around passenger safety, while digital payment integration for moto taxis enhances user convenience.

The segment’s evolution is marked by continuous advancements in ai-powered analytics and app-based platforms to optimize last-mile transportation.

Request Free Sample

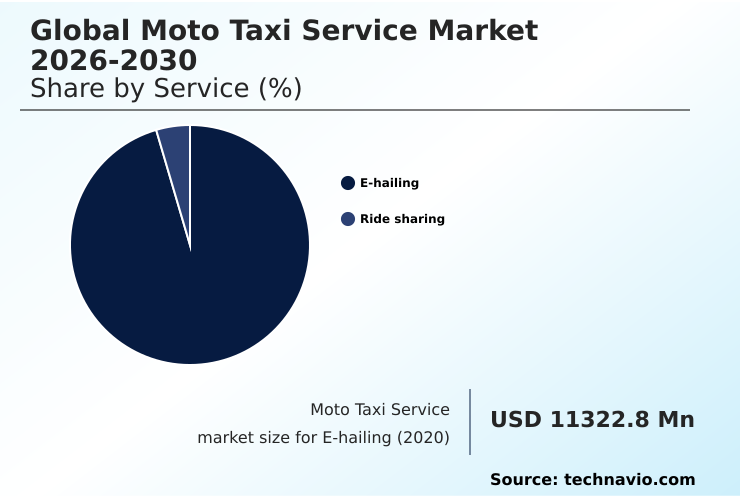
The E-hailing segment was valued at USD 22.65 billion in 2024 and showed a gradual increase during the forecast period.

Request Free Sample

Regional Analysis

APAC is estimated to contribute 59.5% to the growth of the global market during the forecast period.Technavio’s analysts have elaborately explained the regional trends and drivers that shape the market during the forecast period.

See How Moto Taxi Service Market Demand is Rising in APAC Request Free Sample

The geographic landscape is dominated by the APAC region, which is projected to account for nearly 59.5% of the market's incremental growth.

This expansion is fueled by high urbanization rates and the widespread adoption of digital mobility tools for short-distance commuting.

Countries like India, Indonesia, and Vietnam are epicenters of this growth, where motorcycle ride services offer a practical solution to severe traffic congestion.

The proliferation of smartphones and digital payments has facilitated the expansion of app-based platforms, which enhance on-demand passenger transport through features like ai-driven risk assessment and rider verification systems.

The region is also seeing a push toward fleet electrification, supported by government incentives.

This strategic shift is vital for operators aiming to provide sustainable commuter transportation services while navigating the complexities of this high-growth market, which is expanding at a regional rate of 11.3%.

Market Dynamics

Our researchers analyzed the data with 2025 as the base year, along with the key drivers, trends, and challenges. A holistic analysis of drivers will help companies refine their marketing strategies to gain a competitive advantage.

  • Strategic success in the market hinges on mastering several key operational areas. A primary focus is offering moto taxi service for last-mile connectivity, which requires sophisticated moto taxi fleet management software and dynamic pricing models for ride-hailing to balance supply and demand.
  • As the industry matures, navigating moto taxi regulatory frameworks becomes paramount, necessitating proactive engagement with policymakers to establish clear guidelines for compliance with commercial two-wheeler licensing. Simultaneously, operators must focus on improving moto taxi passenger safety features, such as implementing real-time tracking systems for moto taxis and implementing sos alerts in ride-hailing apps.
  • The vulnerability of two-wheelers to accidents makes robust moto taxi driver onboarding and training non-negotiable. Platforms that invest in predictive maintenance for two-wheeler fleets can achieve up to a 15% reduction in vehicle downtime compared to those relying on reactive repairs.
  • Effective marketing strategies for moto taxi platforms must also address how to manage competition from informal operators by highlighting superior safety and reliability. Ultimately, the role of moto taxis in smart cities will be defined by their ability to provide efficient, safe, and technologically integrated transportation solutions.

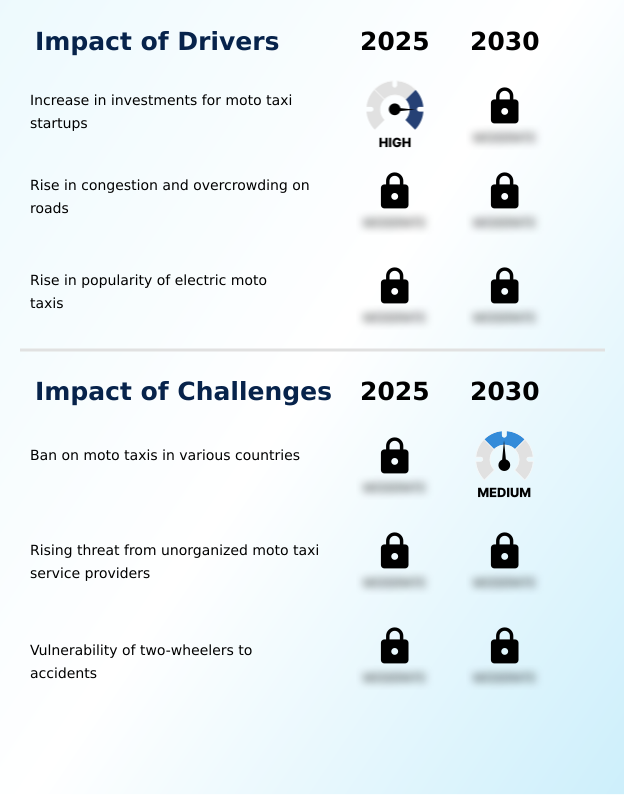
What are the key market drivers leading to the rise in the adoption of Moto Taxi Service Industry?

  • A notable increase in investments for moto taxi startups is a key driver propelling market growth and expansion.

  • Major drivers are propelling the market's expansion, primarily the growing need for efficient two-wheeler ride services in congested urban centers.
  • A surge in investments is enabling startups to scale fleet management technology and enhance driver onboarding processes, leading to faster service deployment.
  • The persistent issue of road congestion makes moto taxi services for urban logistics and passenger transport a practical necessity, with services reporting up to a 40% reduction in commute times on certain routes.
  • The adoption of electric moto taxis is another powerful driver, fueled by the lower operational costs and alignment with regulatory incentives promoting sustainable mobility solutions.
  • Advanced technologies like real-time traffic analysis and predictive demand modeling, integrated into ride-hailing platforms, are improving fleet utilization by over 15%, ensuring that two-wheeler mobility solutions are deployed where and when they are needed most.

What are the market trends shaping the Moto Taxi Service Industry?

  • The increasing use of social media and advanced analytics is a significant emerging trend, transforming customer engagement and operational optimization within the market.

  • Key trends are reshaping the operational and social fabric of the industry. The increasing use of social media analytics and ai-powered analytics allows operators of digital ride-hailing platforms to optimize fleet deployment and personalize marketing, improving rider engagement by up to 25%.
  • A significant social shift is the emergence of women driver training programs, which focus on defensive riding techniques and customer service to enhance passenger safety protocols. This not only expands the labor pool but also addresses safety perceptions, increasing ridership among female passengers.
  • Furthermore, the push for urban two-wheeler mobility is increasingly tied to sustainability, with operators integrating battery status monitoring and optimal route mapping for electric fleets, reducing carbon footprints in alignment with smart-city initiatives. Data-driven insights from rider performance monitoring are enabling a more efficient and responsive mobility ecosystem.

What challenges does the Moto Taxi Service Industry face during its growth?

  • The imposition of bans on moto taxis in various countries presents a key challenge that affects the industry's growth trajectory.

  • The industry grapples with significant challenges that temper its growth trajectory. The most pressing issue involves navigating inconsistent regulatory landscapes, where bans on commercial two-wheeler transport create operational uncertainty.
  • The prevalence of informal mobility providers and unregulated transport services presents another major hurdle, as they create an uneven competitive field and often bypass essential mandatory insurance policies and safety standards, eroding trust in the overall ecosystem.
  • Platforms that implement rigorous rider verification systems and ai-driven risk assessment can mitigate some of these risks, with data showing a 20% lower incident rate compared to services without such controls.
  • Additionally, the inherent vulnerability of two-wheelers to accidents necessitates continuous investment in rider training and advanced safety technologies like fall-detection sensors and geo-fenced driving zones to build and maintain passenger confidence in two-wheel solutions.

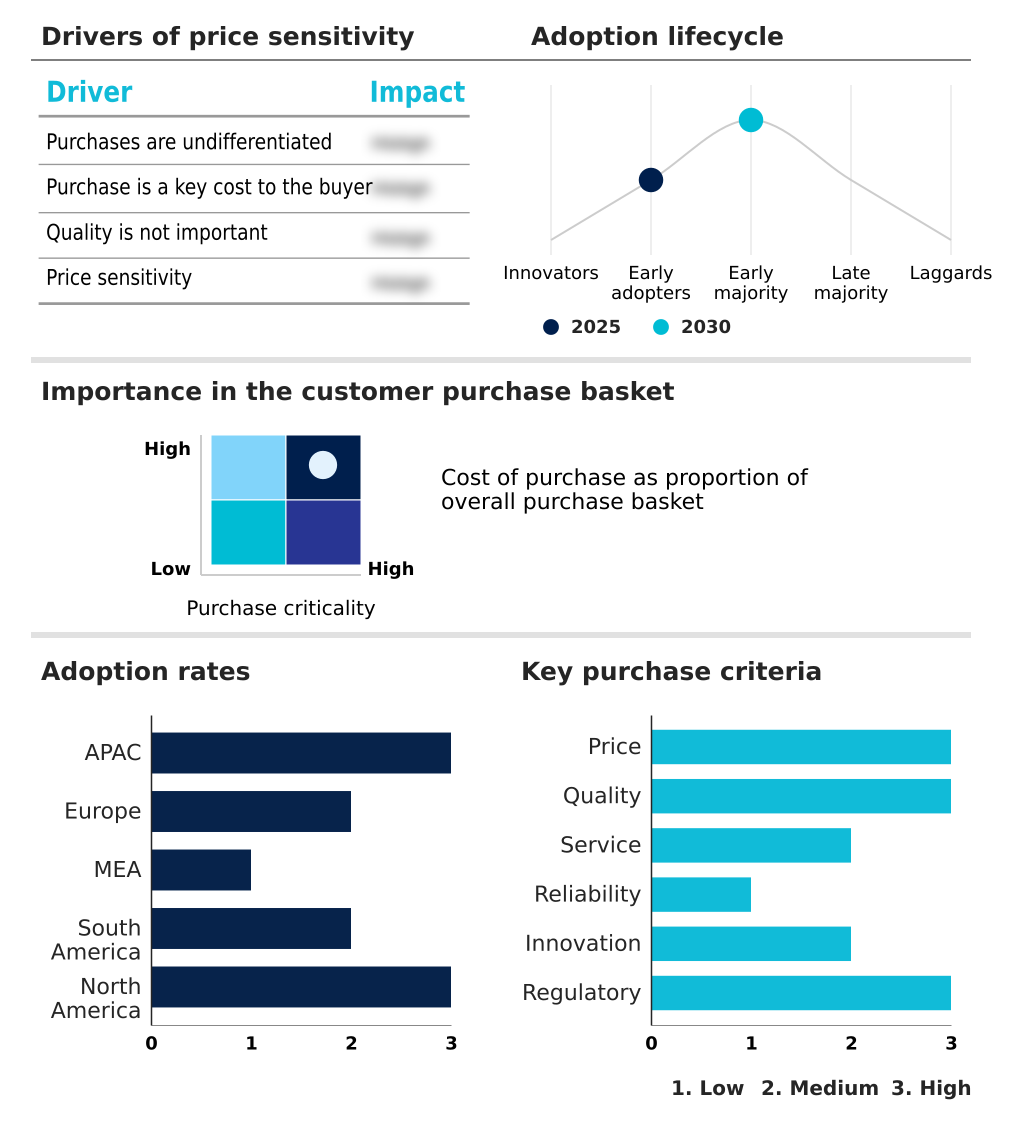
Exclusive Technavio Analysis on Customer Landscape

The moto taxi service market forecasting report includes the adoption lifecycle of the market, covering from the innovator’s stage to the laggard’s stage. It focuses on adoption rates in different regions based on penetration. Furthermore, the moto taxi service market report also includes key purchase criteria and drivers of price sensitivity to help companies evaluate and develop their market growth analysis strategies.

Customer Landscape of Moto Taxi Service Industry

Competitive Landscape

Companies are implementing various strategies, such as strategic alliances, moto taxi service market forecast, partnerships, mergers and acquisitions, geographical expansion, and product/service launches, to enhance their presence in the industry.

BikeBE - Key offerings center on integrated mobility and delivery platforms, connecting consumers with driver-partners for services ranging from passenger transport to on-demand parcel and meal delivery.

The industry research and growth report includes detailed analyses of the competitive landscape of the market and information about key companies, including:

  • BikeBE
  • Bolt Technology OU
  • DBDOYC Inc.
  • GoShare Inc.
  • Grab Holdings Ltd.
  • Guinness Transporters Ltd.
  • inDriver NA Inc.
  • JoyRide
  • LA Taximoto
  • MAX BIKES SDN BHD
  • Motoboy Sao Paulo
  • Motolead Prestige
  • MOVE IT
  • OnlineAuction.com
  • Piickme Ltd.
  • PT GoTo Gojek Tokopedia Tbk
  • Roppen Transportation Services
  • Ryde Technologies Pte. Ltd.​
  • Uber Technologies Inc.

Qualitative and quantitative analysis of companies has been conducted to help clients understand the wider business environment as well as the strengths and weaknesses of key industry players. Data is qualitatively analyzed to categorize companies as pure play, category-focused, industry-focused, and diversified; it is quantitatively analyzed to categorize companies as dominant, leading, strong, tentative, and weak.

Recent Development and News in Moto taxi service market

  • In February 2025, Roppen Transportation Services (Rapido) secured USD 27.8 million in an extended Series E funding round led by Prosus, reinforcing investor confidence in two-wheeler ride-hailing services.
  • In April 2025, the government of Maharashtra, India, approved regulations permitting electric moto taxis in numerous cities, creating a legal framework for operators like Roppen Transportation Services (Rapido) and Uber to deploy e-bike fleets.
  • In July 2025, PT GoTo Gojek Tokopedia Tbk (Gojek) expanded its two-wheeler ride-hailing fleet in Jakarta by over 2,000 motorcycles to address rising traffic congestion and improve last-mile mobility.
  • In January 2025, the Delhi Transport Department reiterated that commercial bike-taxi services using private-number plates, such as those offered by Roppen Transportation Services (Rapido) and Uber Technologies Inc. (UberMoto), remain non-compliant with transport laws, continuing regulatory challenges.

Dive into Technavio’s robust research methodology, blending expert interviews, extensive data synthesis, and validated models for unparalleled Moto Taxi Service Market insights. See full methodology.

Market Scope
Page number 300
Base year 2025
Historic period 2020-2024
Forecast period 2026-2030
Growth momentum & CAGR Accelerate at a CAGR of 10.3%
Market growth 2026-2030 USD 16409.0 million
Market structure Fragmented
YoY growth 2025-2026(%) 9.4%
Key countries China, India, Indonesia, Vietnam, Thailand, Singapore, Italy, Spain, France, UK, Germany, The Netherlands, Nigeria, Kenya, Egypt, South Africa, Morocco, Brazil, Colombia, Peru, US, Mexico and Canada
Competitive landscape Leading Companies, Market Positioning of Companies, Competitive Strategies, and Industry Risks

Request Free Sample

Research Analyst Overview

  • The market is undergoing a significant transformation, driven by the integration of advanced technologies into ride-hailing platforms. These platforms utilize gps-based route navigation, automated dispatching, and ai-powered decision systems to provide efficient last-mile transportation. A key boardroom consideration is the alignment of fleet strategy with ESG goals, which is accelerating the adoption of electric moto taxis.
  • This transition to fleet electrification is supported by innovations like swappable batteries and rapid-charging technology, which minimize operational downtime. The implementation of robust safety monitoring infrastructure, including telematics-based behavior scoring, sos alerts, and trip recording, is critical for gaining regulatory approval and building consumer trust.
  • Platforms that effectively integrate digital dispatch systems, predictive maintenance platforms, and real-time traffic analysis are achieving superior operational efficiency, with some reporting a reduction in passenger wait times by over 20%. The market's future will be shaped by how well operators leverage ai-powered analytics and predictive analytics to manage everything from rider performance monitoring to predictive demand modeling.

What are the Key Data Covered in this Moto Taxi Service Market Research and Growth Report?

  • What is the expected growth of the Moto Taxi Service Market between 2026 and 2030?

    • USD 16.41 billion, at a CAGR of 10.3%

  • What segmentation does the market report cover?

    • The report is segmented by Service (E-hailing, and Ride sharing), Application (Passenger, and Load), Vehicle Type (Motorcycle, and Scooters), Propulsion (ICE, and Electric) and Geography (APAC, Europe, Middle East and Africa, South America, North America)

  • Which regions are analyzed in the report?

    • APAC, Europe, Middle East and Africa, South America and North America

  • What are the key growth drivers and market challenges?

    • Increase in investments for moto taxi startups, Ban on moto taxis in various countries

  • Who are the major players in the Moto Taxi Service Market?

    • BikeBE, Bolt Technology OU, DBDOYC Inc., GoShare Inc., Grab Holdings Ltd., Guinness Transporters Ltd., inDriver NA Inc., JoyRide, LA Taximoto, MAX BIKES SDN BHD, Motoboy Sao Paulo, Motolead Prestige, MOVE IT, OnlineAuction.com, Piickme Ltd., PT GoTo Gojek Tokopedia Tbk, Roppen Transportation Services, Ryde Technologies Pte. Ltd.​ and Uber Technologies Inc.

Market Research Insights

  • The market's dynamics are shaped by the growing demand for efficient urban mobility solutions and flexible last-mile transportation. Digital app-based ride-hailing platforms are central, leveraging technology to improve service delivery; optimized driver onboarding processes have been shown to increase fleet availability by over 20% in high-demand zones.
  • The rise of two-wheeler ride services addresses urban congestion, with data indicating that optimized routing can reduce commuter travel times by up to 30% compared to four-wheeled alternatives. As cities push for sustainable mobility solutions, operators are integrating battery status monitoring and optimal route mapping for electric fleets.
  • This focus on technology-driven efficiency and sustainability is critical for navigating competition from unregulated transport services and meeting the evolving demands for reliable last-mile connectivity in modern urban ecosystems.

We can help! Our analysts can customize this moto taxi service market research report to meet your requirements.

Get in touch

1. Executive Summary

1.1 Market overview

Executive Summary - Chart on Market Overview
Executive Summary - Data Table on Market Overview
Executive Summary - Chart on Global Market Characteristics
Executive Summary - Chart on Market by Geography
Executive Summary - Chart on Market Segmentation by Service
Executive Summary - Chart on Market Segmentation by Application
Executive Summary - Chart on Market Segmentation by Vehicle Type
Executive Summary - Chart on Market Segmentation by Propulsion
Executive Summary - Chart on Incremental Growth
Executive Summary - Data Table on Incremental Growth
Executive Summary - Chart on Company Market Positioning

2. Technavio Analysis

2.1 Analysis of price sensitivity, lifecycle, customer purchase basket, adoption rates, and purchase criteria

2.2 Criticality of inputs and Factors of differentiation

Chart on Overview on criticality of inputs and factors of differentiation

2.3 Factors of disruption

Chart on Overview on factors of disruption

2.4 Impact of drivers and challenges

Chart on Impact of drivers and challenges in 2025 and 2030

3. Market Landscape

3.1 Market ecosystem

Chart on Parent Market
Data Table on - Parent Market

3.2 Market characteristics

Chart on Market characteristics analysis

3.3 Value chain analysis

Chart on Value chain analysis

4. Market Sizing

4.1 Market definition

Data Table on Offerings of companies included in the market definition

4.2 Market segment analysis

Market segments

4.3 Market size 2025

4.4 Market outlook: Forecast for 2025-2030

Chart on Global - Market size and forecast 2025-2030 ($ million)
Data Table on Global - Market size and forecast 2025-2030 ($ million)
Chart on Global Market: Year-over-year growth 2025-2030 (%)
Data Table on Global Market: Year-over-year growth 2025-2030 (%)

5. Historic Market Size

5.1 Global Moto Taxi Service Market 2020 - 2024

Historic Market Size - Data Table on Global Moto Taxi Service Market 2020 - 2024 ($ million)

5.2 Service segment analysis 2020 - 2024

Historic Market Size - Service Segment 2020 - 2024 ($ million)

5.3 Application segment analysis 2020 - 2024

Historic Market Size - Application Segment 2020 - 2024 ($ million)

5.4 Vehicle Type segment analysis 2020 - 2024

Historic Market Size - Vehicle Type Segment 2020 - 2024 ($ million)

5.5 Propulsion segment analysis 2020 - 2024

Historic Market Size - Propulsion Segment 2020 - 2024 ($ million)

5.6 Geography segment analysis 2020 - 2024

Historic Market Size - Geography Segment 2020 - 2024 ($ million)

5.7 Country segment analysis 2020 - 2024

Historic Market Size - Country Segment 2020 - 2024 ($ million)

6. Qualitative Analysis

6.1 AI Impact on Global Moto Taxi Service Market

7. Five Forces Analysis

7.1 Five forces summary

Five forces analysis - Comparison between 2025 and 2030

7.2 Bargaining power of buyers

Bargaining power of buyers - Impact of key factors 2025 and 2030

7.3 Bargaining power of suppliers

Bargaining power of suppliers - Impact of key factors in 2025 and 2030

7.4 Threat of new entrants

Threat of new entrants - Impact of key factors in 2025 and 2030

7.5 Threat of substitutes

Threat of substitutes - Impact of key factors in 2025 and 2030

7.6 Threat of rivalry

Threat of rivalry - Impact of key factors in 2025 and 2030

7.7 Market condition

Chart on Market condition - Five forces 2025 and 2030

8. Market Segmentation by Service

8.1 Market segments

Chart on Service - Market share 2025-2030 (%)
Data Table on Service - Market share 2025-2030 (%)

8.2 Comparison by Service

Chart on Comparison by Service
Data Table on Comparison by Service

8.3 E-hailing - Market size and forecast 2025-2030

Chart on E-hailing - Market size and forecast 2025-2030 ($ million)
Data Table on E-hailing - Market size and forecast 2025-2030 ($ million)
Chart on E-hailing - Year-over-year growth 2025-2030 (%)
Data Table on E-hailing - Year-over-year growth 2025-2030 (%)

8.4 Ride sharing - Market size and forecast 2025-2030

Chart on Ride sharing - Market size and forecast 2025-2030 ($ million)
Data Table on Ride sharing - Market size and forecast 2025-2030 ($ million)
Chart on Ride sharing - Year-over-year growth 2025-2030 (%)
Data Table on Ride sharing - Year-over-year growth 2025-2030 (%)

8.5 Market opportunity by Service

Market opportunity by Service ($ million)
Data Table on Market opportunity by Service ($ million)

9. Market Segmentation by Application

9.1 Market segments

Chart on Application - Market share 2025-2030 (%)
Data Table on Application - Market share 2025-2030 (%)

9.2 Comparison by Application

Chart on Comparison by Application
Data Table on Comparison by Application

9.3 Passenger - Market size and forecast 2025-2030

Chart on Passenger - Market size and forecast 2025-2030 ($ million)
Data Table on Passenger - Market size and forecast 2025-2030 ($ million)
Chart on Passenger - Year-over-year growth 2025-2030 (%)
Data Table on Passenger - Year-over-year growth 2025-2030 (%)

9.4 Load - Market size and forecast 2025-2030

Chart on Load - Market size and forecast 2025-2030 ($ million)
Data Table on Load - Market size and forecast 2025-2030 ($ million)
Chart on Load - Year-over-year growth 2025-2030 (%)
Data Table on Load - Year-over-year growth 2025-2030 (%)

9.5 Market opportunity by Application

Market opportunity by Application ($ million)
Data Table on Market opportunity by Application ($ million)

10. Market Segmentation by Vehicle Type

10.1 Market segments

Chart on Vehicle Type - Market share 2025-2030 (%)
Data Table on Vehicle Type - Market share 2025-2030 (%)

10.2 Comparison by Vehicle Type

Chart on Comparison by Vehicle Type
Data Table on Comparison by Vehicle Type

10.3 Motorcycle - Market size and forecast 2025-2030

Chart on Motorcycle - Market size and forecast 2025-2030 ($ million)
Data Table on Motorcycle - Market size and forecast 2025-2030 ($ million)
Chart on Motorcycle - Year-over-year growth 2025-2030 (%)
Data Table on Motorcycle - Year-over-year growth 2025-2030 (%)

10.4 Scooters - Market size and forecast 2025-2030

Chart on Scooters - Market size and forecast 2025-2030 ($ million)
Data Table on Scooters - Market size and forecast 2025-2030 ($ million)
Chart on Scooters - Year-over-year growth 2025-2030 (%)
Data Table on Scooters - Year-over-year growth 2025-2030 (%)

10.5 Market opportunity by Vehicle Type

Market opportunity by Vehicle Type ($ million)
Data Table on Market opportunity by Vehicle Type ($ million)

11. Market Segmentation by Propulsion

11.1 Market segments

Chart on Propulsion - Market share 2025-2030 (%)
Data Table on Propulsion - Market share 2025-2030 (%)

11.2 Comparison by Propulsion

Chart on Comparison by Propulsion
Data Table on Comparison by Propulsion

11.3 ICE - Market size and forecast 2025-2030

Chart on ICE - Market size and forecast 2025-2030 ($ million)
Data Table on ICE - Market size and forecast 2025-2030 ($ million)
Chart on ICE - Year-over-year growth 2025-2030 (%)
Data Table on ICE - Year-over-year growth 2025-2030 (%)

11.4 Electric - Market size and forecast 2025-2030

Chart on Electric - Market size and forecast 2025-2030 ($ million)
Data Table on Electric - Market size and forecast 2025-2030 ($ million)
Chart on Electric - Year-over-year growth 2025-2030 (%)
Data Table on Electric - Year-over-year growth 2025-2030 (%)

11.5 Market opportunity by Propulsion

Market opportunity by Propulsion ($ million)
Data Table on Market opportunity by Propulsion ($ million)

12. Customer Landscape

12.1 Customer landscape overview

Analysis of price sensitivity, lifecycle, customer purchase basket, adoption rates, and purchase criteria

13. Geographic Landscape

13.1 Geographic segmentation

Chart on Market share by geography 2025-2030 (%)
Data Table on Market share by geography 2025-2030 (%)

13.2 Geographic comparison

Chart on Geographic comparison
Data Table on Geographic comparison

13.3 APAC - Market size and forecast 2025-2030

Chart on APAC - Market size and forecast 2025-2030 ($ million)
Data Table on APAC - Market size and forecast 2025-2030 ($ million)
Chart on APAC - Year-over-year growth 2025-2030 (%)
Data Table on APAC - Year-over-year growth 2025-2030 (%)
Chart on Regional Comparison - APAC
Data Table on Regional Comparison - APAC

13.3.1 China - Market size and forecast 2025-2030

Chart on China - Market size and forecast 2025-2030 ($ million)
Data Table on China - Market size and forecast 2025-2030 ($ million)
Chart on China - Year-over-year growth 2025-2030 (%)
Data Table on China - Year-over-year growth 2025-2030 (%)

13.3.2 India - Market size and forecast 2025-2030

Chart on India - Market size and forecast 2025-2030 ($ million)
Data Table on India - Market size and forecast 2025-2030 ($ million)
Chart on India - Year-over-year growth 2025-2030 (%)
Data Table on India - Year-over-year growth 2025-2030 (%)

13.3.3 Indonesia - Market size and forecast 2025-2030

Chart on Indonesia - Market size and forecast 2025-2030 ($ million)
Data Table on Indonesia - Market size and forecast 2025-2030 ($ million)
Chart on Indonesia - Year-over-year growth 2025-2030 (%)
Data Table on Indonesia - Year-over-year growth 2025-2030 (%)

13.3.4 Vietnam - Market size and forecast 2025-2030

Chart on Vietnam - Market size and forecast 2025-2030 ($ million)
Data Table on Vietnam - Market size and forecast 2025-2030 ($ million)
Chart on Vietnam - Year-over-year growth 2025-2030 (%)
Data Table on Vietnam - Year-over-year growth 2025-2030 (%)

13.3.5 Thailand - Market size and forecast 2025-2030

Chart on Thailand - Market size and forecast 2025-2030 ($ million)
Data Table on Thailand - Market size and forecast 2025-2030 ($ million)
Chart on Thailand - Year-over-year growth 2025-2030 (%)
Data Table on Thailand - Year-over-year growth 2025-2030 (%)

13.3.6 Singapore - Market size and forecast 2025-2030

Chart on Singapore - Market size and forecast 2025-2030 ($ million)
Data Table on Singapore - Market size and forecast 2025-2030 ($ million)
Chart on Singapore - Year-over-year growth 2025-2030 (%)
Data Table on Singapore - Year-over-year growth 2025-2030 (%)

13.4 Europe - Market size and forecast 2025-2030

Chart on Europe - Market size and forecast 2025-2030 ($ million)
Data Table on Europe - Market size and forecast 2025-2030 ($ million)
Chart on Europe - Year-over-year growth 2025-2030 (%)
Data Table on Europe - Year-over-year growth 2025-2030 (%)
Chart on Regional Comparison - Europe
Data Table on Regional Comparison - Europe

13.4.1 Italy - Market size and forecast 2025-2030

Chart on Italy - Market size and forecast 2025-2030 ($ million)
Data Table on Italy - Market size and forecast 2025-2030 ($ million)
Chart on Italy - Year-over-year growth 2025-2030 (%)
Data Table on Italy - Year-over-year growth 2025-2030 (%)

13.4.2 Spain - Market size and forecast 2025-2030

Chart on Spain - Market size and forecast 2025-2030 ($ million)
Data Table on Spain - Market size and forecast 2025-2030 ($ million)
Chart on Spain - Year-over-year growth 2025-2030 (%)
Data Table on Spain - Year-over-year growth 2025-2030 (%)

13.4.3 France - Market size and forecast 2025-2030

Chart on France - Market size and forecast 2025-2030 ($ million)
Data Table on France - Market size and forecast 2025-2030 ($ million)
Chart on France - Year-over-year growth 2025-2030 (%)
Data Table on France - Year-over-year growth 2025-2030 (%)

13.4.4 UK - Market size and forecast 2025-2030

Chart on UK - Market size and forecast 2025-2030 ($ million)
Data Table on UK - Market size and forecast 2025-2030 ($ million)
Chart on UK - Year-over-year growth 2025-2030 (%)
Data Table on UK - Year-over-year growth 2025-2030 (%)

13.4.5 Germany - Market size and forecast 2025-2030

Chart on Germany - Market size and forecast 2025-2030 ($ million)
Data Table on Germany - Market size and forecast 2025-2030 ($ million)
Chart on Germany - Year-over-year growth 2025-2030 (%)
Data Table on Germany - Year-over-year growth 2025-2030 (%)

13.4.6 The Netherlands - Market size and forecast 2025-2030

Chart on The Netherlands - Market size and forecast 2025-2030 ($ million)
Data Table on The Netherlands - Market size and forecast 2025-2030 ($ million)
Chart on The Netherlands - Year-over-year growth 2025-2030 (%)
Data Table on The Netherlands - Year-over-year growth 2025-2030 (%)

13.5 Middle East and Africa - Market size and forecast 2025-2030

Chart on Middle East and Africa - Market size and forecast 2025-2030 ($ million)
Data Table on Middle East and Africa - Market size and forecast 2025-2030 ($ million)
Chart on Middle East and Africa - Year-over-year growth 2025-2030 (%)
Data Table on Middle East and Africa - Year-over-year growth 2025-2030 (%)
Chart on Regional Comparison - Middle East and Africa
Data Table on Regional Comparison - Middle East and Africa

13.5.1 Nigeria - Market size and forecast 2025-2030

Chart on Nigeria - Market size and forecast 2025-2030 ($ million)
Data Table on Nigeria - Market size and forecast 2025-2030 ($ million)
Chart on Nigeria - Year-over-year growth 2025-2030 (%)
Data Table on Nigeria - Year-over-year growth 2025-2030 (%)

13.5.2 Kenya - Market size and forecast 2025-2030

Chart on Kenya - Market size and forecast 2025-2030 ($ million)
Data Table on Kenya - Market size and forecast 2025-2030 ($ million)
Chart on Kenya - Year-over-year growth 2025-2030 (%)
Data Table on Kenya - Year-over-year growth 2025-2030 (%)

13.5.3 Egypt - Market size and forecast 2025-2030

Chart on Egypt - Market size and forecast 2025-2030 ($ million)
Data Table on Egypt - Market size and forecast 2025-2030 ($ million)
Chart on Egypt - Year-over-year growth 2025-2030 (%)
Data Table on Egypt - Year-over-year growth 2025-2030 (%)

13.5.4 South Africa - Market size and forecast 2025-2030

Chart on South Africa - Market size and forecast 2025-2030 ($ million)
Data Table on South Africa - Market size and forecast 2025-2030 ($ million)
Chart on South Africa - Year-over-year growth 2025-2030 (%)
Data Table on South Africa - Year-over-year growth 2025-2030 (%)

13.5.5 Morocco - Market size and forecast 2025-2030

Chart on Morocco - Market size and forecast 2025-2030 ($ million)
Data Table on Morocco - Market size and forecast 2025-2030 ($ million)
Chart on Morocco - Year-over-year growth 2025-2030 (%)
Data Table on Morocco - Year-over-year growth 2025-2030 (%)

13.6 South America - Market size and forecast 2025-2030

Chart on South America - Market size and forecast 2025-2030 ($ million)
Data Table on South America - Market size and forecast 2025-2030 ($ million)
Chart on South America - Year-over-year growth 2025-2030 (%)
Data Table on South America - Year-over-year growth 2025-2030 (%)
Chart on Regional Comparison - South America
Data Table on Regional Comparison - South America

13.6.1 Brazil - Market size and forecast 2025-2030

Chart on Brazil - Market size and forecast 2025-2030 ($ million)
Data Table on Brazil - Market size and forecast 2025-2030 ($ million)
Chart on Brazil - Year-over-year growth 2025-2030 (%)
Data Table on Brazil - Year-over-year growth 2025-2030 (%)

13.6.2 Colombia - Market size and forecast 2025-2030

Chart on Colombia - Market size and forecast 2025-2030 ($ million)
Data Table on Colombia - Market size and forecast 2025-2030 ($ million)
Chart on Colombia - Year-over-year growth 2025-2030 (%)
Data Table on Colombia - Year-over-year growth 2025-2030 (%)

13.6.3 Peru - Market size and forecast 2025-2030

Chart on Peru - Market size and forecast 2025-2030 ($ million)
Data Table on Peru - Market size and forecast 2025-2030 ($ million)
Chart on Peru - Year-over-year growth 2025-2030 (%)
Data Table on Peru - Year-over-year growth 2025-2030 (%)

13.7 North America - Market size and forecast 2025-2030

Chart on North America - Market size and forecast 2025-2030 ($ million)
Data Table on North America - Market size and forecast 2025-2030 ($ million)
Chart on North America - Year-over-year growth 2025-2030 (%)
Data Table on North America - Year-over-year growth 2025-2030 (%)
Chart on Regional Comparison - North America
Data Table on Regional Comparison - North America

13.7.1 US - Market size and forecast 2025-2030

Chart on US - Market size and forecast 2025-2030 ($ million)
Data Table on US - Market size and forecast 2025-2030 ($ million)
Chart on US - Year-over-year growth 2025-2030 (%)
Data Table on US - Year-over-year growth 2025-2030 (%)

13.7.2 Mexico - Market size and forecast 2025-2030

Chart on Mexico - Market size and forecast 2025-2030 ($ million)
Data Table on Mexico - Market size and forecast 2025-2030 ($ million)
Chart on Mexico - Year-over-year growth 2025-2030 (%)
Data Table on Mexico - Year-over-year growth 2025-2030 (%)

13.7.3 Canada - Market size and forecast 2025-2030

Chart on Canada - Market size and forecast 2025-2030 ($ million)
Data Table on Canada - Market size and forecast 2025-2030 ($ million)
Chart on Canada - Year-over-year growth 2025-2030 (%)
Data Table on Canada - Year-over-year growth 2025-2030 (%)

13.8 Market opportunity by geography

Market opportunity by geography ($ million)
Data Tables on Market opportunity by geography ($ million)

14. Drivers, Challenges, and Opportunity

14.1 Market drivers

Increase in investments for moto taxi startups
Rise in congestion and overcrowding on roads
Rise in popularity of electric moto taxis

14.2 Market challenges

Ban on moto taxis in various countries
Rising threat from unorganized moto taxi service providers
Vulnerability of two-wheelers to accidents

14.3 Impact of drivers and challenges

Impact of drivers and challenges in 2025 and 2030

14.4 Market opportunities

Increasing use of social media and analytics
Emergence of women drivers for moto taxis
Rise in need of electric moto taxis as mode of transportation

15. Competitive Landscape

15.1 Overview

15.2

Overview on criticality of inputs and factors of differentiation

15.3 Landscape disruption

Overview on factors of disruption

15.4 Industry risks

Impact of key risks on business

16. Competitive Analysis

16.1 Companies profiled

Companies covered

16.2 Company ranking index

16.3 Market positioning of companies

Matrix on companies position and classification

16.4 DBDOYC Inc.

DBDOYC Inc. - Overview
DBDOYC Inc. - Product / Service
DBDOYC Inc. - Key offerings
SWOT

16.5 GoShare Inc.

GoShare Inc. - Overview
GoShare Inc. - Product / Service
GoShare Inc. - Key offerings
SWOT

16.6 Grab Holdings Ltd.

Grab Holdings Ltd. - Overview
Grab Holdings Ltd. - Business segments
Grab Holdings Ltd. - Key offerings
Grab Holdings Ltd. - Segment focus
SWOT

16.7 Guinness Transporters Ltd.

Guinness Transporters Ltd. - Overview
Guinness Transporters Ltd. - Product / Service
Guinness Transporters Ltd. - Key offerings
SWOT

16.8 inDriver NA Inc.

inDriver NA Inc. - Overview
inDriver NA Inc. - Product / Service
inDriver NA Inc. - Key offerings
SWOT

16.9 JoyRide

JoyRide - Overview
JoyRide - Product / Service
JoyRide - Key offerings
SWOT

16.10 LA Taximoto

LA Taximoto - Overview
LA Taximoto - Product / Service
LA Taximoto - Key offerings
SWOT

16.11 MAX BIKES SDN BHD

MAX BIKES SDN BHD - Overview
MAX BIKES SDN BHD - Product / Service
MAX BIKES SDN BHD - Key offerings
SWOT

16.12 Motoboy Sao Paulo

Motoboy Sao Paulo - Overview
Motoboy Sao Paulo - Product / Service
Motoboy Sao Paulo - Key offerings
SWOT

16.13 Motolead Prestige

Motolead Prestige - Overview
Motolead Prestige - Product / Service
Motolead Prestige - Key offerings
SWOT

16.14 MOVE IT

MOVE IT - Overview
MOVE IT - Product / Service
MOVE IT - Key offerings
SWOT

16.15 OnlineAuction.com

OnlineAuction.com - Overview
OnlineAuction.com - Product / Service
OnlineAuction.com - Key offerings
SWOT

16.16 Piickme Ltd.

Piickme Ltd. - Overview
Piickme Ltd. - Product / Service
Piickme Ltd. - Key offerings
SWOT

16.17 PT GoTo Gojek Tokopedia Tbk

PT GoTo Gojek Tokopedia Tbk - Overview
PT GoTo Gojek Tokopedia Tbk - Product / Service
PT GoTo Gojek Tokopedia Tbk - Key offerings
SWOT

16.18 Roppen Transportation Services

Roppen Transportation Services - Overview
Roppen Transportation Services - Product / Service
Roppen Transportation Services - Key offerings
SWOT

17. Appendix

17.1 Scope of the report

Market definition
Objectives
Notes and caveats

17.2 Inclusions and exclusions checklist

Inclusions checklist
Exclusions checklist

17.3 Currency conversion rates for US$

17.4 Research methodology

17.5 Data procurement

Information sources

17.6 Data validation

17.7 Validation techniques employed for market sizing

17.8 Data synthesis

17.9 360 degree market analysis

17.10 List of abbreviations

Research Methodology

Technavio presents a detailed picture of the market by way of study, synthesis, and summation of data from multiple sources. The analysts have presented the various facets of the market with a particular focus on identifying the key industry influencers. The data thus presented is comprehensive, reliable, and the result of extensive research, both primary and secondary.

INFORMATION SOURCES

Primary sources

  • Manufacturers and suppliers
  • Channel partners
  • Industry experts
  • Strategic decision makers

Secondary sources

  • Industry journals and periodicals
  • Government data
  • Financial reports of key industry players
  • Historical data
  • Press releases

DATA ANALYSIS

Data Synthesis

  • Collation of data
  • Estimation of key figures
  • Analysis of derived insights

Data Validation

  • Triangulation with data models
  • Reference against proprietary databases
  • Corroboration with industry experts

REPORT WRITING

Qualitative

  • Market drivers
  • Market challenges
  • Market trends
  • Five forces analysis

Quantitative

  • Market size and forecast
  • Market segmentation
  • Geographical insights
  • Competitive landscape

Interested in this report?

Get your sample now to see our research methodology and insights!

Download Now

Frequently Asked Questions

Moto Taxi Service market growth will increase by USD 16409.0 million during 2026-2030 .

The Moto Taxi Service market is expected to grow at a CAGR of 10.3% during 2026-2030 .

Moto Taxi Service market is segmented by Service (E-hailing, Ride sharing) Application (Passenger, Load) Vehicle type (Motorcycle, Scooters) Propulsion (ICE, Electric)

BikeBE, Bolt Technology OU, DBDOYC Inc., GoShare Inc., Grab Holdings Ltd., Guinness Transporters Ltd., inDriver NA Inc., JoyRide, LA Taximoto, MAX BIKES SDN BHD, Motoboy Sao Paulo, Motolead Prestige, MOVE IT, OnlineAuction.com, Piickme Ltd., PT GoTo Gojek Tokopedia Tbk, Roppen Transportation Services, Ryde Technologies Pte. Ltd.​, Uber Technologies Inc. are a few of the key vendors in the Moto Taxi Service market.

APAC will register the highest growth rate of 59.5% among the other regions. Therefore, the Moto Taxi Service market in APAC is expected to garner significant business opportunities for the vendors during the forecast period.

China, India, Indonesia, Vietnam, Thailand, Singapore, Italy, Spain, France, UK, Germany, The Netherlands, Nigeria, Kenya, Egypt, South Africa, Morocco, Brazil, Colombia, Peru, US, Mexico, Canada

  • Increase in investments for moto taxi startups is the driving factor this market.

The Moto Taxi Service market vendors should focus on grabbing business opportunities from the Service segment as it accounted for the largest market share in the base year.